Fords: Fire Incidents, New Jersey (NJ)
Where are fire incidents reported in Fords, NJ
Something went wrong! Please refresh the page.
|
| |||||||||||||||||||||||||||||||||||||||||||||||||||||||||||||||||||||||||||||||||||||||||||||||||||||||||||||
2003 - 2018 National Fire Incident Reporting System (NFIRS) incidents
- Incident types reported to NFIRS in Fords, NJ
- 31441.8%Hazardous Condition
- 20627.4%Fire
- 729.6%False Alarm
- 658.7%Good Intent Call
- 638.4%Service Call
- 243.2%Rescue & EMS
- 50.7%Severe Weather
- 20.3%Special Incident
- Fire incident types reported to NFIRS in Fords, NJ
- 9043.7%Structure Fires
- 6833.0%Mobile Property/Vehicle Fires
- 4622.3%Outside Fires
- 21.0%Other
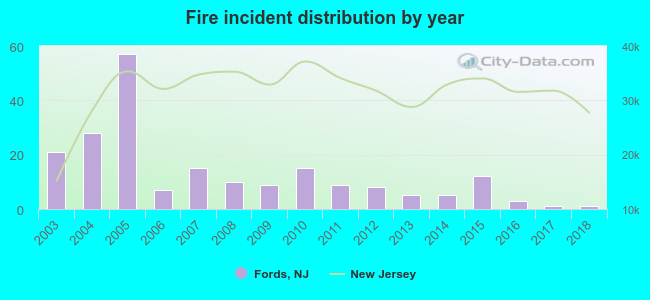 Based on the data from the years 2003 - 2018 the average number of fires per year is 13. The highest number of reported fire incidents - 57 took place in 2005, and the least - 1 in 2017. The data has a declining trend.
The average number of yearly fire incidents per 10k residents in Fords, NJ compared to nearest cities:
(Note: Based on data for the last 3 years, including only cities with population 5,000 and above)
| Fords: | 1.1 |
| Woodbridge: | 34.1 |
| Perth Amboy: | 32.8 |
| Metuchen: | 13.7 |
| Iselin: | 22.5 |
| Edison: | 3.6 |
| Avenel: | 25.3 |
| Colonia: | 16.5 |
| South Amboy: | 51.2 |

 36.4% incidents where reported in the morning and 63.6% in the evening. The most fires (17.5%) took place on Tuesday, and the least (10.2%) on Sunday.
 Based on the 206 fire incidents from years 2003 - 2018 most fires (16.5%) took place during July, and the least (1.9%) in November.
 Out of all 751 cases reported during the years 2003 - 2018, the most belonged to the categories: Rescue & EMS (41.8%), Fire (27.4%), and Good Intent Call (9.6%).
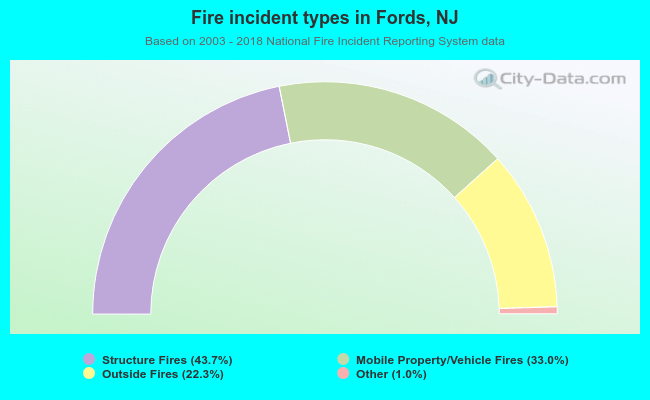 When looking into fire subcategories, the most reports belonged to: Structure Fires (43.7%), and Mobile Property/Vehicle Fires (33.0%).