Woodbridge: Fire Incidents, New Jersey (NJ)
Where are fire incidents reported in Woodbridge, NJ
Something went wrong! Please refresh the page.
| Fire incidents reported | |
|---|---|
| Sreet name | Count |
| WOODBRIDGE CENTER DR | 236 |
| RAHWAY AVE | 116 |
| MAIN ST | 100 |
| AMBOY AVE | 98 |
| WOODBRIDGE CENTER MALL | 82 |
| ST GEORGES AVE | 58 |
| PLAZA DR | 52 |
| GREEN ST | 50 |
| FULTON ST | 36 |
| 9 NORTH RT | 34 |
| BUNNS LN | 32 |
| CRICKET LN | 32 |
| FLORIDA GROVE RD | 28 |
| CUTTERS DOCK RD | 24 |
| FOX HILL RUN DR | 24 |
| NJ TURNPIKE REST AREA | 24 |
| ROANOKE ST | 24 |
| BARRON AVE | 22 |
| BROOK ST | 22 |
| STRAWBERRY HILL AVE | 22 |
| MAIN ST ST | 20 |
| PEARL ST | 20 |
| ALMON AVE | 18 |
| ROUTE 9 NORTH HWY | 18 |
| WALTER DR | 18 |
| AMBOY AVE AVE | 16 |
| RAHWAY AVE AVE | 16 |
| SCHOOL ST | 16 |
| US HIGHWAY 9 NORTH HWY | 16 |
| GROVE ST | 14 |
2004 - 2018 National Fire Incident Reporting System (NFIRS) incidents
- Incident types reported to NFIRS in Woodbridge, NJ
- 2,05740.7%Hazardous Condition
- 1,18623.5%Fire
- 73914.6%False Alarm
- 57111.3%Good Intent Call
- 3516.9%Service Call
- 1152.3%Rescue & EMS
- 320.6%Severe Weather
- Fire incident types reported to NFIRS in Woodbridge, NJ
- 54546.0%Outside Fires
- 41835.2%Structure Fires
- 17414.7%Mobile Property/Vehicle Fires
- 494.1%Other
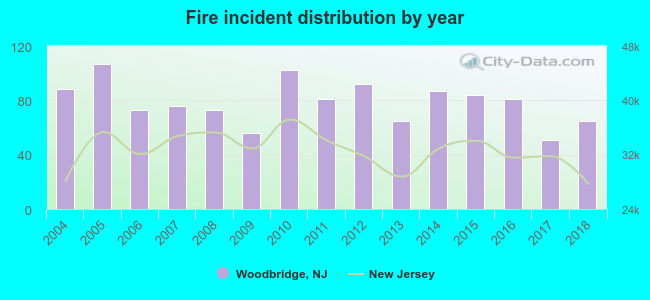 Based on the data from the years 2004 - 2018 the average number of fires per year is 79. The highest number of reported fire incidents - 107 took place in 2005, and the least - 51 in 2017. The data has a dropping trend.
The average number of yearly fire incidents per 10k residents in Woodbridge, NJ compared to nearest cities:
(Note: Based on data for the last 3 years, including only cities with population 5,000 and above)
| Woodbridge: | 34.1 |
| Avenel: | 25.3 |
| Fords: | 1.1 |
| Iselin: | 22.5 |
| Perth Amboy: | 32.8 |
| Colonia: | 16.5 |
| Carteret: | 24.1 |
| Rahway: | 51.8 |
| Metuchen: | 13.7 |
 The median response time based on all reported fire incidents is 5 minutes. This is similar to the state median value.
The median response time in Woodbridge, NJ compared to nearest cities:
(Note: Based on data for all years, including only cities with at least 500 fire incidents)
| Woodbridge: | 5 minutes |
| Avenel: | 4 minutes |
| Iselin: | 5 minutes |
| Perth Amboy: | 4 minutes |
| Colonia: | 5 minutes |
| Carteret: | 3 minutes |
| Rahway: | 3 minutes |
| Clark: | 6 minutes |
| South Amboy: | 3 minutes |
 Based on the reports from the years 2004 - 2018 the average number of fire-related yearly casualties is 1. The highest number of reported injuries - 4 took place in 2010, and the lowest - 0 in 2004. The data has an increasing trend.
The average number of injuries per 1,000 fires is 15. This indicator was the highest - 39 in 2007, and the lowest 0 in 2004. The trend for injuries per 1,000 incidents is rising. Compared to the state value the number of injuries per 1,000 fires is higher.
Based on the reports from the years 2004 - 2018 the average number of fire-related yearly casualties is 1. The highest number of reported injuries - 4 took place in 2010, and the lowest - 0 in 2004. The data has an increasing trend.
The average number of injuries per 1,000 fires is 15. This indicator was the highest - 39 in 2007, and the lowest 0 in 2004. The trend for injuries per 1,000 incidents is rising. Compared to the state value the number of injuries per 1,000 fires is higher.Casualties per 1,000 incidents in Woodbridge, NJ compared to nearest cities:
(Note: Based on data for all years, including only cities with at least 500 fire incidents)
| Woodbridge: | 15.2 |
| Avenel: | 4.7 |
| Iselin: | 5.1 |
| Perth Amboy: | 45.4 |
| Colonia: | 5.7 |
| Carteret: | 6.0 |
| Rahway: | 8.9 |
| Clark: | 14.5 |
| South Amboy: | 13.2 |
 29.0% incidents where reported in the morning and 71.0% in the evening. The most fires (15.9%) took place on Wednesday, and the least (12.5%) on Friday.
 Based on the 1,186 fire incident reports from years 2004 - 2018 most fires (12.8%) took place during April, and the least (5.6%) in February.
 Out of all 5,057 cases reported during the years 2004 - 2018, the most belonged to the categories: Hazardous Condition (40.7%), Fire (23.5%), and False Alarm (14.6%).
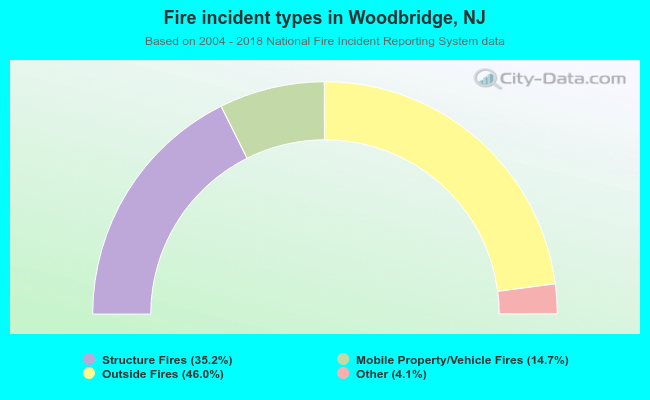 When looking into fire subcategories, the most reports belonged to: Outside Fires (46.0%), and Structure Fires (35.2%).