Rahway: Fire Incidents, New Jersey (NJ)
Where are fire incidents reported in Rahway, NJ
Something went wrong! Please refresh the page.
| Fire incidents reported | |
|---|---|
| Sreet name | Count |
| MILTON AVE | 778 |
| GRAND AVE | 158 |
| HAZELWOOD AVE | 100 |
| MAIN ST | 100 |
| ST. GEORGES AVE | 94 |
| CENTRAL AVE | 56 |
| ELIZABETH AVE | 52 |
| IRVING ST | 52 |
| ST GEORGES AVE | 50 |
| STATE HWY #1 | 48 |
| INMAN AVE | 40 |
| LINCOLN AVE | 40 |
| ELM AVE | 38 |
| ESSEX ST | 36 |
| HAMILTON ST | 36 |
| MADISON AVE | 36 |
| AUDREY DR | 34 |
| CHERRY ST | 34 |
| STONE ST | 32 |
| LAWRENCE ST | 30 |
| LEESVILLE AVE | 30 |
| STATE HWY1 | 30 |
| CITY HALL PLZ | 28 |
| CHURCH ST | 26 |
| LAKE AVE | 26 |
| NEW BRUNSWICK AVE | 26 |
| PATERSON ST | 26 |
| CITY HALL PLAZA | 24 |
| JAQUES AVE | 24 |
| ALBERMARLE ST | 22 |
2005 - 2018 National Fire Incident Reporting System (NFIRS) incidents
- Incident types reported to NFIRS in Rahway, NJ
- 4,37634.0%Hazardous Condition
- 2,46319.1%Rescue & EMS
- 2,12716.5%Service Call
- 1,68513.1%Fire
- 1,67913.0%False Alarm
- 4573.5%Good Intent Call
- 380.3%Severe Weather
- 320.2%Special Incident
- 250.2%Overpressure Rupture
- Fire incident types reported to NFIRS in Rahway, NJ
- 1,06263.0%Structure Fires
- 43125.6%Outside Fires
- 18711.1%Mobile Property/Vehicle Fires
- 50.3%Other
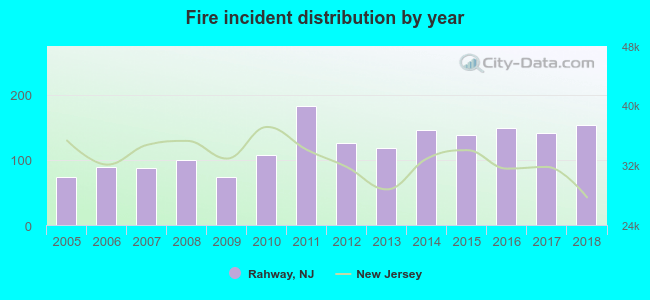 According to the data from the years 2005 - 2018 the average number of fires per year is 120. The highest number of fire incidents - 183 took place in 2011, and the least - 73 in 2009. The data has a growing trend.
The average number of yearly fire incidents per 10k residents in Rahway, NJ compared to nearest cities:
(Note: Based on data for the last 3 years, including only cities with population 5,000 and above)
| Rahway: | 51.8 |
| Avenel: | 25.3 |
| Clark: | 30.3 |
| Colonia: | 16.5 |
| Linden: | 28.5 |
| Iselin: | 22.5 |
| Carteret: | 24.1 |
| Roselle: | 24.1 |
| Woodbridge: | 34.1 |
 The median response time based on all reported fire incidents is 3 minutes. This is lower compared to the state median value.
The median response time in Rahway, NJ compared to nearest cities:
(Note: Based on data for all years, including only cities with at least 500 fire incidents)
| Rahway: | 3 minutes |
| Avenel: | 4 minutes |
| Clark: | 6 minutes |
| Colonia: | 5 minutes |
| Linden: | 4 minutes |
| Iselin: | 5 minutes |
| Carteret: | 3 minutes |
| Roselle: | 3 minutes |
| Woodbridge: | 5 minutes |
 According to the reports from the years 2005 - 2018 the average number of fire-related yearly deaths is 0. The highest number of reported deaths - 1 took place in 2005, and the lowest - 0 in 2007. The data has a dropping trend.
 Based on the reports from the years 2005 - 2018 the average number of fire-related yearly casualties is 1. The highest number of reported injuries - 7 took place in 2006, and the lowest - 0 in 2007. The data has a dropping trend.
The average number of casualties per 1,000 fire incidents is 12. This indicator was the highest - 79 in 2006, and the lowest 0 in 2007. The trend for casualties per 1,000 incidents is dropping. Compared to the New Jersey value the number of injuries per 1,000 fires is about the same.
Based on the reports from the years 2005 - 2018 the average number of fire-related yearly casualties is 1. The highest number of reported injuries - 7 took place in 2006, and the lowest - 0 in 2007. The data has a dropping trend.
The average number of casualties per 1,000 fire incidents is 12. This indicator was the highest - 79 in 2006, and the lowest 0 in 2007. The trend for casualties per 1,000 incidents is dropping. Compared to the New Jersey value the number of injuries per 1,000 fires is about the same.
 32.9% incidents where reported in the morning and 67.1% in the evening. The most fires (15.3%) took place on Thursday, and the least (13.2%) on Tuesday.
 Based on the 1,685 incident reports from years 2005 - 2018 most fires (10.2%) took place during May, and the least (5.8%) in October.
 Out of all 12,882 cases reported during the years 2005 - 2018, the most belonged to the categories: Hazardous Condition (34.0%), Rescue & EMS (19.1%), and Service Call (16.5%).
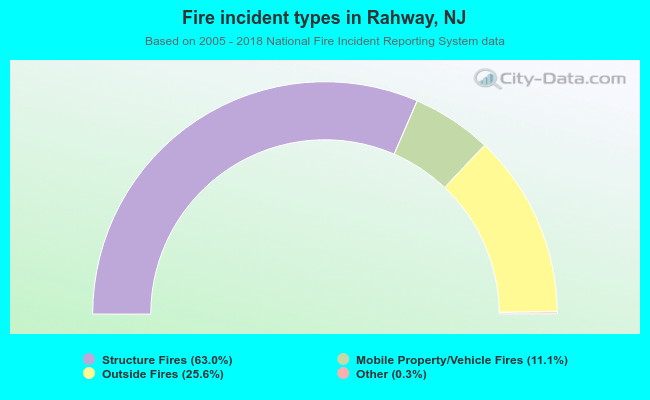 When looking into fire subcategories, the most reports belonged to: Structure Fires (63.0%), and Outside Fires (25.6%).