New Brunswick: Fire Incidents, New Jersey (NJ)
Where are fire incidents reported in New Brunswick, NJ
Something went wrong! Please refresh the page.
| Fire incidents reported | |
|---|---|
| Sreet name | Count |
| LIVINGSTON AVE | 84 |
| GEORGE ST | 76 |
| SOMERSET ST | 66 |
| EASTON AVE | 60 |
| JERSEY AVE | 58 |
| COLLEGE AVE | 40 |
| REMSEN AVE | 40 |
| HAMILTON ST | 36 |
| BALDWIN ST | 30 |
| FRENCH ST | 30 |
| SUYDAM ST | 30 |
| COMMERCIAL AVE | 26 |
| HANDY ST | 26 |
| JOYCE KILMER AVE | 26 |
| REDMOND ST | 26 |
| DELAVAN ST | 24 |
| MANOR CRESCENT DR | 20 |
| SEAMAN ST | 18 |
| ALBANY ST | 16 |
| EDPAS RD | 16 |
| NEW ST | 16 |
| RT 1 HWY S | 16 |
| THROOP AVE | 16 |
| BAYARD ST | 14 |
| COMSTOCK ST | 14 |
| PATERSON ST | 14 |
| PATTERSON ST | 14 |
| WELTON ST | 14 |
| CHESTER CIR | 12 |
| LOUIS ST | 12 |
2004 - 2018 National Fire Incident Reporting System (NFIRS) incidents
- Incident types reported to NFIRS in New Brunswick, NJ
- 2,39527.3%False Alarm
- 2,10624.0%Hazardous Condition
- 1,60718.3%Rescue & EMS
- 1,13412.9%Service Call
- 8629.8%Fire
- 6137.0%Good Intent Call
- 390.4%Special Incident
- 190.2%Overpressure Rupture
- Fire incident types reported to NFIRS in New Brunswick, NJ
- 43150.0%Structure Fires
- 25029.0%Outside Fires
- 12414.4%Mobile Property/Vehicle Fires
- 576.6%Other
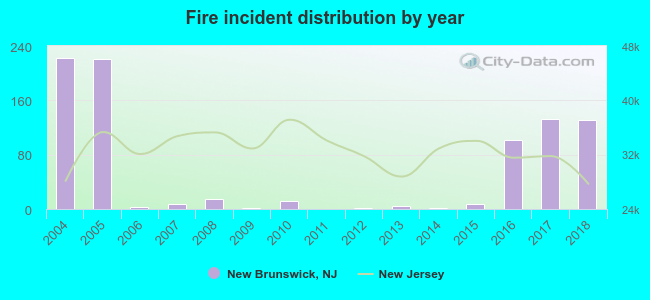 Based on the data from the years 2004 - 2018 the average number of fires per year is 57. The highest number of reported fires - 222 took place in 2004, and the least - 0 in 2011. The data has a decreasing trend.
The average number of yearly fire incidents per 10k residents in New Brunswick, NJ compared to nearest cities:
(Note: Based on data for the last 3 years, including only cities with population 5,000 and above)
| New Brunswick: | 21.3 |
| Highland Park: | 19.4 |
| Somerset: | 43.2 |
| Milltown: | 17.5 |
| East Brunswick: | 18.2 |
| South River: | 15.5 |
| Edison: | 3.6 |
| Metuchen: | 13.7 |
| Middlesex: | 2.9 |
 The median response time based on all reported fire incidents is 3 minutes. This is lower than the New Jersey median value.
The median response time in New Brunswick, NJ compared to nearest cities:
(Note: Based on data for all years, including only cities with at least 500 fire incidents)
| New Brunswick: | 3 minutes |
| Highland Park: | 2 minutes |
| Voorhees: | 6 minutes |
| Somerset: | 8 minutes |
| East Brunswick: | 5 minutes |
| South Plainfield: | 4 minutes |
| Sayreville: | 5 minutes |
| South Amboy: | 3 minutes |
| Old Bridge: | 4 minutes |
 Based on the data from the years 2004 - 2018 the average number of fire-related yearly casualties is 1. The highest number of reported casualties - 5 took place in 2004, and the lowest - 0 in 2006. The data has a declining trend.
The average number of injuries per 1,000 fire incidents is 4. This indicator was the highest - 23 in 2004, and the lowest 0 in 2006. The trend for injuries per 1,000 incidents is dropping. Compared to the state value the number of injuries per 1,000 incidents is higher.
Based on the data from the years 2004 - 2018 the average number of fire-related yearly casualties is 1. The highest number of reported casualties - 5 took place in 2004, and the lowest - 0 in 2006. The data has a declining trend.
The average number of injuries per 1,000 fire incidents is 4. This indicator was the highest - 23 in 2004, and the lowest 0 in 2006. The trend for injuries per 1,000 incidents is dropping. Compared to the state value the number of injuries per 1,000 incidents is higher.Casualties per 1,000 incidents in New Brunswick, NJ compared to nearest cities:
(Note: Based on data for all years, including only cities with at least 500 fire incidents)
| New Brunswick: | 11.6 |
| Highland Park: | 7.3 |
| Voorhees: | 2.7 |
| Somerset: | 5.0 |
| East Brunswick: | 7.0 |
| South Plainfield: | 21.8 |
| Sayreville: | 17.3 |
| South Amboy: | 13.2 |
| Old Bridge: | 9.9 |
 33.4% incidents where reported in the morning and 66.6% in the evening. The most fires (16.6%) took place on Thursday, and the least (13.2%) on Sunday.
 According to the 862 incident reports from years 2004 - 2018 most fires (11.6%) took place during July, and the least (5.8%) in May.
 Out of all 8,777 cases reported during the years 2004 - 2018, the most belonged to the categories: False Alarm (27.3%), Hazardous Condition (24.0%), and Rescue & EMS (18.3%).
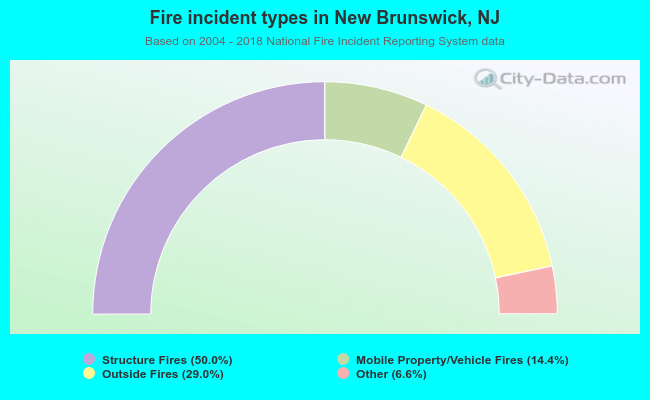 When looking into fire subcategories, the most incidents belonged to: Structure Fires (50.0%), and Outside Fires (29.0%).