Somerset: Fire Incidents, New Jersey (NJ)
Where are fire incidents reported in Somerset, NJ
Something went wrong! Please refresh the page.
| Fire incidents reported | |
|---|---|
| Sreet name | Count |
| EASTON AVE | 190 |
| HAMILTON ST | 128 |
| DAVIDSON AVE | 70 |
| FRANKLIN BLVD | 70 |
| AMWELL ROAD | 52 |
| EASTON AVENUE | 42 |
| EASTON AVE | 34 |
| ELIZABETH AVENUE | 34 |
| GIRARD AVE | 34 |
| VERONICA AVE | 32 |
| DAVIDSON AVE | 28 |
| DEMOTT LANE | 28 |
| HIGHLAND AVE | 28 |
| ROUTE 27 | 28 |
| RTE 287 | 28 |
| SOMERSET ST | 28 |
| AMWELL RD | 26 |
| ATRIUM DR | 26 |
| CEDAR GROVE LANE | 24 |
| EASTON | 24 |
| HILLCREST AVE | 24 |
| PHILLIPS RD | 24 |
| CEDAR GROVE LANE | 22 |
| CHURCHILL AVE | 22 |
| HEMPSTEAD DR | 22 |
| JFK BLVD | 22 |
| DAVIDSON AVENUE | 20 |
| ELIZABETH AVE | 20 |
| FULTON RD | 20 |
| HAMILTON STREET | 20 |
| Other | 1,023 |
2003 - 2018 National Fire Incident Reporting System (NFIRS) incidents
- Incident types reported to NFIRS in Somerset, NJ
- 2,58424.4%Service Call
- 2,56724.3%Hazardous Condition
- 2,33222.1%False Alarm
- 2,19320.7%Fire
- 6175.8%Good Intent Call
- 2722.6%Rescue & EMS
- Fire incident types reported to NFIRS in Somerset, NJ
- 98044.7%Structure Fires
- 71632.6%Outside Fires
- 34015.5%Mobile Property/Vehicle Fires
- 1577.2%Other
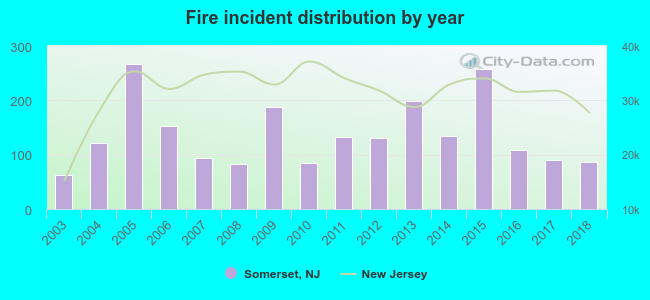 Based on the data from the years 2003 - 2018 the average number of fire incidents per year is 137. The highest number of reported fire incidents - 267 took place in 2005, and the least - 63 in 2003. The data has a rising trend.
The average number of yearly fire incidents per 10k residents in Somerset, NJ compared to nearest cities:
(Note: Based on data for the last 3 years, including only cities with population 5,000 and above)
| Somerset: | 43.2 |
| New Brunswick: | 21.3 |
| Highland Park: | 19.4 |
| Milltown: | 17.5 |
| Middlesex: | 2.9 |
| Bound Brook: | 2.4 |
| East Brunswick: | 18.2 |
| Edison: | 3.6 |
| Dunellen: | 9.0 |
 The median response time based on all reported fire incidents is 8 minutes. This is higher than the New Jersey median value.
The median response time in Somerset, NJ compared to nearest cities:
(Note: Based on data for all years, including only cities with at least 500 fire incidents)
| Somerset: | 8 minutes |
| Voorhees: | 6 minutes |
| New Brunswick: | 3 minutes |
| Highland Park: | 2 minutes |
| East Brunswick: | 5 minutes |
| South Plainfield: | 4 minutes |
| Somerville: | 3 minutes |
| Sayreville: | 5 minutes |
| Monmouth Junction: | 6 minutes |
 Based on the reports from the years 2003 - 2018 the average number of fire-related casualties per year is 1. The highest number of casualties - 5 took place in 2005, and the lowest - 0 in 2003. The data has a constant trend.
The average number of injuries per 1,000 fires is 4. This indicator was the highest - 19 in 2005, and the lowest 0 in 2003. The trend for casualties per 1,000 fire incidents is constant. Compared to the New Jersey value the number of casualties per 1,000 fires is lower.
Based on the reports from the years 2003 - 2018 the average number of fire-related casualties per year is 1. The highest number of casualties - 5 took place in 2005, and the lowest - 0 in 2003. The data has a constant trend.
The average number of injuries per 1,000 fires is 4. This indicator was the highest - 19 in 2005, and the lowest 0 in 2003. The trend for casualties per 1,000 fire incidents is constant. Compared to the New Jersey value the number of casualties per 1,000 fires is lower.Casualties per 1,000 incidents in Somerset, NJ compared to nearest cities:
(Note: Based on data for all years, including only cities with at least 500 fire incidents)
| Somerset: | 5.0 |
| Voorhees: | 2.7 |
| New Brunswick: | 11.6 |
| Highland Park: | 7.3 |
| East Brunswick: | 7.0 |
| South Plainfield: | 21.8 |
| Somerville: | 6.1 |
| Sayreville: | 17.3 |
| Monmouth Junction: | 15.6 |
 29.1% incidents where reported in the morning and 70.9% in the evening. The most fires (15.1%) took place on Monday, and the least (13.0%) on Wednesday.
 Based on the 2,193 fire incident reports from years 2003 - 2018 most fires (11.8%) took place during April, and the least (6.3%) in October.
 Out of all 10,574 cases reported during the years 2003 - 2018, the most belonged to the categories: Service Call (24.4%), Hazardous Condition (24.3%), and False Alarm (22.1%).
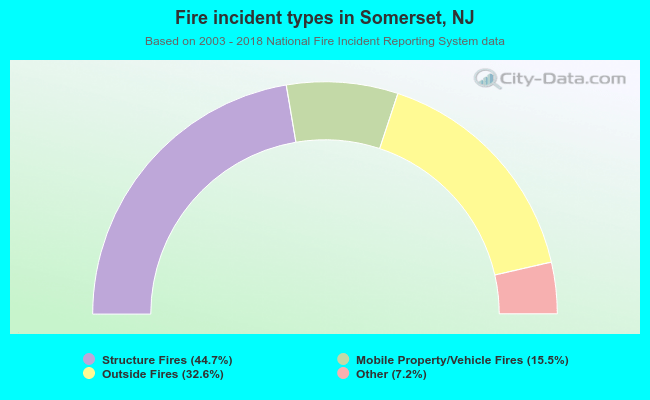 When looking into fire subcategories, the most incidents belonged to: Structure Fires (44.7%), and Outside Fires (32.6%).