Dolton: Fire Incidents, Illinois (IL)
Where are fire incidents reported in Dolton, IL
Something went wrong! Please refresh the page.
| Fire incidents reported | |
|---|---|
| Sreet name | Count |
| SIBLEY BLVD | 318 |
| COTTAGE GROVE AVE | 288 |
| CHICAGO RD | 244 |
| LINCOLN AVE | 206 |
| 142ND ST | 188 |
| INDIANA AVE | 142 |
| WOODLAWN AVE | 102 |
| 154TH ST | 100 |
| COTTAGE GROVE | 94 |
| I-94 | 94 |
| GRANT ST | 92 |
| PARK AVE | 88 |
| 138TH ST | 84 |
| 144TH ST | 84 |
| DOBSON AVE | 84 |
| ELLIS AVE | 84 |
| UNIVERSITY AVE | 84 |
| DANTE AVE | 82 |
| 158TH ST | 80 |
| GREENWOOD RD | 78 |
| DORCHESTER AVE | 76 |
| KIMBARK AVE | 72 |
| DREXEL AVE | 70 |
| IRVING AVE | 68 |
| 146TH ST | 66 |
| I94 | 66 |
| INGLESIDE AVE | 58 |
| SIBLEY | 56 |
| OAK ST | 54 |
| AVALON AVE | 48 |
2002 - 2018 National Fire Incident Reporting System (NFIRS) incidents
- Incident types reported to NFIRS in Dolton, IL
- 15,63864.2%Rescue & EMS
- 3,23613.3%Fire
- 2,1668.9%Hazardous Condition
- 1,6666.8%False Alarm
- 8813.6%Good Intent Call
- 7223.0%Service Call
- 270.1%Overpressure Rupture
- Fire incident types reported to NFIRS in Dolton, IL
- 2,13666.0%Structure Fires
- 56017.3%Mobile Property/Vehicle Fires
- 48314.9%Outside Fires
- 571.8%Other
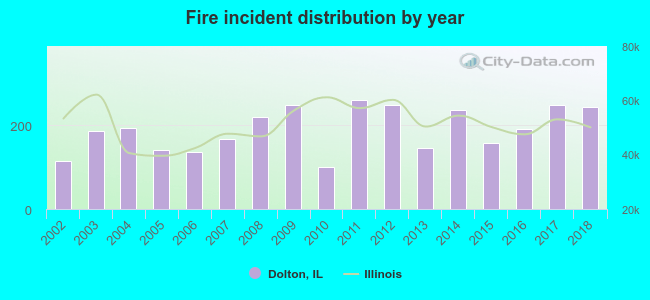 Based on the data from the years 2002 - 2018 the average number of fire incidents per year is 190. The highest number of reported fire incidents - 259 took place in 2011, and the least - 101 in 2010. The data has a growing trend.
The average number of yearly fire incidents per 10k residents in Dolton, IL compared to nearest cities:
(Note: Based on data for the last 3 years, including only cities with population 5,000 and above)
| Dolton: | 97.7 |
| Riverdale: | 97.3 |
| South Holland: | 57.7 |
| Calumet City: | 61.8 |
| Harvey: | 134.0 |
| Calumet Park: | 124.0 |
| Posen: | 48.7 |
| Blue Island: | 60.4 |
| Lansing: | 37.2 |
 The median response time based on all reported fire incidents is 5 minutes. This is about the same as the state median value.
The median response time in Dolton, IL compared to nearest cities:
(Note: Based on data for all years, including only cities with at least 500 fire incidents)
| Dolton: | 5 minutes |
| Riverdale: | 5 minutes |
| South Holland: | 5 minutes |
| Burnham: | 7 minutes |
| Calumet City: | 5 minutes |
| Harvey: | 3 minutes |
| Calumet Park: | 5 minutes |
| Posen: | 4 minutes |
| Blue Island: | 5 minutes |
 Based on the data from the years 2002 - 2018 the average number of fire-related casualties per year is 2. The highest number of reported injuries - 7 took place in 2007, and the lowest - 0 in 2002. The data has a growing trend.
The average number of casualties per 1,000 fire incidents is 8. This indicator was the highest - 42 in 2007, and the lowest 0 in 2002. The trend for casualties per 1,000 incidents is rising. Compared to the state value the number of casualties per 1,000 incidents is lower.
Based on the data from the years 2002 - 2018 the average number of fire-related casualties per year is 2. The highest number of reported injuries - 7 took place in 2007, and the lowest - 0 in 2002. The data has a growing trend.
The average number of casualties per 1,000 fire incidents is 8. This indicator was the highest - 42 in 2007, and the lowest 0 in 2002. The trend for casualties per 1,000 incidents is rising. Compared to the state value the number of casualties per 1,000 incidents is lower.Casualties per 1,000 incidents in Dolton, IL compared to nearest cities:
(Note: Based on data for all years, including only cities with at least 500 fire incidents)
| Dolton: | 8.3 |
| Riverdale: | 8.6 |
| South Holland: | 22.0 |
| Burnham: | 5.9 |
| Calumet City: | 6.7 |
| Harvey: | 10.1 |
| Calumet Park: | 1.0 |
| Posen: | 1.5 |
| Blue Island: | 13.3 |
 37.9% incidents where reported in the morning and 62.1% in the evening. The most fires (16.4%) took place on Saturday, and the least (12.4%) on Tuesday.
 According to the 3,236 reports from years 2002 - 2018 most fires (14.0%) took place during July, and the least (5.5%) in January.
 Out of all 24,356 cases reported during the years 2002 - 2018, the most belonged to the categories: Rescue & EMS (64.2%), Fire (13.3%), and Hazardous Condition (8.9%).
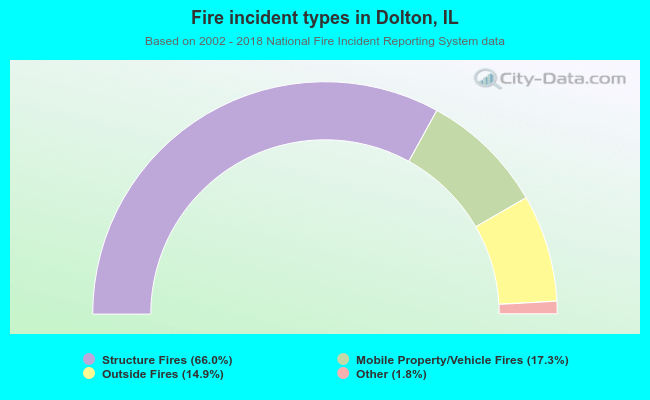 When looking into fire subcategories, the most incidents belonged to: Structure Fires (66.0%), and Mobile Property/Vehicle Fires (17.3%).