South Holland: Fire Incidents, Illinois (IL)
Where are fire incidents reported in South Holland, IL
Something went wrong! Please refresh the page.
| Fire incidents reported | |
|---|---|
| Sreet name | Count |
| 162ND ST | 278 |
| STATE ST | 84 |
| RIVERSIDE DR | 66 |
| 172ND ST | 64 |
| SOUTH PARK AVE | 62 |
| I94 EXPY | 60 |
| 170TH ST | 56 |
| DREXEL AVE | 46 |
| EVANS AVE | 46 |
| VAN DAM RD | 46 |
| PERRY AVE | 44 |
| VINCENNES AVE | 44 |
| PRINCE DR | 40 |
| 154TH ST | 38 |
| GREENWOOD AVE | 38 |
| I294 EXPY | 38 |
| ORCHID DR | 38 |
| 168TH PL | 36 |
| CANAL ST | 36 |
| I-94 EXPY | 36 |
| 160TH PL | 34 |
| PARK AVE | 34 |
| 159TH PL | 32 |
| 169TH ST | 32 |
| I-294 EXPY | 32 |
| KIMBARK AVE | 32 |
| PAXTON AVE | 30 |
| 161ST PL | 28 |
| DOBSON AVE | 28 |
| ELLIS AVE | 28 |
| Other | 448 |
2002 - 2018 National Fire Incident Reporting System (NFIRS) incidents
- Incident types reported to NFIRS in South Holland, IL
- 15,53562.0%Rescue & EMS
- 2,60710.4%Hazardous Condition
- 2,2448.9%False Alarm
- 1,9547.8%Fire
- 1,3365.3%Good Intent Call
- 1,3335.3%Service Call
- 380.2%Overpressure Rupture
- Fire incident types reported to NFIRS in South Holland, IL
- 1,06654.6%Structure Fires
- 44422.7%Mobile Property/Vehicle Fires
- 37819.3%Outside Fires
- 663.4%Other
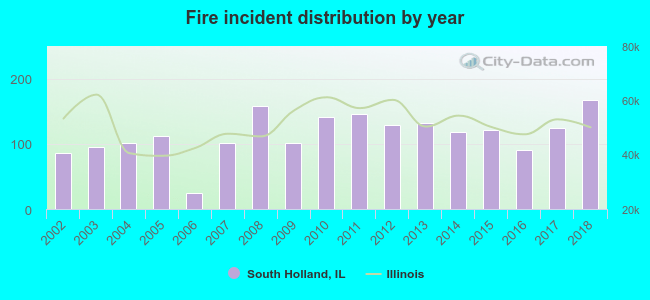 Based on the data from the years 2002 - 2018 the average number of fire incidents per year is 115. The highest number of fires - 167 took place in 2018, and the least - 25 in 2006. The data has a rising trend.
The average number of yearly fire incidents per 10k residents in South Holland, IL compared to nearest cities:
(Note: Based on data for the last 3 years, including only cities with population 5,000 and above)
| South Holland: | 57.7 |
| Dolton: | 97.7 |
| Harvey: | 134.0 |
| Calumet City: | 61.8 |
| Riverdale: | 97.3 |
| Lansing: | 37.2 |
| Glenwood: | 46.1 |
| Homewood: | 44.9 |
| Markham: | 111.1 |
 The median response time based on all reported fire incidents is 5 minutes. This is comparable to the Illinois median value.
The median response time in South Holland, IL compared to nearest cities:
(Note: Based on data for all years, including only cities with at least 500 fire incidents)
| South Holland: | 5 minutes |
| Dolton: | 5 minutes |
| Harvey: | 3 minutes |
| Calumet City: | 5 minutes |
| Riverdale: | 5 minutes |
| Lansing: | 3 minutes |
| Burnham: | 7 minutes |
| Glenwood: | 5 minutes |
| Homewood: | 5 minutes |
 According to the data from the years 2002 - 2018 the average number of fire-related yearly deaths is 0. The highest number of deaths - 2 took place in 2005, and the lowest - 0 in 2003. The data has a constant trend.
 According to the reports from the years 2002 - 2018 the average number of fire-related casualties per year is 3. The highest number of reported casualties - 7 took place in 2002, and the lowest - 0 in 2006. The data has a declining trend.
The average number of casualties per 1,000 fires is 22. This indicator was the highest - 81 in 2002, and the lowest 0 in 2006. The trend for injuries per 1,000 incidents is declining. Compared to the Illinois value the number of casualties per 1,000 fire incidents is higher.
According to the reports from the years 2002 - 2018 the average number of fire-related casualties per year is 3. The highest number of reported casualties - 7 took place in 2002, and the lowest - 0 in 2006. The data has a declining trend.
The average number of casualties per 1,000 fires is 22. This indicator was the highest - 81 in 2002, and the lowest 0 in 2006. The trend for injuries per 1,000 incidents is declining. Compared to the Illinois value the number of casualties per 1,000 fire incidents is higher.
 36.4% incidents where reported in the morning and 63.6% in the evening. The most fires (17.1%) took place on Monday, and the least (12.6%) on Tuesday.
 According to the 1,954 fire incidents from years 2002 - 2018 most fires (10.7%) took place during July, and the least (6.8%) in November.
 Out of all 25,073 cases reported during the years 2002 - 2018, the most belonged to the categories: Rescue & EMS (62.0%), Hazardous Condition (10.4%), and False Alarm (8.9%).
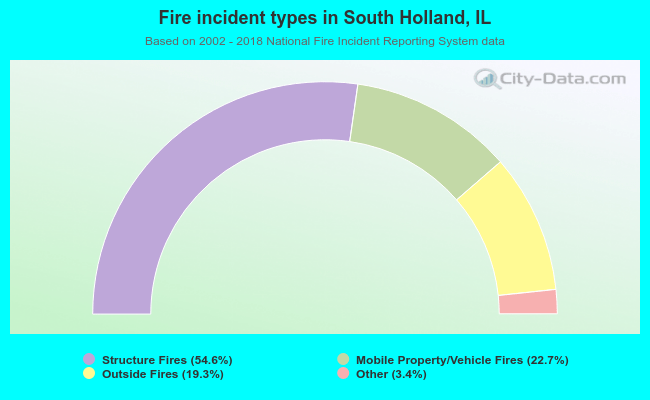 When looking into fire subcategories, the most reports belonged to: Structure Fires (54.6%), and Mobile Property/Vehicle Fires (22.7%).