Calumet Park: Fire Incidents, Illinois (IL)
Where are fire incidents reported in Calumet Park, IL
Something went wrong! Please refresh the page.
|
| |||||||||||||||||||||||||||||||||||||||||||||||||||||||||||||||||||||||||||||||||||||||||||||||||||||||||||||
2002 - 2018 National Fire Incident Reporting System (NFIRS) incidents
- Incident types reported to NFIRS in Calumet Park, IL
- 4,02948.1%Rescue & EMS
- 1,04412.5%Good Intent Call
- 97611.7%Fire
- 97011.6%False Alarm
- 7018.4%Service Call
- 6117.3%Hazardous Condition
- 190.2%Special Incident
- 150.2%Overpressure Rupture
- Fire incident types reported to NFIRS in Calumet Park, IL
- 60261.7%Structure Fires
- 20921.4%Mobile Property/Vehicle Fires
- 10110.3%Outside Fires
- 646.6%Other
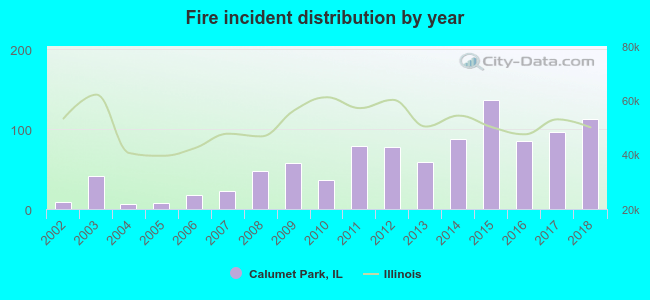 Based on the data from the years 2002 - 2018 the average number of fires per year is 57. The highest number of fires - 136 took place in 2015, and the least - 6 in 2004. The data has a growing trend.
The average number of yearly fire incidents per 10k residents in Calumet Park, IL compared to nearest cities:
(Note: Based on data for the last 3 years, including only cities with population 5,000 and above)
| Calumet Park: | 124.0 |
| Blue Island: | 60.4 |
| Riverdale: | 97.3 |
| Posen: | 48.7 |
| Robbins: | 109.5 |
| Harvey: | 134.0 |
| Alsip: | 49.4 |
| Dolton: | 97.7 |
| Midlothian: | 59.0 |
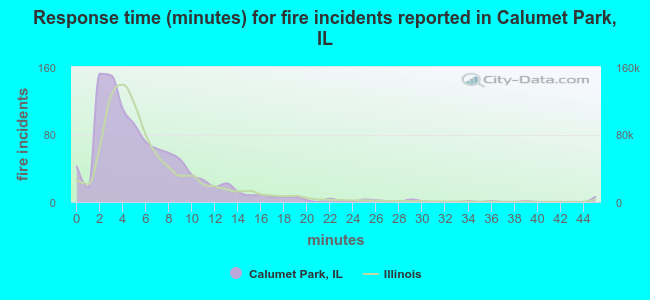 The median response time based on all reported fire incidents is 5 minutes. This is comparable to the state median value.
The median response time in Calumet Park, IL compared to nearest cities:
(Note: Based on data for all years, including only cities with at least 500 fire incidents)
| Calumet Park: | 5 minutes |
| Blue Island: | 5 minutes |
| Riverdale: | 5 minutes |
| Posen: | 4 minutes |
| Robbins: | 6 minutes |
| Harvey: | 3 minutes |
| Alsip: | 5 minutes |
| Dolton: | 5 minutes |
| Midlothian: | 4 minutes |
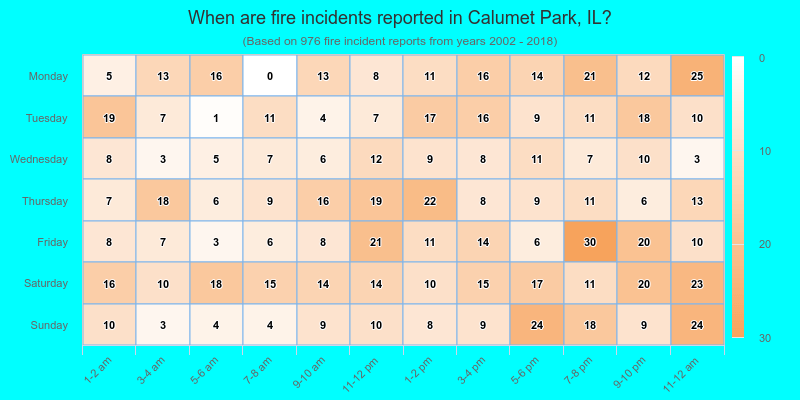
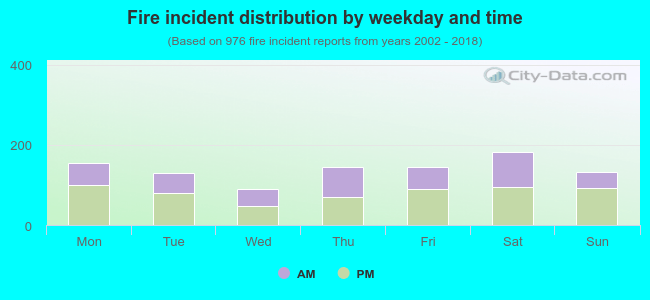 41.0% incidents where reported in the morning and 59.0% in the evening. The most fires (18.8%) took place on Saturday, and the least (9.1%) on Wednesday.
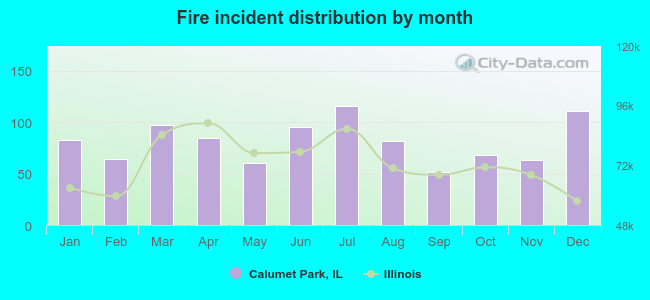 According to the 976 reports from years 2002 - 2018 most fires (11.9%) took place during July, and the least (5.3%) in September.
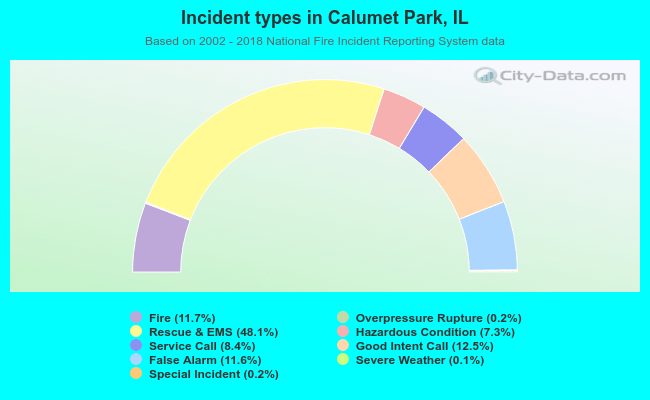 Out of all 8,372 cases reported during the years 2002 - 2018, the most belonged to the categories: Rescue & EMS (48.1%), Good Intent Call (12.5%), and Fire (11.7%).
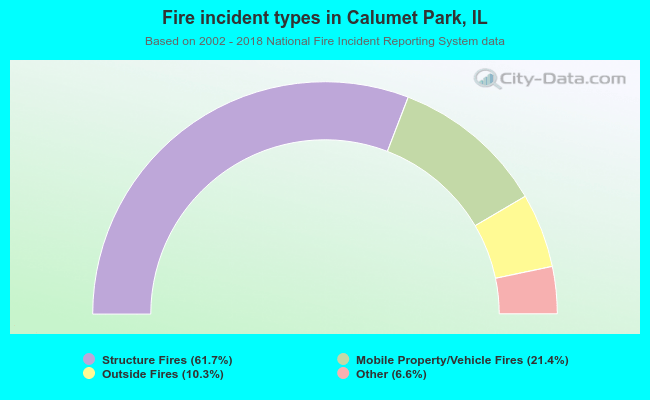 When looking into fire subcategories, the most incidents belonged to: Structure Fires (61.7%), and Mobile Property/Vehicle Fires (21.4%).