Alsip: Fire Incidents, Illinois (IL)
Where are fire incidents reported in Alsip, IL
Something went wrong! Please refresh the page.
| Fire incidents reported | |
|---|---|
| Sreet name | Count |
| PULASKI RD | 256 |
| CICERO AVE | 186 |
| 127TH ST | 118 |
| I294 HWY | 86 |
| KOSTNER AVE | 74 |
| 120TH ST | 68 |
| KENNETH AVE | 66 |
| 115TH ST | 64 |
| CENTRAL AVE | 60 |
| 111TH ST | 58 |
| PULASKI | 54 |
| 123RD ST | 52 |
| 124TH PL | 52 |
| KARLOV AVE | 48 |
| 131ST ST | 44 |
| PULASKI AVE | 40 |
| 122ND ST | 38 |
| 130TH ST | 38 |
| CICERO | 38 |
| CICERO AV | 38 |
| 118TH ST | 36 |
| 129TH ST | 36 |
| LOMBARD LN | 36 |
| LARAMIE AVE | 34 |
| KENNETH | 32 |
| 119TH ST | 30 |
| 128TH PL | 28 |
| PULASKI AV | 26 |
| 294 | 22 |
| 115TH PL | 20 |
2002 - 2018 National Fire Incident Reporting System (NFIRS) incidents
- Incident types reported to NFIRS in Alsip, IL
- 11,93658.2%Rescue & EMS
- 2,61412.7%False Alarm
- 1,7448.5%Hazardous Condition
- 1,5997.8%Fire
- 1,3076.4%Service Call
- 1,2576.1%Good Intent Call
- 370.2%Special Incident
- Fire incident types reported to NFIRS in Alsip, IL
- 78248.9%Structure Fires
- 38924.3%Outside Fires
- 33220.8%Mobile Property/Vehicle Fires
- 966.0%Other
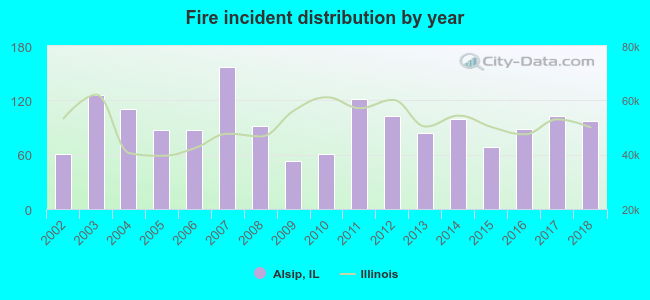 Based on the data from the years 2002 - 2018 the average number of fire incidents per year is 94. The highest number of reported fire incidents - 157 took place in 2007, and the least - 53 in 2009. The data has an increasing trend.
The average number of yearly fire incidents per 10k residents in Alsip, IL compared to nearest cities:
(Note: Based on data for the last 3 years, including only cities with population 5,000 and above)
| Alsip: | 49.4 |
| Crestwood: | 51.7 |
| Robbins: | 109.5 |
| Blue Island: | 60.4 |
| Midlothian: | 59.0 |
| Chicago Ridge: | 54.5 |
| Oak Lawn: | 33.4 |
| Worth: | 50.1 |
| Palos Heights: | 34.7 |
 The median response time based on all reported fire incidents is 5 minutes. This is about the same as the Illinois median value.
The median response time in Alsip, IL compared to nearest cities:
(Note: Based on data for all years, including only cities with at least 500 fire incidents)
| Alsip: | 5 minutes |
| Crestwood: | 4 minutes |
| Robbins: | 6 minutes |
| Blue Island: | 5 minutes |
| Midlothian: | 4 minutes |
| Chicago Ridge: | 5 minutes |
| Oak Lawn: | 5 minutes |
| Worth: | 4 minutes |
| Palos Heights: | 6 minutes |
 According to the reports from the years 2002 - 2018 the average number of fire-related yearly casualties is 1. The highest number of casualties - 6 took place in 2004, and the lowest - 0 in 2005. The data has a decreasing trend.
The average number of injuries per 1,000 fires is 15. This indicator was the highest - 55 in 2004, and the lowest 0 in 2005. The trend for injuries per 1,000 fire incidents is dropping. Compared to the state value the number of injuries per 1,000 fire incidents is higher.
According to the reports from the years 2002 - 2018 the average number of fire-related yearly casualties is 1. The highest number of casualties - 6 took place in 2004, and the lowest - 0 in 2005. The data has a decreasing trend.
The average number of injuries per 1,000 fires is 15. This indicator was the highest - 55 in 2004, and the lowest 0 in 2005. The trend for injuries per 1,000 fire incidents is dropping. Compared to the state value the number of injuries per 1,000 fire incidents is higher.Casualties per 1,000 incidents in Alsip, IL compared to nearest cities:
(Note: Based on data for all years, including only cities with at least 500 fire incidents)
| Alsip: | 15.0 |
| Crestwood: | 64.6 |
| Robbins: | 5.1 |
| Blue Island: | 13.3 |
| Midlothian: | 29.2 |
| Chicago Ridge: | 6.1 |
| Oak Lawn: | 10.6 |
| Worth: | 3.8 |
| Palos Heights: | 7.2 |
 35.8% incidents where reported in the morning and 64.2% in the evening. The most fires (16.5%) took place on Sunday, and the least (12.1%) on Monday.
 According to the 1,599 fire incident reports from years 2002 - 2018 most fires (14.1%) took place during May, and the least (5.3%) in September.
 Out of all 20,516 cases reported during the years 2002 - 2018, the most belonged to the categories: Rescue & EMS (58.2%), False Alarm (12.7%), and Hazardous Condition (8.5%).
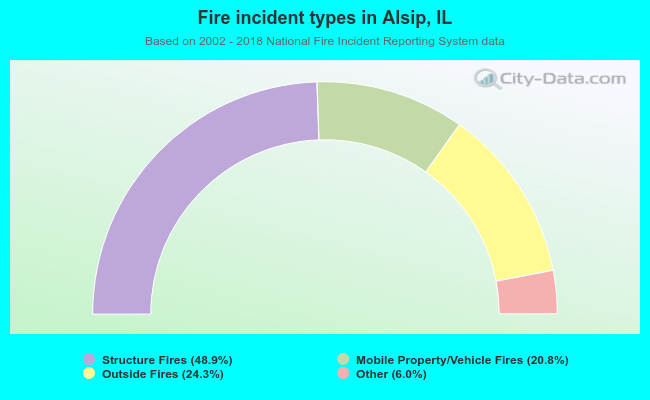 When looking into fire subcategories, the most reports belonged to: Structure Fires (48.9%), and Outside Fires (24.3%).