Chicago Ridge: Fire Incidents, Illinois (IL)
Where are fire incidents reported in Chicago Ridge, IL
Something went wrong! Please refresh the page.
| Fire incidents reported | |
|---|---|
| Sreet name | Count |
| RIDGELAND AVE | 116 |
| RIDGELAND AV | 92 |
| CHICAGO RIDGE MALL DR | 76 |
| 111TH ST | 58 |
| HARLEM AVE | 56 |
| SOUTHWEST HWY | 52 |
| BROOKS LN | 50 |
| SAYRE AVE | 44 |
| 106TH ST | 42 |
| RIDGELAND | 40 |
| 107TH ST | 38 |
| 99TH ST | 38 |
| HARLEM AV | 38 |
| 95TH ST | 36 |
| SOUTHWEST HY | 34 |
| 103RD ST | 32 |
| 104TH PL | 30 |
| ANDERSON AVE | 30 |
| 100TH ST | 28 |
| WASHINGTON ST | 28 |
| COMMONS DR | 24 |
| NOTTINGHAM AV | 24 |
| ANDERSON DR | 22 |
| NOTTINGHAM | 22 |
| PARKSIDE AV | 22 |
| SAYRE AV | 22 |
| MAJOR AV | 20 |
| MAJOR AVE | 20 |
| PARKSIDE AVE | 20 |
| SOUTHWEST BRIDGE | 20 |
2002 - 2018 National Fire Incident Reporting System (NFIRS) incidents
- Incident types reported to NFIRS in Chicago Ridge, IL
- 7,75952.0%Rescue & EMS
- 2,07713.9%False Alarm
- 1,59510.7%Hazardous Condition
- 1,50510.1%Good Intent Call
- 1,1447.7%Fire
- 7995.4%Service Call
- 340.2%Overpressure Rupture
- Fire incident types reported to NFIRS in Chicago Ridge, IL
- 66057.7%Structure Fires
- 28324.7%Outside Fires
- 15313.4%Mobile Property/Vehicle Fires
- 484.2%Other
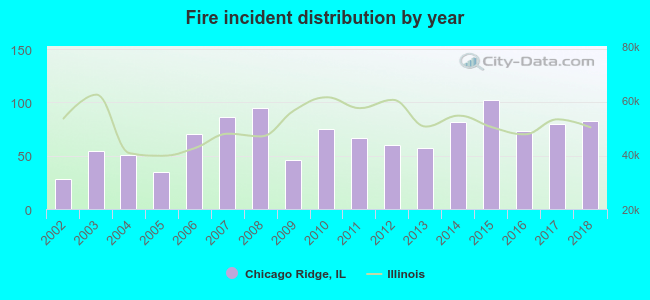 Based on the data from the years 2002 - 2018 the average number of fires per year is 67. The highest number of fire incidents - 102 took place in 2015, and the least - 28 in 2002. The data has a rising trend.
The average number of yearly fire incidents per 10k residents in Chicago Ridge, IL compared to nearest cities:
(Note: Based on data for the last 3 years, including only cities with population 5,000 and above)
| Chicago Ridge: | 54.5 |
| Worth: | 50.1 |
| Oak Lawn: | 33.4 |
| Palos Hills: | 37.6 |
| Palos Heights: | 34.7 |
| Hickory Hills: | 40.0 |
| Burbank: | 31.9 |
| Bridgeview: | 83.7 |
| Alsip: | 49.4 |
 The median response time based on all reported fire incidents is 5 minutes. This is close to the Illinois median value.
The median response time in Chicago Ridge, IL compared to nearest cities:
(Note: Based on data for all years, including only cities with at least 500 fire incidents)
| Chicago Ridge: | 5 minutes |
| Worth: | 4 minutes |
| Oak Lawn: | 5 minutes |
| Palos Hills: | 4 minutes |
| Palos Heights: | 6 minutes |
| Hickory Hills: | 4 minutes |
| Burbank: | 4 minutes |
| Bridgeview: | 5 minutes |
| Alsip: | 5 minutes |
 According to the data from the years 2002 - 2018 the average number of fire-related casualties per year is 0. The highest number of reported injuries - 2 took place in 2011, and the lowest - 0 in 2002. The data has a constant trend.
The average number of injuries per 1,000 fires is 6. This indicator was the highest - 30 in 2011, and the lowest 0 in 2002. The trend for injuries per 1,000 fire incidents is constant. Compared to the state value the number of injuries per 1,000 incidents is lower.
According to the data from the years 2002 - 2018 the average number of fire-related casualties per year is 0. The highest number of reported injuries - 2 took place in 2011, and the lowest - 0 in 2002. The data has a constant trend.
The average number of injuries per 1,000 fires is 6. This indicator was the highest - 30 in 2011, and the lowest 0 in 2002. The trend for injuries per 1,000 fire incidents is constant. Compared to the state value the number of injuries per 1,000 incidents is lower.Casualties per 1,000 incidents in Chicago Ridge, IL compared to nearest cities:
(Note: Based on data for all years, including only cities with at least 500 fire incidents)
| Chicago Ridge: | 6.1 |
| Worth: | 3.8 |
| Oak Lawn: | 10.6 |
| Palos Hills: | 12.1 |
| Palos Heights: | 7.2 |
| Hickory Hills: | 21.9 |
| Burbank: | 18.2 |
| Bridgeview: | 13.5 |
| Alsip: | 15.0 |
 34.7% incidents where reported in the morning and 65.3% in the evening. The most fires (16.7%) took place on Wednesday, and the least (11.5%) on Tuesday.
 Based on the 1,144 incident reports from years 2002 - 2018 most fires (10.8%) took place during May, and the least (5.2%) in September.
 Out of all 14,927 cases reported during the years 2002 - 2018, the most belonged to the categories: Rescue & EMS (52.0%), False Alarm (13.9%), and Hazardous Condition (10.7%).
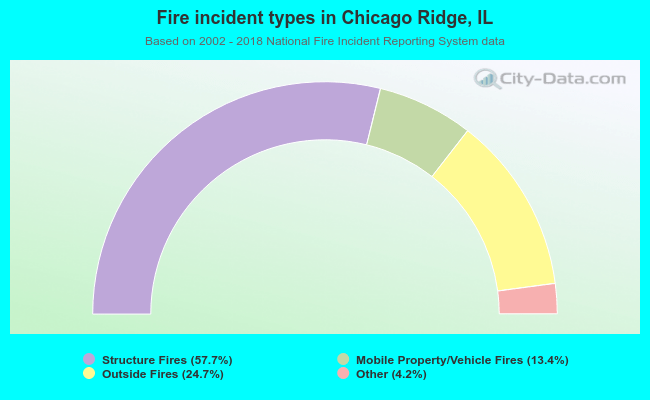 When looking into fire subcategories, the most incidents belonged to: Structure Fires (57.7%), and Outside Fires (24.7%).