Palos Hills: Fire Incidents, Illinois (IL)
Where are fire incidents reported in Palos Hills, IL
Something went wrong! Please refresh the page.
| Fire incidents reported | |
|---|---|
| Sreet name | Count |
| ROBERTS RD | 192 |
| 111TH ST | 92 |
| 95TH ST | 74 |
| 84TH TER | 68 |
| HARLEM AVE | 64 |
| SOUTHWEST HWY | 64 |
| 103RD ST | 62 |
| 107TH ST | 56 |
| 99TH ST | 50 |
| 82ND AVE | 48 |
| LAGRANGE RD | 48 |
| 84TH AVE | 46 |
| 294 NB | 42 |
| 100TH ST | 38 |
| VICKY LN | 38 |
| 81ST AVE | 36 |
| WESTWOOD DR | 34 |
| 102ND TER | 32 |
| 81ST CT | 30 |
| 89TH AVE | 30 |
| 101ST TER | 28 |
| 294 SB | 28 |
| 88TH AVE | 26 |
| COUR MONTREAL | 26 |
| 90TH AVE | 24 |
| 98TH ST | 24 |
| SOUTH RD | 24 |
| 98TH PL | 22 |
| COLLEGE PKY | 22 |
| MORAINE DR | 22 |
| Other | 15 |
2002 - 2018 National Fire Incident Reporting System (NFIRS) incidents
- Incident types reported to NFIRS in Palos Hills, IL
- 9,29457.5%Rescue & EMS
- 1,75110.8%Hazardous Condition
- 1,5329.5%False Alarm
- 1,4649.1%Good Intent Call
- 1,4058.7%Fire
- 6954.3%Service Call
- Fire incident types reported to NFIRS in Palos Hills, IL
- 76654.5%Structure Fires
- 38627.5%Outside Fires
- 17712.6%Mobile Property/Vehicle Fires
- 765.4%Other
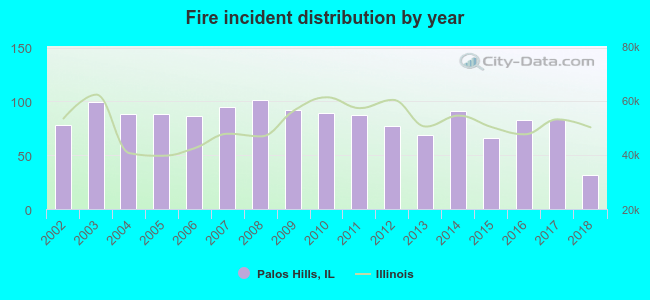 Based on the data from the years 2002 - 2018 the average number of fire incidents per year is 83. The highest number of fire incidents - 101 took place in 2008, and the least - 32 in 2018. The data has a declining trend.
The average number of yearly fire incidents per 10k residents in Palos Hills, IL compared to nearest cities:
(Note: Based on data for the last 3 years, including only cities with population 5,000 and above)
| Palos Hills: | 37.6 |
| Hickory Hills: | 40.0 |
| Worth: | 50.1 |
| Chicago Ridge: | 54.5 |
| Palos Heights: | 34.7 |
| Bridgeview: | 83.7 |
| Justice: | 60.7 |
| Willow Springs: | 46.1 |
| Oak Lawn: | 33.4 |
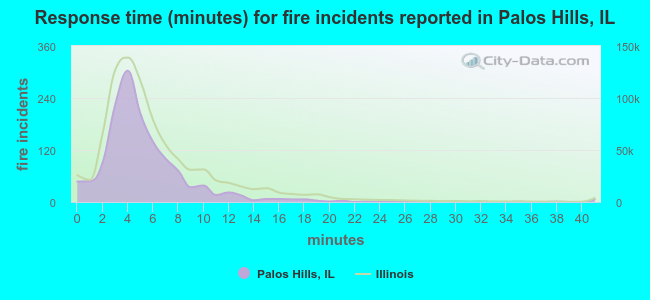 The median response time based on all reported fire incidents is 4 minutes. This is lower compared to the state median value.
The median response time in Palos Hills, IL compared to nearest cities:
(Note: Based on data for all years, including only cities with at least 500 fire incidents)
| Palos Hills: | 4 minutes |
| Hickory Hills: | 4 minutes |
| Worth: | 4 minutes |
| Palos Park: | 5 minutes |
| Chicago Ridge: | 5 minutes |
| Palos Heights: | 6 minutes |
| Bridgeview: | 5 minutes |
| Justice: | 4 minutes |
| Oak Lawn: | 5 minutes |
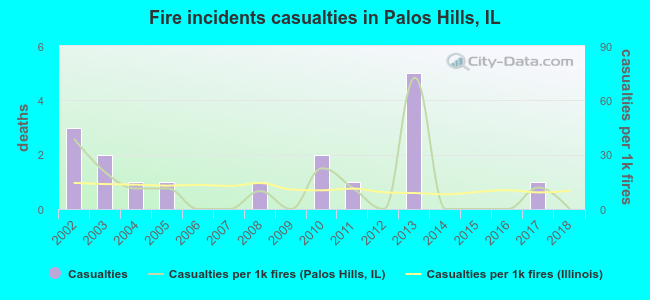 Based on the reports from the years 2002 - 2018 the average number of fire-related casualties per year is 1. The highest number of reported injuries - 5 took place in 2013, and the lowest - 0 in 2006. The data has a dropping trend.
The average number of casualties per 1,000 fires is 12. This indicator was the highest - 72 in 2013, and the lowest 0 in 2006. The trend for casualties per 1,000 fires is declining. Compared to the state value the number of injuries per 1,000 fires is similar.
Based on the reports from the years 2002 - 2018 the average number of fire-related casualties per year is 1. The highest number of reported injuries - 5 took place in 2013, and the lowest - 0 in 2006. The data has a dropping trend.
The average number of casualties per 1,000 fires is 12. This indicator was the highest - 72 in 2013, and the lowest 0 in 2006. The trend for casualties per 1,000 fires is declining. Compared to the state value the number of injuries per 1,000 fires is similar.Casualties per 1,000 incidents in Palos Hills, IL compared to nearest cities:
(Note: Based on data for all years, including only cities with at least 500 fire incidents)
| Palos Hills: | 12.1 |
| Hickory Hills: | 21.9 |
| Worth: | 3.8 |
| Palos Park: | 1.9 |
| Chicago Ridge: | 6.1 |
| Palos Heights: | 7.2 |
| Bridgeview: | 13.5 |
| Justice: | 16.7 |
| Oak Lawn: | 10.6 |
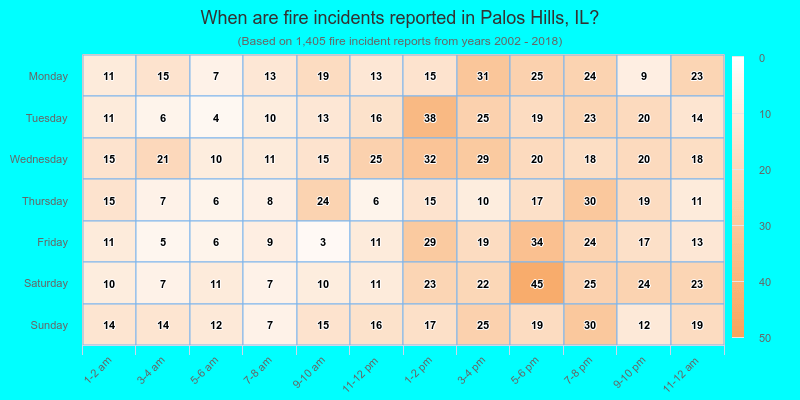
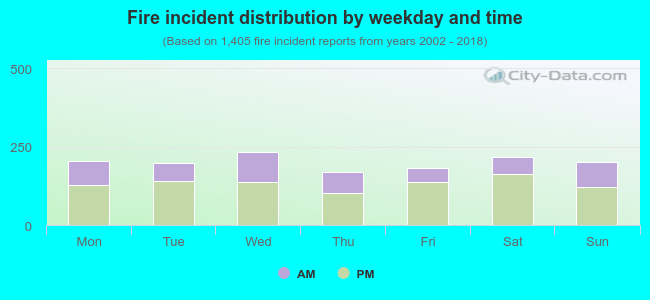 34.2% incidents where reported in the morning and 65.8% in the evening. The most fires (16.7%) took place on Wednesday, and the least (12.0%) on Thursday.
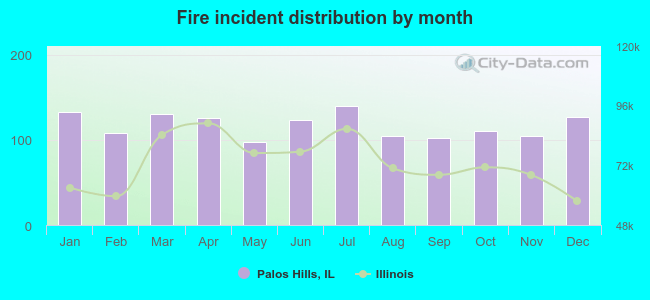 According to the 1,405 fire incidents from years 2002 - 2018 most fires (10.0%) took place during July, and the least (6.9%) in May.
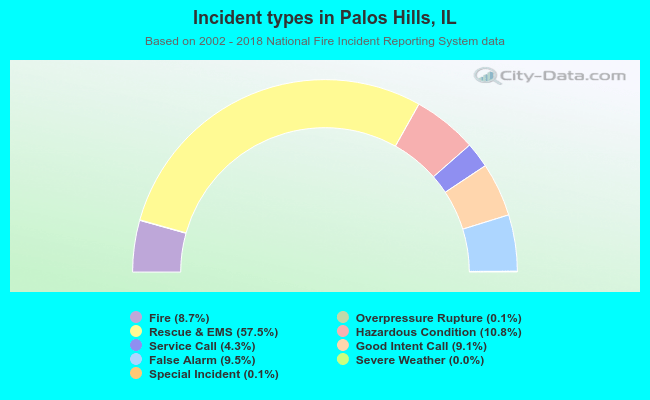 Out of all 16,166 cases reported during the years 2002 - 2018, the most belonged to the categories: Rescue & EMS (57.5%), Hazardous Condition (10.8%), and False Alarm (9.5%).
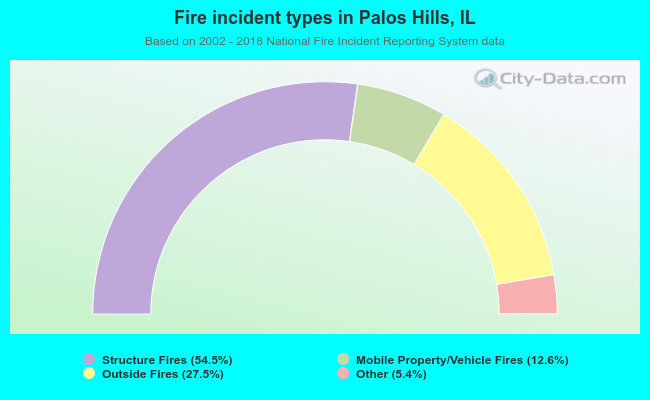 When looking into fire subcategories, the most incidents belonged to: Structure Fires (54.5%), and Outside Fires (27.5%).