Burbank: Fire Incidents, Illinois (IL)
Where are fire incidents reported in Burbank, IL
Something went wrong! Please refresh the page.
| Fire incidents reported | |
|---|---|
| Sreet name | Count |
| 79TH ST | 292 |
| CICERO AVE | 112 |
| 87TH ST | 98 |
| HARLEM AVE | 68 |
| MAJOR AVE | 68 |
| STATE ROAD ST | 64 |
| 83RD ST | 62 |
| LAVERGNE AVE | 54 |
| 84TH ST | 52 |
| LONG AVE | 50 |
| NASHVILLE AVE | 50 |
| LOCKWOOD AVE | 48 |
| NARRAGANSETT AVE | 48 |
| NATCHEZ AVE | 48 |
| 77TH ST | 46 |
| 85TH ST | 46 |
| LECLAIRE AVE | 46 |
| NEW CASTLE AVE | 44 |
| RUTHERFORD AVE | 44 |
| LATROBE AVE | 42 |
| CENTRAL AVE | 38 |
| MASON AVE | 38 |
| 82ND ST | 36 |
| LAWLER AVE | 36 |
| MAYFIELD AVE | 36 |
| LARAMIE AVE | 34 |
| LOTUS AVE | 34 |
| NAGLE AVE | 34 |
| AUSTIN AVE | 32 |
| PARKSIDE AVE | 32 |
2002 - 2018 National Fire Incident Reporting System (NFIRS) incidents
- Incident types reported to NFIRS in Burbank, IL
- 13,97462.4%Rescue & EMS
- 2,63311.8%False Alarm
- 1,7587.9%Hazardous Condition
- 1,5226.8%Good Intent Call
- 1,4866.6%Fire
- 8974.0%Service Call
- 770.3%Special Incident
- 290.1%Overpressure Rupture
- Fire incident types reported to NFIRS in Burbank, IL
- 82455.5%Structure Fires
- 37225.0%Outside Fires
- 17611.8%Mobile Property/Vehicle Fires
- 1147.7%Other
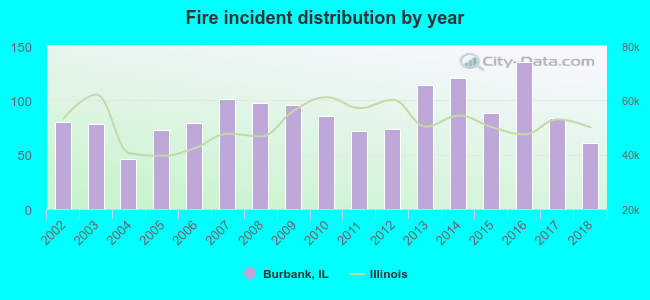 According to the data from the years 2002 - 2018 the average number of fire incidents per year is 87. The highest number of reported fire incidents - 135 took place in 2016, and the least - 46 in 2004. The data has a dropping trend.
The average number of yearly fire incidents per 10k residents in Burbank, IL compared to nearest cities:
(Note: Based on data for the last 3 years, including only cities with population 5,000 and above)
| Burbank: | 31.9 |
| Bridgeview: | 83.7 |
| Oak Lawn: | 33.4 |
| Chicago Ridge: | 54.5 |
| Hickory Hills: | 40.0 |
| Justice: | 60.7 |
| Summit: | 57.7 |
| Evergreen Park: | 38.0 |
| Worth: | 50.1 |
 The median response time based on all reported fire incidents is 4 minutes. This is lower than the state median value.
The median response time in Burbank, IL compared to nearest cities:
(Note: Based on data for all years, including only cities with at least 500 fire incidents)
| Burbank: | 4 minutes |
| Bedford Park: | 5 minutes |
| Bridgeview: | 5 minutes |
| Oak Lawn: | 5 minutes |
| Chicago Ridge: | 5 minutes |
| Hickory Hills: | 4 minutes |
| Justice: | 4 minutes |
| Summit: | 5 minutes |
| Evergreen Park: | 4 minutes |
 According to the reports from the years 2002 - 2018 the average number of fire-related yearly deaths is 0. The highest number of deaths - 2 took place in 2002, and the lowest - 0 in 2003. The data has a dropping trend.
 Based on the reports from the years 2002 - 2018 the average number of fire-related casualties per year is 2. The highest number of casualties - 6 took place in 2016, and the lowest - 0 in 2002. The data has a constant trend.
The average number of casualties per 1,000 fire incidents is 16. This indicator was the highest - 64 in 2003, and the lowest 0 in 2002. The trend for injuries per 1,000 incidents is constant. Compared to the state value the number of casualties per 1,000 fire incidents is higher.
Based on the reports from the years 2002 - 2018 the average number of fire-related casualties per year is 2. The highest number of casualties - 6 took place in 2016, and the lowest - 0 in 2002. The data has a constant trend.
The average number of casualties per 1,000 fire incidents is 16. This indicator was the highest - 64 in 2003, and the lowest 0 in 2002. The trend for injuries per 1,000 incidents is constant. Compared to the state value the number of casualties per 1,000 fire incidents is higher.Casualties per 1,000 incidents in Burbank, IL compared to nearest cities:
(Note: Based on data for all years, including only cities with at least 500 fire incidents)
| Burbank: | 18.2 |
| Bedford Park: | 4.4 |
| Bridgeview: | 13.5 |
| Oak Lawn: | 10.6 |
| Chicago Ridge: | 6.1 |
| Hickory Hills: | 21.9 |
| Justice: | 16.7 |
| Summit: | 14.3 |
| Evergreen Park: | 7.5 |
 30.5% incidents where reported in the morning and 69.5% in the evening. The most fires (17.1%) took place on Sunday, and the least (12.2%) on Wednesday.
 Based on the 1,486 fire incidents from years 2002 - 2018 most fires (14.4%) took place during July, and the least (5.2%) in December.
 Out of all 22,385 cases reported during the years 2002 - 2018, the most belonged to the categories: Rescue & EMS (62.4%), False Alarm (11.8%), and Hazardous Condition (7.9%).
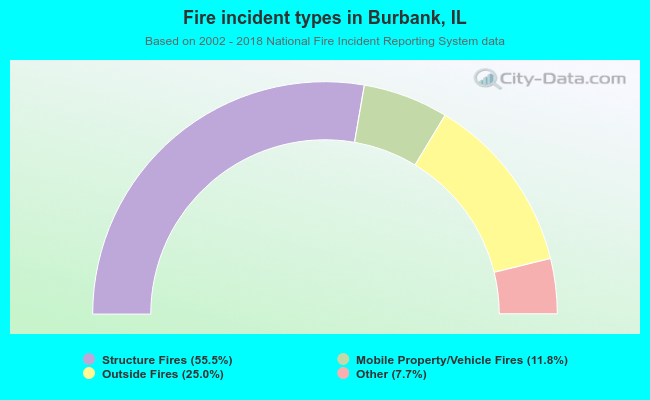 When looking into fire subcategories, the most reports belonged to: Structure Fires (55.5%), and Outside Fires (25.0%).