Summit: Fire Incidents, Illinois (IL)
Where are fire incidents reported in Summit, IL
Something went wrong! Please refresh the page.
| Fire incidents reported | |
|---|---|
| Sreet name | Count |
| 64TH ST | 126 |
| 59TH ST | 118 |
| ARCHER AVE | 116 |
| 73RD CT | 104 |
| LAWNDALE AVE | 100 |
| 58TH ST | 92 |
| 61ST ST | 84 |
| 62ND ST | 84 |
| ARCHER RD | 78 |
| HARLEM AVE | 78 |
| 63RD ST | 72 |
| 61ST PLACE | 70 |
| 75TH AVE | 66 |
| 72ND CT | 58 |
| 63RD PL | 56 |
| 73RD AVE | 56 |
| CANAL BANK RD | 54 |
| HARLEM | 52 |
| PARK AVE | 48 |
| 63RD PLACE | 46 |
| ARCHER RD | 42 |
| PARK AVE | 42 |
| 57TH ST | 40 |
| 62ND PLACE | 38 |
| 74TH AVE | 34 |
| 60TH PLACE | 30 |
| 61ST PL | 30 |
| ARCHER | 30 |
| 56TH ST | 28 |
| S/B I-55 @ 1ST AVE | 28 |
2002 - 2018 National Fire Incident Reporting System (NFIRS) incidents
- Incident types reported to NFIRS in Summit, IL
- 5,22056.5%Rescue & EMS
- 1,46515.8%Fire
- 1,02011.0%Good Intent Call
- 7728.3%Hazardous Condition
- 4194.5%False Alarm
- 3283.5%Service Call
- 140.2%Special Incident
- Fire incident types reported to NFIRS in Summit, IL
- 69747.6%Structure Fires
- 43129.4%Mobile Property/Vehicle Fires
- 28819.7%Outside Fires
- 493.3%Other
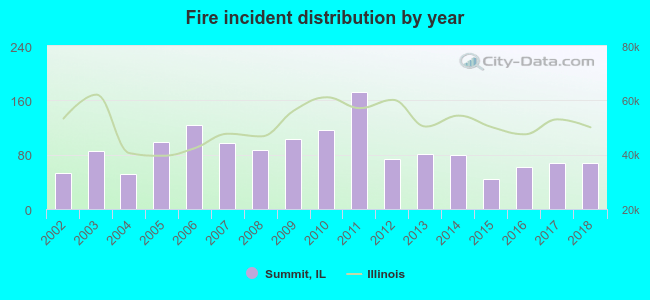 According to the data from the years 2002 - 2018 the average number of fire incidents per year is 86. The highest number of fires - 172 took place in 2011, and the least - 44 in 2015. The data has a rising trend.
The average number of yearly fire incidents per 10k residents in Summit, IL compared to nearest cities:
(Note: Based on data for the last 3 years, including only cities with population 5,000 and above)
| Summit: | 57.7 |
| Lyons: | 67.8 |
| Stickney: | 48.4 |
| Brookfield: | 36.6 |
| Riverside: | 20.6 |
| Justice: | 60.7 |
| Countryside: | 48.1 |
| Bridgeview: | 83.7 |
| La Grange: | 20.1 |
 The median response time based on all reported fire incidents is 5 minutes. This is similar to the state median value.
The median response time in Summit, IL compared to nearest cities:
(Note: Based on data for all years, including only cities with at least 500 fire incidents)
| Summit: | 5 minutes |
| Lyons: | 5 minutes |
| Bedford Park: | 5 minutes |
| Stickney: | 5 minutes |
| Brookfield: | 5 minutes |
| Riverside: | 6 minutes |
| Justice: | 4 minutes |
| Bridgeview: | 5 minutes |
| Burbank: | 4 minutes |
 Based on the reports from the years 2002 - 2018 the average number of fire-related casualties per year is 1. The highest number of reported casualties - 5 took place in 2008, and the lowest - 0 in 2002. The data has a rising trend.
The average number of casualties per 1,000 fire incidents is 14. This indicator was the highest - 58 in 2004, and the lowest 0 in 2002. The trend for casualties per 1,000 fires is growing. Compared to the state value the number of casualties per 1,000 incidents is higher.
Based on the reports from the years 2002 - 2018 the average number of fire-related casualties per year is 1. The highest number of reported casualties - 5 took place in 2008, and the lowest - 0 in 2002. The data has a rising trend.
The average number of casualties per 1,000 fire incidents is 14. This indicator was the highest - 58 in 2004, and the lowest 0 in 2002. The trend for casualties per 1,000 fires is growing. Compared to the state value the number of casualties per 1,000 incidents is higher.Casualties per 1,000 incidents in Summit, IL compared to nearest cities:
(Note: Based on data for all years, including only cities with at least 500 fire incidents)
| Summit: | 14.3 |
| Lyons: | 15.7 |
| Bedford Park: | 4.4 |
| Stickney: | 8.8 |
| Brookfield: | 19.1 |
| Riverside: | 11.7 |
| Justice: | 16.7 |
| Bridgeview: | 13.5 |
| Burbank: | 18.2 |
 45.8% incidents where reported in the morning and 54.2% in the evening. The most fires (17.1%) took place on Friday, and the least (11.5%) on Monday.
 According to the 1,465 fire incidents from years 2002 - 2018 most fires (11.8%) took place during July, and the least (5.6%) in November.
 Out of all 9,247 cases reported during the years 2002 - 2018, the most belonged to the categories: Rescue & EMS (56.5%), Fire (15.8%), and Good Intent Call (11.0%).
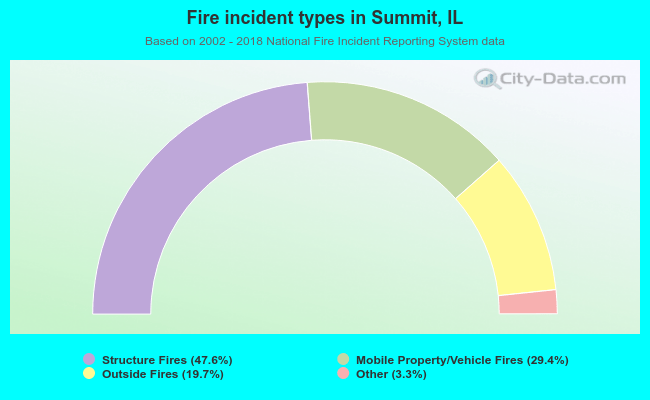 When looking into fire subcategories, the most incidents belonged to: Structure Fires (47.6%), and Mobile Property/Vehicle Fires (29.4%).