Blue Island: Fire Incidents, Illinois (IL)
Where are fire incidents reported in Blue Island, IL
Something went wrong! Please refresh the page.
| Fire incidents reported | |
|---|---|
| Sreet name | Count |
| WESTERN AVE | 278 |
| VERMONT ST | 124 |
| 127TH ST | 118 |
| CANAL ST | 84 |
| 135TH PL | 78 |
| BROADWAY ST | 78 |
| WESTERN | 72 |
| VINCENNES RD | 66 |
| ANN ST | 62 |
| DIVISION ST | 62 |
| WOOD ST | 62 |
| 139TH ST | 52 |
| MAPLE AVE | 52 |
| GREENWOOD AVE | 50 |
| VERMONT | 50 |
| YORK ST | 46 |
| 119TH ST | 44 |
| GREGORY ST | 44 |
| 120TH ST | 40 |
| VINCENNES | 38 |
| ASHLAND AVE | 36 |
| CHATHAM ST | 32 |
| MARKET ST | 32 |
| 142ND PL | 30 |
| CANAL | 30 |
| COLLINS ST | 30 |
| GROVE ST | 30 |
| IRVING AVE | 30 |
| NEW ST | 30 |
| 119TH PL | 28 |
2002 - 2018 National Fire Incident Reporting System (NFIRS) incidents
- Incident types reported to NFIRS in Blue Island, IL
- 9,64355.2%Rescue & EMS
- 1,80510.3%Fire
- 1,7269.9%Service Call
- 1,7049.7%Hazardous Condition
- 1,2967.4%Good Intent Call
- 1,2677.2%False Alarm
- 240.1%Special Incident
- 190.1%Overpressure Rupture
- Fire incident types reported to NFIRS in Blue Island, IL
- 96653.5%Structure Fires
- 39421.8%Outside Fires
- 26114.5%Mobile Property/Vehicle Fires
- 18410.2%Other
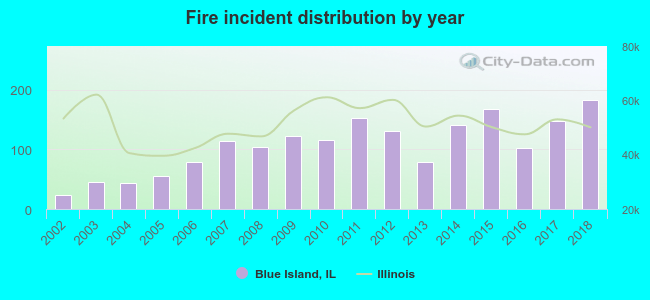 Based on the data from the years 2002 - 2018 the average number of fires per year is 106. The highest number of fires - 182 took place in 2018, and the least - 24 in 2002. The data has a rising trend.
The average number of yearly fire incidents per 10k residents in Blue Island, IL compared to nearest cities:
(Note: Based on data for the last 3 years, including only cities with population 5,000 and above)
| Blue Island: | 60.4 |
| Calumet Park: | 124.0 |
| Robbins: | 109.5 |
| Posen: | 48.7 |
| Riverdale: | 97.3 |
| Alsip: | 49.4 |
| Midlothian: | 59.0 |
| Crestwood: | 51.7 |
| Harvey: | 134.0 |
 The median response time based on all reported fire incidents is 5 minutes. This is comparable to the state median value.
The median response time in Blue Island, IL compared to nearest cities:
(Note: Based on data for all years, including only cities with at least 500 fire incidents)
| Blue Island: | 5 minutes |
| Calumet Park: | 5 minutes |
| Robbins: | 6 minutes |
| Posen: | 4 minutes |
| Riverdale: | 5 minutes |
| Alsip: | 5 minutes |
| Midlothian: | 4 minutes |
| Crestwood: | 4 minutes |
| Harvey: | 3 minutes |
 According to the reports from the years 2002 - 2018 the average number of fire-related casualties per year is 1. The highest number of reported injuries - 5 took place in 2010, and the lowest - 0 in 2002. The data has a constant trend.
The average number of injuries per 1,000 fires is 12. This indicator was the highest - 43 in 2010, and the lowest 0 in 2002. The trend for casualties per 1,000 incidents is dropping. Compared to the Illinois value the number of injuries per 1,000 fires is about the same.
According to the reports from the years 2002 - 2018 the average number of fire-related casualties per year is 1. The highest number of reported injuries - 5 took place in 2010, and the lowest - 0 in 2002. The data has a constant trend.
The average number of injuries per 1,000 fires is 12. This indicator was the highest - 43 in 2010, and the lowest 0 in 2002. The trend for casualties per 1,000 incidents is dropping. Compared to the Illinois value the number of injuries per 1,000 fires is about the same.Casualties per 1,000 incidents in Blue Island, IL compared to nearest cities:
(Note: Based on data for all years, including only cities with at least 500 fire incidents)
| Blue Island: | 13.3 |
| Calumet Park: | 1.0 |
| Robbins: | 5.1 |
| Posen: | 1.5 |
| Riverdale: | 8.6 |
| Alsip: | 15.0 |
| Midlothian: | 29.2 |
| Crestwood: | 64.6 |
| Harvey: | 10.1 |
 37.5% incidents where reported in the morning and 62.5% in the evening. The most fires (17.0%) took place on Sunday, and the least (10.0%) on Wednesday.
 According to the 1,805 reports from years 2002 - 2018 most fires (11.9%) took place during July, and the least (6.5%) in May.
 Out of all 17,485 cases reported during the years 2002 - 2018, the most belonged to the categories: Rescue & EMS (55.2%), Fire (10.3%), and Service Call (9.9%).
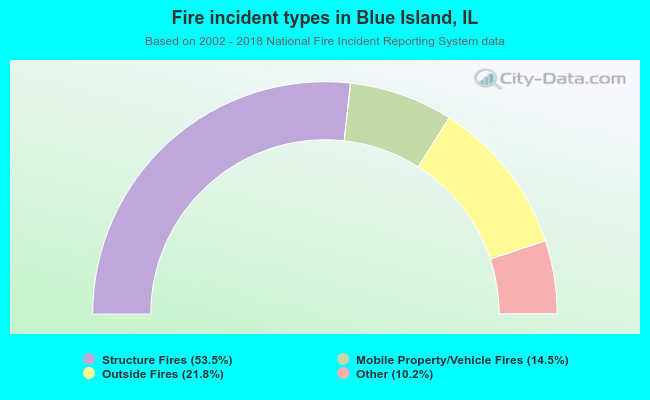 When looking into fire subcategories, the most reports belonged to: Structure Fires (53.5%), and Outside Fires (21.8%).