Americus: Fire Incidents, Georgia (GA)
Where are fire incidents reported in Americus, GA
Something went wrong! Please refresh the page.
| Fire incidents reported | |
|---|---|
| Sreet name | Count |
| HWY 19 | 144 |
| LAMAR ST | 86 |
| LEE ST | 80 |
| FORSYTH ST | 74 |
| HWY 280 | 74 |
| BRADY RD | 72 |
| MLK BLVD | 64 |
| LONNIE LN | 62 |
| JACKSON ST | 56 |
| HWY 49 | 50 |
| CHEROKEE ST | 48 |
| HWY 27 | 46 |
| TRIPP ST | 46 |
| RUCKER ST | 42 |
| RIDGE ST | 40 |
| HOOKS MILL RD | 38 |
| HOSANNA CIR | 38 |
| BOZEMAN CIR | 36 |
| FURLOW ST | 34 |
| FELDER ST | 32 |
| KNOLLWOOD DR | 32 |
| MCMATH MILL RD | 32 |
| DOUGLAS CIR | 30 |
| HWY 27 HWY | 30 |
| HWY 30 | 30 |
| HORTON DR | 28 |
| HWY 19 HWY | 28 |
| MAYO ST | 28 |
| MIDDLE RIVER RD | 28 |
| EASTVIEW CIR | 26 |
| Other | 608 |
2004 - 2018 National Fire Incident Reporting System (NFIRS) incidents
- Incident types reported to NFIRS in Americus, GA
- 8,54754.1%Rescue & EMS
- 2,06213.0%Fire
- 1,66210.5%Hazardous Condition
- 1,5619.9%Good Intent Call
- 9946.3%False Alarm
- 9395.9%Service Call
- 160.1%Overpressure Rupture
- Fire incident types reported to NFIRS in Americus, GA
- 97947.5%Outside Fires
- 73935.8%Structure Fires
- 33516.2%Mobile Property/Vehicle Fires
- 90.4%Other
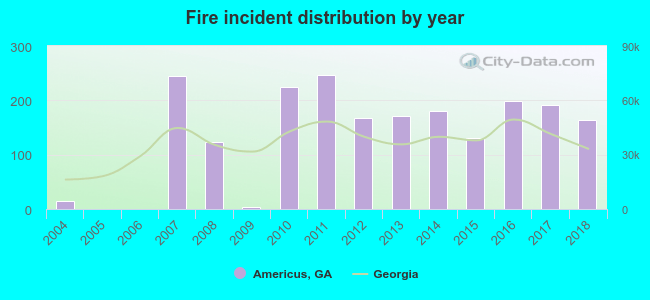 Based on the data from the years 2004 - 2018 the average number of fire incidents per year is 137. The highest number of reported fire incidents - 246 took place in 2011, and the least - 0 in 2005. The data has an increasing trend.
The average number of yearly fire incidents per 10k residents in Americus, GA compared to nearest cities:
(Note: Based on data for the last 3 years, including only cities with population 5,000 and above)
| Americus: | 113.4 |
| Cordele: | 179.8 |
| Albany: | 75.1 |
| Fort Valley: | 39.1 |
| Perry: | 66.9 |
| Sylvester: | 249.8 |
| Hawkinsville: | 147.1 |
| Centerville: | 42.2 |
| Warner Robins: | 45.5 |
 The median response time based on all reported fire incidents is 5 minutes. This is lower than the state median value.
The median response time in Americus, GA compared to nearest cities:
(Note: Based on data for all years, including only cities with at least 500 fire incidents)
| Americus: | 5 minutes |
| Montezuma: | 4 minutes |
| Leesburg: | 6 minutes |
| Dawson: | 8 minutes |
| Cordele: | 5 minutes |
| Unadilla: | 8 minutes |
| Butler: | 10 minutes |
| Albany: | 5 minutes |
| Fort Valley: | 4 minutes |
 Based on the reports from the years 2004 - 2018 the average number of fire-related fatalities per year is 0. The highest number of reported deaths - 2 took place in 2015, and the lowest - 0 in 2004. The data has a constant trend.
 Based on the data from the years 2004 - 2018 the average number of fire-related yearly casualties is 1. The highest number of injuries - 5 took place in 2013, and the lowest - 0 in 2004. The data has an increasing trend.
The average number of injuries per 1,000 fires is 7. This indicator was the highest - 29 in 2013, and the lowest 0 in 2004. The trend for injuries per 1,000 fire incidents is rising. Compared to the state value the number of casualties per 1,000 fire incidents is similar.
Based on the data from the years 2004 - 2018 the average number of fire-related yearly casualties is 1. The highest number of injuries - 5 took place in 2013, and the lowest - 0 in 2004. The data has an increasing trend.
The average number of injuries per 1,000 fires is 7. This indicator was the highest - 29 in 2013, and the lowest 0 in 2004. The trend for injuries per 1,000 fire incidents is rising. Compared to the state value the number of casualties per 1,000 fire incidents is similar.
 25.9% incidents where reported in the morning and 74.1% in the evening. The most fires (15.7%) took place on Saturday, and the least (13.5%) on Friday.
 Based on the 2,062 fire incident reports from years 2004 - 2018 most fires (10.0%) took place during May, and the least (6.7%) in February.
 Out of all 15,803 cases reported during the years 2004 - 2018, the most belonged to the categories: Rescue & EMS (54.1%), Fire (13.0%), and Hazardous Condition (10.5%).
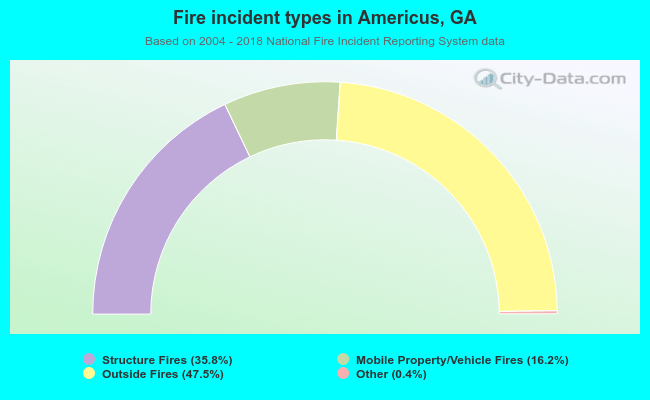 When looking into fire subcategories, the most incidents belonged to: Outside Fires (47.5%), and Structure Fires (35.8%).