Warner Robins: Fire Incidents, Georgia (GA)
Where are fire incidents reported in Warner Robins, GA
Something went wrong! Please refresh the page.
| Fire incidents reported | |
|---|---|
| Sreet name | Count |
| WATSON BLVD | 664 |
| RUSSELL PKY | 268 |
| DAVIS DR | 206 |
| ELBERTA RD | 180 |
| HOUSTON LAKE RD | 168 |
| HOUSTON RD | 154 |
| 247 HWY | 138 |
| CORDER RD | 120 |
| CARL VINSON PKY | 118 |
| GREEN ST | 104 |
| IGNICO DR | 102 |
| LEISURE LAKE DR | 84 |
| 41 HWY | 82 |
| BOOTH RD | 80 |
| MOODY RD | 78 |
| 96 HWY | 76 |
| FEAGIN MILL RD | 72 |
| PLEASANT HILL RD | 68 |
| DUNBAR ROAD | 64 |
| TABOR DR | 60 |
| NORTHLAKE DR | 58 |
| LEVERETTE RD | 56 |
| KIMBERLY RD | 54 |
| JOHNS RD | 52 |
| SOUTHLAND STATION DR | 48 |
| JOHNSON RD | 46 |
| MARGIE DR | 44 |
| CAROLINA AVE | 40 |
| DUNBAR RD | 40 |
| THIRD ST | 38 |
| Other | 2,172 |
2002 - 2018 National Fire Incident Reporting System (NFIRS) incidents
- Incident types reported to NFIRS in Warner Robins, GA
- 23,59951.5%Rescue & EMS
- 5,53412.1%Fire
- 5,00810.9%Good Intent Call
- 4,94610.8%Hazardous Condition
- 4,5279.9%Service Call
- 1,9504.3%False Alarm
- 1310.3%Severe Weather
- 730.2%Special Incident
- 520.1%Overpressure Rupture
- Fire incident types reported to NFIRS in Warner Robins, GA
- 2,30041.6%Outside Fires
- 2,22240.2%Structure Fires
- 85415.4%Mobile Property/Vehicle Fires
- 1582.9%Other
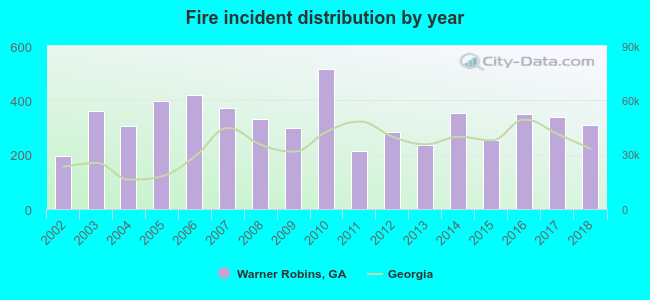 According to the data from the years 2002 - 2018 the average number of fire incidents per year is 326. The highest number of fires - 516 took place in 2010, and the least - 194 in 2002. The data has a rising trend.
The average number of yearly fire incidents per 10k residents in Warner Robins, GA compared to nearest cities:
(Note: Based on data for the last 3 years, including only cities with population 5,000 and above)
| Warner Robins: | 45.5 |
| Centerville: | 42.2 |
| Perry: | 66.9 |
| Fort Valley: | 39.1 |
| Macon: | 117.8 |
| Lizella: | 21.5 |
| Hawkinsville: | 147.1 |
| Eastman: | 244.5 |
| Milledgeville: | 136.4 |
 The median response time based on all reported fire incidents is 6 minutes. This is about the same as the state median value.
The median response time in Warner Robins, GA compared to nearest cities:
(Note: Based on data for all years, including only cities with at least 500 fire incidents)
| Warner Robins: | 6 minutes |
| Byron: | 6 minutes |
| Perry: | 7 minutes |
| Fort Valley: | 4 minutes |
| Macon: | 4 minutes |
| Cochran: | 7 minutes |
| Roberta: | 12 minutes |
| Hawkinsville: | 7 minutes |
| Unadilla: | 8 minutes |
 Based on the reports from the years 2002 - 2018 the average number of fire-related yearly deaths is 0. The highest number of reported deaths - 2 took place in 2012, and the lowest - 0 in 2003. The data has a decreasing trend.
The average number of deaths per 1,000 fire incidents is 2. This indicator was the highest - 7 in 2012, and the lowest 0 in 2003. The trend for deaths per 1,000 fires is dropping. Compared to the state value the number of deaths per 1,000 fires is lower.
Based on the reports from the years 2002 - 2018 the average number of fire-related yearly deaths is 0. The highest number of reported deaths - 2 took place in 2012, and the lowest - 0 in 2003. The data has a decreasing trend.
The average number of deaths per 1,000 fire incidents is 2. This indicator was the highest - 7 in 2012, and the lowest 0 in 2003. The trend for deaths per 1,000 fires is dropping. Compared to the state value the number of deaths per 1,000 fires is lower.Deaths per 1,000 incidents in Warner Robins, GA compared to nearest cities:
(Note: Based on data for all years, including only cities with at least 2,500 fire incidents)
| Warner Robins: | 1.4 |
| Macon: | 1.6 |
| Milledgeville: | 0.9 |
| Cordele: | 1.3 |
 Based on the data from the years 2002 - 2018 the average number of fire-related yearly casualties is 6. The highest number of reported casualties - 14 took place in 2006, and the lowest - 1 in 2004. The data has a constant trend.
The average number of casualties per 1,000 fires is 18. This indicator was the highest - 40 in 2009, and the lowest 3 in 2004. The trend for injuries per 1,000 fire incidents is dropping. Compared to the Georgia value the number of casualties per 1,000 fire incidents is much higher.
Based on the data from the years 2002 - 2018 the average number of fire-related yearly casualties is 6. The highest number of reported casualties - 14 took place in 2006, and the lowest - 1 in 2004. The data has a constant trend.
The average number of casualties per 1,000 fires is 18. This indicator was the highest - 40 in 2009, and the lowest 3 in 2004. The trend for injuries per 1,000 fire incidents is dropping. Compared to the Georgia value the number of casualties per 1,000 fire incidents is much higher.Casualties per 1,000 incidents in Warner Robins, GA compared to nearest cities:
(Note: Based on data for all years, including only cities with at least 500 fire incidents)
| Warner Robins: | 18.1 |
| Byron: | 9.1 |
| Perry: | 10.4 |
| Fort Valley: | 12.8 |
| Macon: | 2.5 |
| Cochran: | 5.6 |
| Roberta: | 0.0 |
| Hawkinsville: | 4.8 |
| Unadilla: | 0.0 |
 26.7% incidents where reported in the morning and 73.3% in the evening. The most fires (16.2%) took place on Saturday, and the least (12.9%) on Wednesday.
 Based on the 5,534 fires from years 2002 - 2018 most fires (11.1%) took place during March, and the least (6.2%) in August.
 Out of all 45,820 cases reported during the years 2002 - 2018, the most belonged to the categories: Rescue & EMS (51.5%), Fire (12.1%), and Good Intent Call (10.9%).
 When looking into fire subcategories, the most reports belonged to: Outside Fires (41.6%), and Structure Fires (40.2%).