Perry: Fire Incidents, Georgia (GA)
Where are fire incidents reported in Perry, GA
Something went wrong! Please refresh the page.
| Fire incidents reported | |
|---|---|
| Sreet name | Count |
| INTERSTATE 75 HWY | 242 |
| 41 HWY | 136 |
| SAM NUNN BLVD | 102 |
| INTERSTATE 75 | 84 |
| LAKE JOY RD | 68 |
| MACON RD | 68 |
| HOUSTON LAKE RD | 64 |
| PERRY PKY | 62 |
| 341 HWY | 52 |
| LARRY WALKER PKY | 52 |
| VALLEY DR | 50 |
| MARSHALLVILLE RD | 44 |
| KINGS CHAPEL RD | 42 |
| 127 HWY | 40 |
| ARENA RD | 40 |
| MAIN ST | 40 |
| LANGSTON RD | 36 |
| MORNINGSIDE DR | 32 |
| GAINES DR | 30 |
| TOOMER ROAD | 30 |
| KEITH DR | 28 |
| JERNIGAN ST | 26 |
| MASON TER | 26 |
| TUCKER RD | 24 |
| 96 HWY | 22 |
| HARNER ROAD | 22 |
| SMITH DR | 22 |
| WHIPPLE ST | 22 |
| COURTNEY HODGES BLVD | 20 |
| 247 SPUR | 18 |
| Other | 280 |
2003 - 2018 National Fire Incident Reporting System (NFIRS) incidents
- Incident types reported to NFIRS in Perry, GA
- 5,26644.1%Rescue & EMS
- 1,82415.3%Fire
- 1,62613.6%Service Call
- 1,29710.9%Good Intent Call
- 1,28910.8%Hazardous Condition
- 5884.9%False Alarm
- 320.3%Severe Weather
- 120.1%Special Incident
- Fire incident types reported to NFIRS in Perry, GA
- 87648.0%Outside Fires
- 56430.9%Structure Fires
- 36420.0%Mobile Property/Vehicle Fires
- 201.1%Other
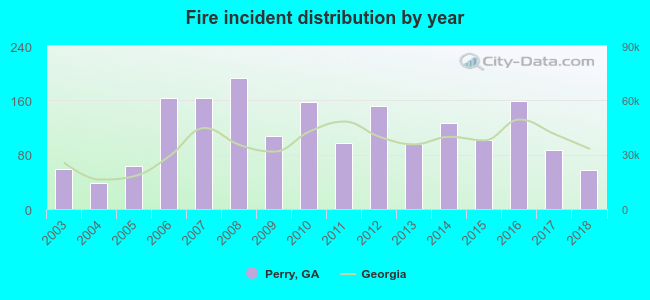 According to the data from the years 2003 - 2018 the average number of fires per year is 114. The highest number of fires - 193 took place in 2008, and the least - 38 in 2004. The data has a decreasing trend.
The average number of yearly fire incidents per 10k residents in Perry, GA compared to nearest cities:
(Note: Based on data for the last 3 years, including only cities with population 5,000 and above)
| Perry: | 66.9 |
| Warner Robins: | 45.5 |
| Fort Valley: | 39.1 |
| Centerville: | 42.2 |
| Hawkinsville: | 147.1 |
| Lizella: | 21.5 |
| Macon: | 117.8 |
| Cordele: | 179.8 |
| Eastman: | 244.5 |
 The median response time based on all reported fire incidents is 7 minutes. This is close to the state median value.
The median response time in Perry, GA compared to nearest cities:
(Note: Based on data for all years, including only cities with at least 500 fire incidents)
| Perry: | 7 minutes |
| Warner Robins: | 6 minutes |
| Fort Valley: | 4 minutes |
| Byron: | 6 minutes |
| Unadilla: | 8 minutes |
| Hawkinsville: | 7 minutes |
| Montezuma: | 4 minutes |
| Cochran: | 7 minutes |
| Roberta: | 12 minutes |
 According to the data from the years 2003 - 2018 the average number of fire-related yearly deaths is 0. The highest number of deaths - 1 took place in 2011, and the lowest - 0 in 2003. The data has a constant trend.
 According to the reports from the years 2003 - 2018 the average number of fire-related yearly casualties is 1. The highest number of casualties - 4 took place in 2008, and the lowest - 0 in 2003. The data has an increasing trend.
The average number of casualties per 1,000 fire incidents is 10. This indicator was the highest - 34 in 2018, and the lowest 0 in 2003. The trend for casualties per 1,000 fires is rising. Compared to the state value the number of casualties per 1,000 fire incidents is similar.
According to the reports from the years 2003 - 2018 the average number of fire-related yearly casualties is 1. The highest number of casualties - 4 took place in 2008, and the lowest - 0 in 2003. The data has an increasing trend.
The average number of casualties per 1,000 fire incidents is 10. This indicator was the highest - 34 in 2018, and the lowest 0 in 2003. The trend for casualties per 1,000 fires is rising. Compared to the state value the number of casualties per 1,000 fire incidents is similar.Casualties per 1,000 incidents in Perry, GA compared to nearest cities:
(Note: Based on data for all years, including only cities with at least 500 fire incidents)
| Perry: | 10.4 |
| Warner Robins: | 18.1 |
| Fort Valley: | 12.8 |
| Byron: | 9.1 |
| Unadilla: | 0.0 |
| Hawkinsville: | 4.8 |
| Montezuma: | 17.0 |
| Cochran: | 5.6 |
| Roberta: | 0.0 |
 26.9% incidents where reported in the morning and 73.1% in the evening. The most fires (16.1%) took place on Saturday, and the least (12.4%) on Wednesday.
 Based on the 1,824 reports from years 2003 - 2018 most fires (11.0%) took place during May, and the least (6.1%) in September.
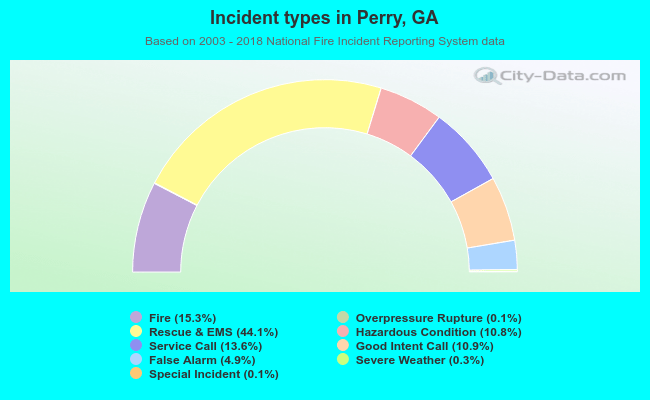 Out of all 11,944 cases reported during the years 2003 - 2018, the most belonged to the categories: Rescue & EMS (44.1%), Fire (15.3%), and Service Call (13.6%).
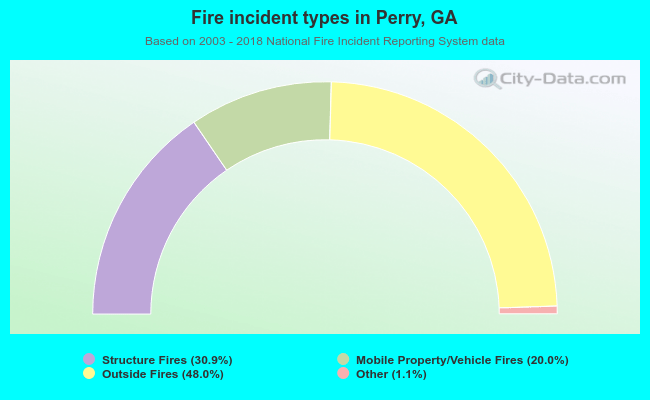 When looking into fire subcategories, the most incidents belonged to: Outside Fires (48.0%), and Structure Fires (30.9%).