Albany: Fire Incidents, Georgia (GA)
Where are fire incidents reported in Albany, GA
Something went wrong! Please refresh the page.
| Fire incidents reported | |
|---|---|
| Sreet name | Count |
| LIBERTY EXPY | 432 |
| SLAPPEY BLVD | 406 |
| GORDON AVE | 350 |
| OGLETHORPE BLVD | 346 |
| BROAD AVE | 344 |
| SYLVESTER RD | 292 |
| DAWSON RD | 284 |
| WESTOVER BLVD | 250 |
| GILLIONVILLE RD | 224 |
| MOULTRIE RD | 224 |
| CORDELE RD | 212 |
| JACKSON ST | 210 |
| MOCK RD | 200 |
| SOCIETY AVE | 196 |
| MADISON ST | 186 |
| NEWTON RD | 184 |
| CLARK AVE | 178 |
| TIFT AVE | 162 |
| OAKRIDGE DR | 158 |
| HIGHLAND AVE | 152 |
| WHITNEY AVE | 152 |
| 1ST AVE | 150 |
| RADIUM SPRINGS RD | 140 |
| LINCOLN AVE | 134 |
| RESIDENCE AVE | 130 |
| PINE AVE | 128 |
| ROOSEVELT AVE | 124 |
| NOTTINGHAM WAY | 122 |
| CORN AVE | 118 |
| JEFFERSON ST | 116 |
| Other | 3,376 |
2005 - 2018 National Fire Incident Reporting System (NFIRS) incidents
- Incident types reported to NFIRS in Albany, GA
- 9,68035.9%Fire
- 6,86425.5%Hazardous Condition
- 3,13711.6%Service Call
- 2,5529.5%False Alarm
- 2,5389.4%Rescue & EMS
- 1,9777.3%Good Intent Call
- 1820.7%Severe Weather
- Fire incident types reported to NFIRS in Albany, GA
- 4,04041.7%Outside Fires
- 3,95740.9%Structure Fires
- 1,65117.1%Mobile Property/Vehicle Fires
- 320.3%Other
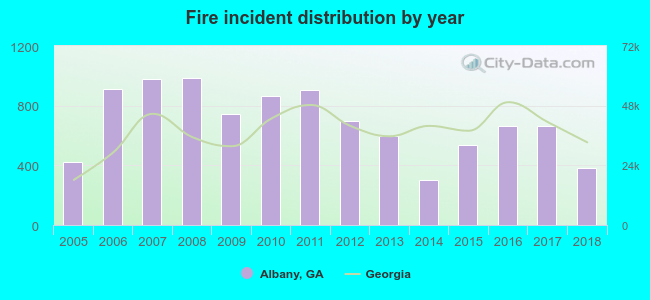 Based on the data from the years 2005 - 2018 the average number of fires per year is 690. The highest number of fire incidents - 988 took place in 2008, and the least - 303 in 2014. The data has a declining trend.
 The median response time based on all reported fire incidents is 5 minutes. This is lower compared to the state median value.
The median response time in Albany, GA compared to nearest cities:
(Note: Based on data for all years, including only cities with at least 500 fire incidents)
| Albany: | 5 minutes |
| Leesburg: | 6 minutes |
| Baconton: | 8 minutes |
| Sylvester: | 8 minutes |
| Dawson: | 8 minutes |
| Camilla: | 6 minutes |
| Ashburn: | 4 minutes |
| Pelham: | 9 minutes |
| Americus: | 5 minutes |
 According to the data from the years 2005 - 2018 the average number of fire-related fatalities per year is 2. The highest number of reported deaths - 5 took place in 2012, and the lowest - 1 in 2005. The data has an increasing trend.
The average number of fatalities per 1,000 fires is 4. This indicator was the highest - 10 in 2014, and the lowest 1 in 2007. The trend for deaths per 1,000 incidents is increasing. Compared to the Georgia value the number of deaths per 1,000 fire incidents is higher.
According to the data from the years 2005 - 2018 the average number of fire-related fatalities per year is 2. The highest number of reported deaths - 5 took place in 2012, and the lowest - 1 in 2005. The data has an increasing trend.
The average number of fatalities per 1,000 fires is 4. This indicator was the highest - 10 in 2014, and the lowest 1 in 2007. The trend for deaths per 1,000 incidents is increasing. Compared to the Georgia value the number of deaths per 1,000 fire incidents is higher.
 Based on the data from the years 2005 - 2018 the average number of fire-related casualties per year is 16. The highest number of reported casualties - 25 took place in 2015, and the lowest - 1 in 2005. The data has a growing trend.
The average number of injuries per 1,000 fire incidents is 25. This indicator was the highest - 53 in 2014, and the lowest 2 in 2005. The trend for injuries per 1,000 fire incidents is rising. Compared to the Georgia value the number of injuries per 1,000 incidents is much higher.
Based on the data from the years 2005 - 2018 the average number of fire-related casualties per year is 16. The highest number of reported casualties - 25 took place in 2015, and the lowest - 1 in 2005. The data has a growing trend.
The average number of injuries per 1,000 fire incidents is 25. This indicator was the highest - 53 in 2014, and the lowest 2 in 2005. The trend for injuries per 1,000 fire incidents is rising. Compared to the Georgia value the number of injuries per 1,000 incidents is much higher.
 28.8% incidents where reported in the morning and 71.2% in the evening. The most fires (15.4%) took place on Saturday, and the least (13.2%) on Wednesday.
 According to the 9,680 fire incidents from years 2005 - 2018 most fires (11.1%) took place during March, and the least (5.8%) in August.
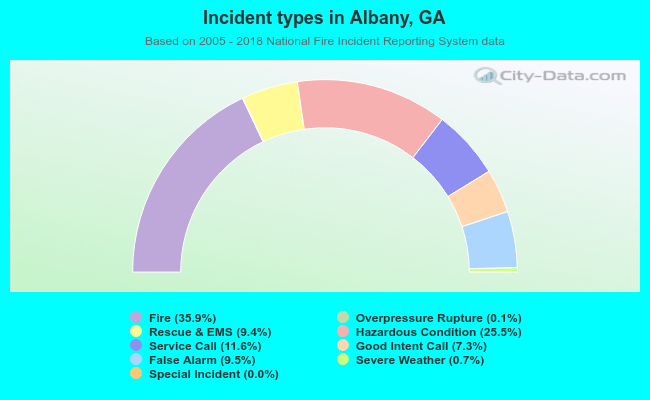 Out of all 26,958 cases reported during the years 2005 - 2018, the most belonged to the categories: Fire (35.9%), Hazardous Condition (25.5%), and Service Call (11.6%).
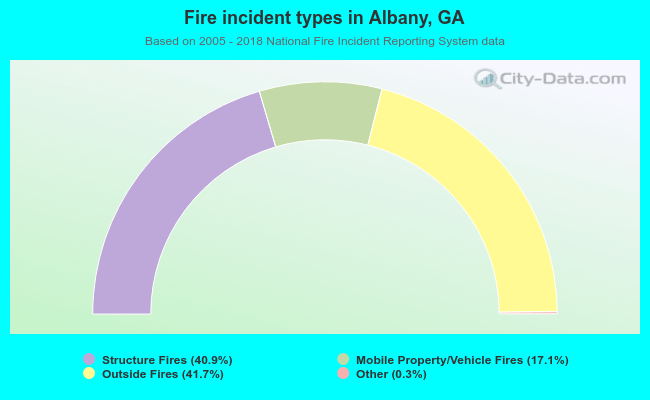 When looking into fire subcategories, the most reports belonged to: Outside Fires (41.7%), and Structure Fires (40.9%).