Moultrie: Fire Incidents, Georgia (GA)
Where are fire incidents reported in Moultrie, GA
Something went wrong! Please refresh the page.
| Fire incidents reported | |
|---|---|
| Sreet name | Count |
| 1ST AVE | 186 |
| VETERANS PARKWAY | 142 |
| 4TH AVE | 140 |
| 3RD ST | 138 |
| GA. HWY. 133 | 132 |
| GA HWY 133 | 128 |
| SARDIS CHURCH RD | 116 |
| MAIN ST | 108 |
| GA. HWY. 37 | 102 |
| 5TH ST | 100 |
| 6TH ST | 100 |
| SYLVESTER DR | 98 |
| 1ST ST | 96 |
| 5TH AVE | 96 |
| 7TH ST | 96 |
| GA HWY 37 | 96 |
| 2ND AVE | 92 |
| 7TH AVE | 88 |
| CENTRAL AVE | 84 |
| TALLOKAS RD | 84 |
| OLD ADEL RD | 82 |
| 2ND ST | 78 |
| US. HWY. 319 | 78 |
| GA HWY 33 | 76 |
| 4TH ST | 74 |
| SUMNER RD | 74 |
| GA. HWY. 33 | 72 |
| 3RD AVE | 70 |
| CIRCLE RD | 70 |
| OLD DOERUN RD | 68 |
| Other | 828 |
2002 - 2018 National Fire Incident Reporting System (NFIRS) incidents
- Incident types reported to NFIRS in Moultrie, GA
- 3,79238.2%Fire
- 1,84518.6%Hazardous Condition
- 1,62616.4%Rescue & EMS
- 1,14811.6%Good Intent Call
- 1,00110.1%False Alarm
- 4184.2%Service Call
- 840.8%Severe Weather
- 180.2%Overpressure Rupture
- Fire incident types reported to NFIRS in Moultrie, GA
- 1,95151.5%Outside Fires
- 1,17731.0%Structure Fires
- 61716.3%Mobile Property/Vehicle Fires
- 471.2%Other
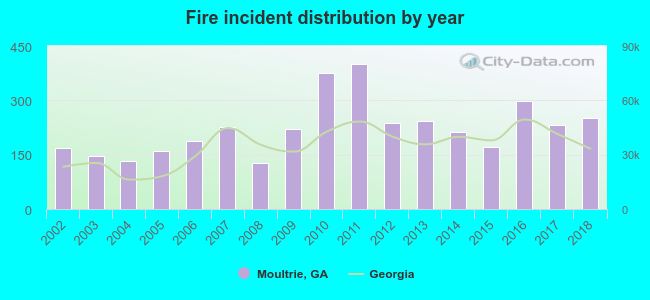 According to the data from the years 2002 - 2018 the average number of fire incidents per year is 223. The highest number of fires - 400 took place in 2011, and the least - 128 in 2008. The data has an increasing trend.
The average number of yearly fire incidents per 10k residents in Moultrie, GA compared to nearest cities:
(Note: Based on data for the last 3 years, including only cities with population 5,000 and above)
| Moultrie: | 179.5 |
| Adel: | 165.4 |
| Sylvester: | 249.8 |
| Camilla: | 135.1 |
| Thomasville: | 88.1 |
| Tifton: | 107.4 |
| Cairo: | 213.1 |
| Albany: | 75.1 |
| Valdosta: | 94.2 |
 The median response time based on all reported fire incidents is 5 minutes. This is lower than the state median value.
The median response time in Moultrie, GA compared to nearest cities:
(Note: Based on data for all years, including only cities with at least 500 fire incidents)
| Moultrie: | 5 minutes |
| Norman Park: | 8 minutes |
| Adel: | 7 minutes |
| Pelham: | 9 minutes |
| Sylvester: | 8 minutes |
| Camilla: | 6 minutes |
| Thomasville: | 6 minutes |
| Tifton: | 6 minutes |
| Baconton: | 8 minutes |
 According to the reports from the years 2002 - 2018 the average number of fire-related fatalities per year is 0. The highest number of reported deaths - 2 took place in 2009, and the lowest - 0 in 2002. The data has a constant trend.
The average number of fatalities per 1,000 fire incidents is 2. This indicator was the highest - 9 in 2009, and the lowest 0 in 2002. The trend for fatalities per 1,000 fires is declining. Compared to the state value the number of fatalities per 1,000 fire incidents is about the same.
According to the reports from the years 2002 - 2018 the average number of fire-related fatalities per year is 0. The highest number of reported deaths - 2 took place in 2009, and the lowest - 0 in 2002. The data has a constant trend.
The average number of fatalities per 1,000 fire incidents is 2. This indicator was the highest - 9 in 2009, and the lowest 0 in 2002. The trend for fatalities per 1,000 fires is declining. Compared to the state value the number of fatalities per 1,000 fire incidents is about the same.
 Based on the reports from the years 2002 - 2018 the average number of fire-related casualties per year is 4. The highest number of injuries - 9 took place in 2009, and the lowest - 0 in 2008. The data has a decreasing trend.
The average number of casualties per 1,000 fires is 17. This indicator was the highest - 41 in 2009, and the lowest 0 in 2008. The trend for injuries per 1,000 fires is decreasing. Compared to the Georgia value the number of casualties per 1,000 fire incidents is higher.
Based on the reports from the years 2002 - 2018 the average number of fire-related casualties per year is 4. The highest number of injuries - 9 took place in 2009, and the lowest - 0 in 2008. The data has a decreasing trend.
The average number of casualties per 1,000 fires is 17. This indicator was the highest - 41 in 2009, and the lowest 0 in 2008. The trend for injuries per 1,000 fires is decreasing. Compared to the Georgia value the number of casualties per 1,000 fire incidents is higher.Casualties per 1,000 incidents in Moultrie, GA compared to nearest cities:
(Note: Based on data for all years, including only cities with at least 500 fire incidents)
| Moultrie: | 16.9 |
| Norman Park: | 25.3 |
| Adel: | 4.4 |
| Pelham: | 1.2 |
| Sylvester: | 1.2 |
| Camilla: | 5.6 |
| Thomasville: | 4.5 |
| Tifton: | 6.6 |
| Baconton: | 0.0 |
 25.3% incidents where reported in the morning and 74.7% in the evening. The most fires (17.1%) took place on Saturday, and the least (12.2%) on Wednesday.
 Based on the 3,792 incident reports from years 2002 - 2018 most fires (11.3%) took place during January, and the least (5.4%) in August.
 Out of all 9,938 cases reported during the years 2002 - 2018, the most belonged to the categories: Fire (38.2%), Hazardous Condition (18.6%), and Rescue & EMS (16.4%).
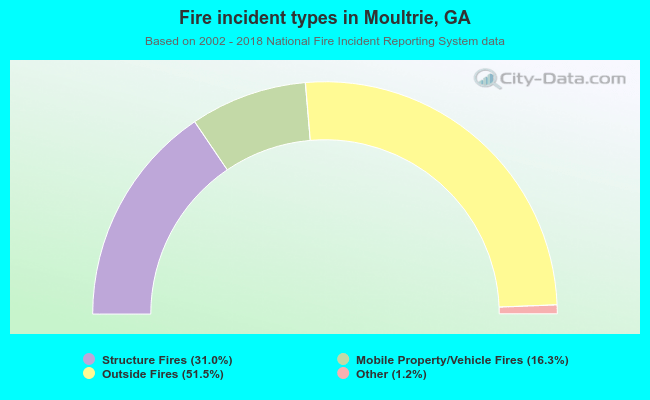 When looking into fire subcategories, the most incidents belonged to: Outside Fires (51.5%), and Structure Fires (31.0%).