Thomasville: Fire Incidents, Georgia (GA)
Where are fire incidents reported in Thomasville, GA
Something went wrong! Please refresh the page.
| Fire incidents reported | |
|---|---|
| Sreet name | Count |
| PINETREE BLVD | 178 |
| US HIGHWAY 19 | 98 |
| US HIGHWAY 84 | 78 |
| JACKSON ST | 76 |
| US HIGHWAY 319 | 72 |
| CLAY ST | 68 |
| SUMMERHILL RD | 50 |
| REMINGTON AVE | 46 |
| CASSIDY RD | 44 |
| COVINGTON AVE | 44 |
| OLD ALBANY RD | 42 |
| BROAD ST | 34 |
| COUNTY LINE RD | 34 |
| US 19 HWY | 34 |
| US 84 HWY | 32 |
| HALL RD | 30 |
| OLD BOSTON RD | 30 |
| SMITH AVE | 30 |
| US 19 | 30 |
| HIGHWAY 122 | 28 |
| OLD CASSIDY RD | 28 |
| LESTER ST | 26 |
| MARTIN LUTHER KING JR DR | 26 |
| SOUTH ST | 26 |
| GEORGIA HIGHWAY 3 | 24 |
| MAGNOLIA ST | 24 |
| YOUNG ST | 22 |
| COUNTY FARM RD | 20 |
| DILLON RD | 20 |
| FLETCHER ST | 20 |
| Other | 482 |
2003 - 2018 National Fire Incident Reporting System (NFIRS) incidents
- Incident types reported to NFIRS in Thomasville, GA
- 9,50560.7%Rescue & EMS
- 1,79611.5%Fire
- 1,3528.6%False Alarm
- 1,2968.3%Good Intent Call
- 1,0987.0%Hazardous Condition
- 5533.5%Service Call
- 300.2%Severe Weather
- 190.1%Overpressure Rupture
- Fire incident types reported to NFIRS in Thomasville, GA
- 92451.4%Outside Fires
- 59533.1%Structure Fires
- 25714.3%Mobile Property/Vehicle Fires
- 201.1%Other
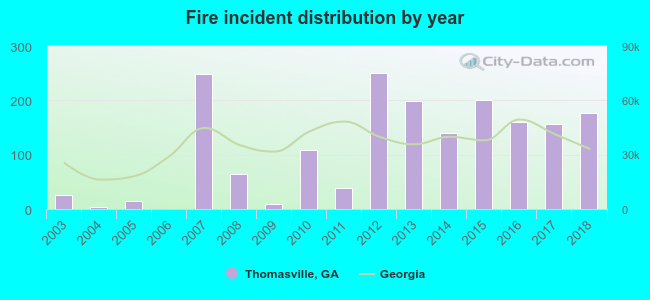 Based on the data from the years 2003 - 2018 the average number of fires per year is 112. The highest number of fires - 251 took place in 2012, and the least - 0 in 2006. The data has an increasing trend.
The average number of yearly fire incidents per 10k residents in Thomasville, GA compared to nearest cities:
(Note: Based on data for the last 3 years, including only cities with population 5,000 and above)
| Thomasville: | 88.1 |
| Cairo: | 213.1 |
| Moultrie: | 179.5 |
| Camilla: | 135.1 |
| Bainbridge: | 158.7 |
| Adel: | 165.4 |
| Valdosta: | 94.2 |
| Sylvester: | 249.8 |
 The median response time based on all reported fire incidents is 6 minutes. This is about the same as the state median value.
The median response time in Thomasville, GA compared to nearest cities:
(Note: Based on data for all years, including only cities with at least 500 fire incidents)
| Thomasville: | 6 minutes |
| Cairo: | 6 minutes |
| Monticello: | 9 minutes |
| Pelham: | 9 minutes |
| Moultrie: | 5 minutes |
| Havana: | 5 minutes |
| Camilla: | 6 minutes |
| Tallahassee: | 7 minutes |
| Norman Park: | 8 minutes |
 Based on the reports from the years 2003 - 2018 the average number of fire-related casualties per year is 1. The highest number of casualties - 2 took place in 2007, and the lowest - 0 in 2003. The data has a growing trend.
The average number of casualties per 1,000 fire incidents is 3. This indicator was the highest - 9 in 2010, and the lowest 0 in 2003. The trend for casualties per 1,000 fire incidents is increasing. Compared to the state value the number of injuries per 1,000 fire incidents is much lower.
Based on the reports from the years 2003 - 2018 the average number of fire-related casualties per year is 1. The highest number of casualties - 2 took place in 2007, and the lowest - 0 in 2003. The data has a growing trend.
The average number of casualties per 1,000 fire incidents is 3. This indicator was the highest - 9 in 2010, and the lowest 0 in 2003. The trend for casualties per 1,000 fire incidents is increasing. Compared to the state value the number of injuries per 1,000 fire incidents is much lower.Casualties per 1,000 incidents in Thomasville, GA compared to nearest cities:
(Note: Based on data for all years, including only cities with at least 500 fire incidents)
| Thomasville: | 4.5 |
| Cairo: | 4.5 |
| Monticello: | 6.3 |
| Pelham: | 1.2 |
| Moultrie: | 16.9 |
| Havana: | 1.0 |
| Camilla: | 5.6 |
| Tallahassee: | 14.1 |
| Norman Park: | 25.3 |
 27.5% incidents where reported in the morning and 72.5% in the evening. The most fires (15.3%) took place on Thursday, and the least (13.3%) on Sunday.
 Based on the 1,796 incident reports from years 2003 - 2018 most fires (13.1%) took place during March, and the least (4.6%) in September.
 Out of all 15,660 cases reported during the years 2003 - 2018, the most belonged to the categories: Rescue & EMS (60.7%), Fire (11.5%), and False Alarm (8.6%).
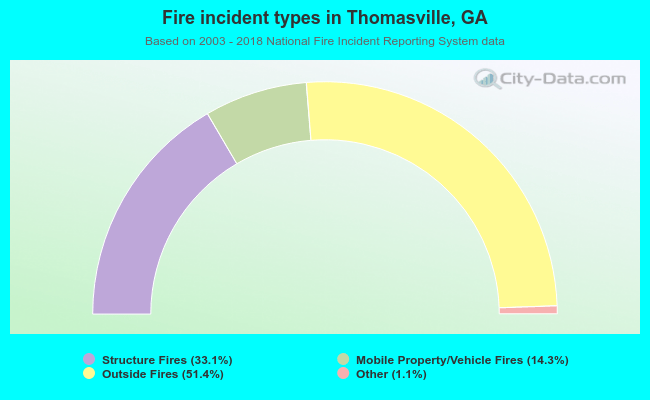 When looking into fire subcategories, the most incidents belonged to: Outside Fires (51.4%), and Structure Fires (33.1%).