Estimated zip code population in 2022: 9,676 Zip code population in 2010: 8,103 Zip code population in 2000: 7,306
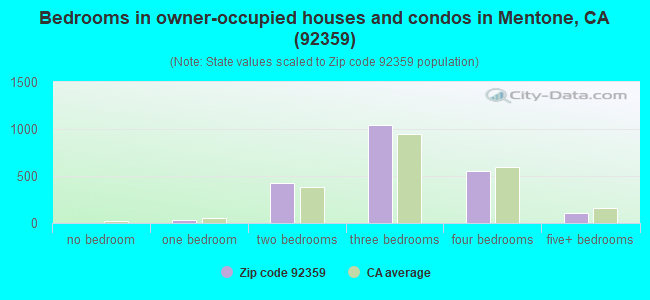
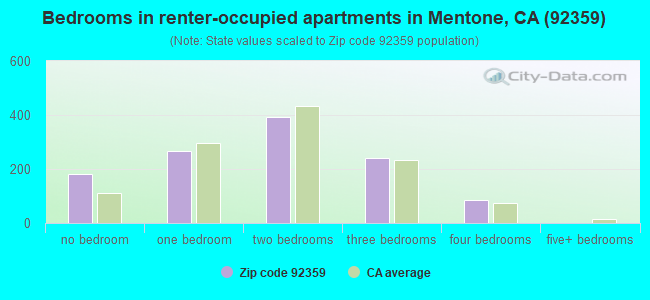
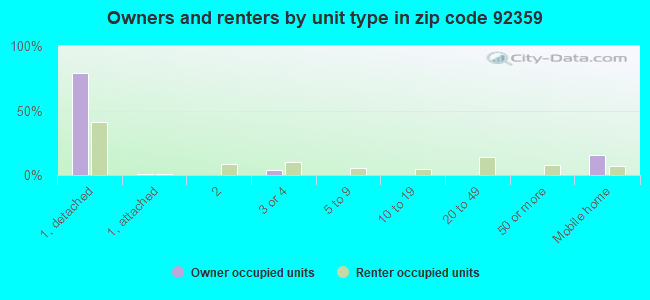
Houses and condos: 3,394 Renter-occupied apartments: 1,158
% of renters here:
35%
State:
44%
March 2022 cost of living index in zip code 92359: 81.6 (low, U.S. average is 100)
Land area: 16.7 sq. mi. Water area: 0.5 sq. mi.
Population density: 581 people per square mile
(low).
OSM Map
General Map
Google Map
MSN Map
OSM Map
General Map
Google Map
MSN Map
OSM Map
General Map
Google Map
MSN Map
OSM Map
General Map
Google Map
MSN Map
Please wait while loading the map...
Real estate property taxes paid for housing units in 2022:
This zip code:
0.8% ($3,185)
California:
0.7% ($4,831)
Median real estate property taxes paid for housing units with mortgages in 2022: $3,504 (0.8%) Median real estate property taxes paid for housing units with no mortgage in 2022: $1,815 (0.8%)
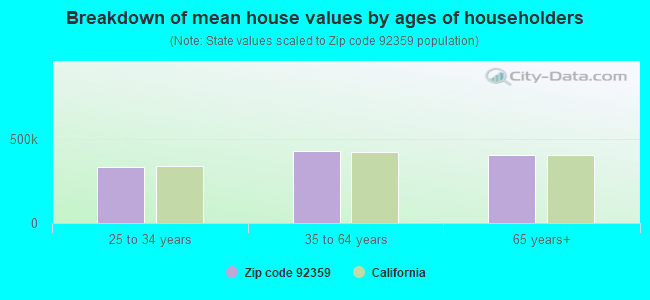
Estimated median house/condo value in 2022: $412,405
92359:
$412,405
California:
$715,900
According to our research of California and other state lists, there were 10 registered sex offenders living in 92359 zip code as of May 04, 2024. The ratio of all residents to sex offenders in zip code 92359 is 883 to 1. The ratio of registered sex offenders to all residents in this zip code is near the state average.
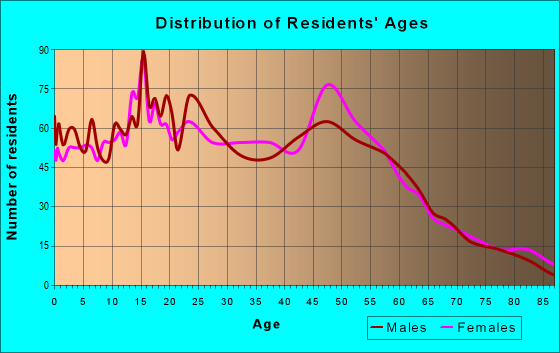
Median resident age:
This zip code:
37.4 years
California median age:
37.9 years
Average household size:
This zip code:
2.9 people
California:
2.8 people
Averages for the 2020 tax year for zip code 92359, filed in 2021:
Average Adjusted Gross Income (AGI) in 2020: $59,109 (Individual Income Tax Returns)
Here:
$59,109
State:
$95,910
Salary/wage: $55,259 (reported on 83.8% of returns)
Here:
$55,259
State:
$77,331
(% of AGI for various income ranges: 1131.3% for AGIs below $25k, 4096.2% for AGIs $25k-50k, 7323.4% for AGIs $50k-75k, 10700.7% for AGIs $75k-100k, 20341.4% for AGIs $100k-200k, 64686.7% for AGIs over 200k)
Taxable interest for individuals: $446 (reported on 30.2% of returns)
This zip code:
$446
California:
$2,294
(% of AGI for various income ranges: 8.2% for AGIs below $25k, 10.5% for AGIs $25k-50k, 24.5% for AGIs $50k-75k, 18.6% for AGIs $75k-100k, 47.4% for AGIs $100k-200k, 280.0% for AGIs over 200k)
Ordinary dividends: $3,133 (reported on 9.1% of returns)
Here:
$3,133
State:
$10,949
(% of AGI for various income ranges: 11.4% for AGIs below $25k, 16.9% for AGIs $25k-50k, 20.2% for AGIs $50k-75k, 68.2% for AGIs $75k-100k, 152.9% for AGIs $100k-200k, 526.7% for AGIs over 200k)
Net capital gain/loss in AGI: +$9,687 (reported on 10.5% of returns)
Here:
+$9,687
State:
+$49,306
(% of AGI for various income ranges: 1.4% for AGIs below $25k, 18.6% for AGIs $25k-50k, 18.2% for AGIs $50k-75k, 56.8% for AGIs $75k-100k, 225.1% for AGIs $100k-200k, 10543.3% for AGIs over 200k)
Profit/loss from business: +$7,556 (reported on 16.4% of returns)
Here:
+$7,556
State:
+$15,671
(% of AGI for various income ranges: 159.8% for AGIs below $25k, 96.3% for AGIs $25k-50k, 161.4% for AGIs $50k-75k, 265.0% for AGIs $75k-100k, 306.9% for AGIs $100k-200k, 1506.7% for AGIs over 200k)
Taxable individual retirement arrangement distribution: $15,195 (reported on 4.4% of returns)
92359:
$15,195
California:
$23,505
(% of AGI for various income ranges: 21.0% for AGIs below $25k, 43.5% for AGIs $25k-50k, 99.1% for AGIs $50k-75k, 77.9% for AGIs $75k-100k, 477.4% for AGIs $100k-200k)
Total itemized deductions: $28,453 (reported on 11.9% of returns)
Here:
$28,453
State:
$39,517
(% of AGI for various income ranges: 199.4% for AGIs $25k-50k, 529.3% for AGIs $50k-75k, 1054.6% for AGIs $75k-100k, 1578.6% for AGIs $100k-200k, 6763.3% for AGIs over 200k)
Charity contributions: $7,441 (reported on 10.3% of returns)
Here:
$7,441
State:
$12,598
(% of AGI for various income ranges: 26.2% for AGIs $25k-50k, 65.2% for AGIs $50k-75k, 188.6% for AGIs $75k-100k, 411.7% for AGIs $100k-200k, 2660.0% for AGIs over 200k)
Taxes paid: $8,147 (reported on 11.9% of returns)
92359:
$8,147
State:
$8,807
(% of AGI for various income ranges: 46.4% for AGIs $25k-50k, 151.1% for AGIs $50k-75k, 290.0% for AGIs $75k-100k, 502.9% for AGIs $100k-200k, 1760.0% for AGIs over 200k)
Earned income credit: $2,077 (reported on 16.4% of returns)
Here:
$2,077
State:
$2,074
(% of AGI for various income ranges: 89.8% for AGIs below $25k, 72.6% for AGIs $25k-50k)
Percentage of individuals using paid preparers for their 2020 taxes: 93.2%
Here:
93%
State:
92%
(% for various income ranges: 92.3% for AGIs below $25k, 93.1% for AGIs $25k-50k, 93.8% for AGIs $50k-75k, 92.9% for AGIs $75k-100k, 95.2% for AGIs $100k-200k, 90.9% for AGIs over 200k)
Averages for the 2012 tax year for zip code 92359, filed in 2013:
Average Adjusted Gross Income (AGI) in 2012: $47,951 (Individual Income Tax Returns)
Here:
$47,951
State:
$72,726
Salary/wage: $45,545 (reported on 84.7% of returns)
Here:
$45,545
State:
$59,079
(% of AGI for various income ranges: 73.1% for AGIs below $25k, 82.4% for AGIs $25k-50k, 84.1% for AGIs $50k-75k, 83.5% for AGIs $75k-100k, 83.7% for AGIs $100k-200k, 61.0% for AGIs over 200k)
Taxable interest for individuals: $576 (reported on 30.5% of returns)
This zip code:
$576
California:
$2,146
(% of AGI for various income ranges: 0.6% for AGIs below $25k, 0.5% for AGIs $25k-50k, 0.3% for AGIs $50k-75k, 0.2% for AGIs $75k-100k, 0.3% for AGIs $100k-200k, 0.2% for AGIs over 200k)
Ordinary dividends: $2,306 (reported on 9.3% of returns)
Here:
$2,306
State:
$9,308
(% of AGI for various income ranges: 0.7% for AGIs below $25k, 0.4% for AGIs $25k-50k, 0.4% for AGIs $50k-75k, 1.0% for AGIs $75k-100k, 0.3% for AGIs $100k-200k)
Net capital gain/loss in AGI: +$5,664 (reported on 7.1% of returns)
Here:
+$5,664
State:
+$30,460
(% of AGI for various income ranges: 0.2% for AGIs $25k-50k, 3.0% for AGIs $100k-200k)
Profit/loss from business: +$8,680 (reported on 16.7% of returns)
Here:
+$8,680
State:
+$17,064
(% of AGI for various income ranges: 12.0% for AGIs below $25k, 3.7% for AGIs $25k-50k, 1.5% for AGIs $50k-75k, 1.8% for AGIs $75k-100k, 1.7% for AGIs $100k-200k)
Taxable individual retirement arrangement distribution: $12,847 (reported on 5.4% of returns)
92359:
$12,847
California:
$19,557
(% of AGI for various income ranges: 1.9% for AGIs below $25k, 1.1% for AGIs $25k-50k, 1.7% for AGIs $50k-75k, 1.9% for AGIs $75k-100k, 1.5% for AGIs $100k-200k)
Total itemized deductions: $22,465 (26% of AGI, reported on 34.2% of returns)
Here:
$22,465
State:
$34,004
Here:
26.1% of AGI
State:
22.7% of AGI
(% of AGI for various income ranges: 7.3% for AGIs below $25k, 12.3% for AGIs $25k-50k, 16.1% for AGIs $50k-75k, 19.5% for AGIs $75k-100k, 20.3% for AGIs $100k-200k, 14.4% for AGIs over 200k)
Charity contributions: $3,379 (reported on 28.2% of returns)
Here:
$3,379
State:
$4,659
(% of AGI for various income ranges: 0.5% for AGIs below $25k, 1.3% for AGIs $25k-50k, 2.2% for AGIs $50k-75k, 2.2% for AGIs $75k-100k, 2.7% for AGIs $100k-200k, 2.1% for AGIs over 200k)
Taxes paid: $6,628 (reported on 34.2% of returns)
92359:
$6,628
State:
$14,448
(% of AGI for various income ranges: 1.1% for AGIs below $25k, 2.4% for AGIs $25k-50k, 3.9% for AGIs $50k-75k, 5.7% for AGIs $75k-100k, 6.9% for AGIs $100k-200k, 7.6% for AGIs over 200k)
Earned income credit: $2,367 (reported on 23.7% of returns)
Here:
$2,367
State:
$2,286
(% of AGI for various income ranges: 8.8% for AGIs below $25k, 1.2% for AGIs $25k-50k)
Percentage of individuals using paid preparers for their 2012 taxes: 62.4%
Here:
62%
State:
64%
(% for various income ranges: 57.3% for AGIs below $25k, 61.6% for AGIs $25k-50k, 66.0% for AGIs $50k-75k, 68.8% for AGIs $75k-100k, 69.4% for AGIs $100k-200k, 100.0% for AGIs over 200k)
Averages for the 2004 tax year for zip code 92359, filed in 2005:
Average Adjusted Gross Income (AGI) in 2004: $41,074 (Individual Income Tax Returns)
Here:
$41,074
State:
$58,600
Salary/wage: $38,524 (reported on 86.7% of returns)
Here:
$38,524
State:
$49,455
(% of AGI for various income ranges: 92.7% for AGIs below $10k, 79.0% for AGIs $10k-25k, 86.9% for AGIs $25k-50k, 89.4% for AGIs $50k-75k, 85.7% for AGIs $75k-100k, 63.4% for AGIs over 100k)
Taxable interest for individuals: $911 (reported on 39.1% of returns)
This zip code:
$911
California:
$2,365
(% of AGI for various income ranges: 2.8% for AGIs below $10k, 1.2% for AGIs $10k-25k, 0.7% for AGIs $25k-50k, 0.9% for AGIs $50k-75k, 0.4% for AGIs $75k-100k, 1.0% for AGIs over 100k)
Taxable dividends: $1,360 (reported on 12.4% of returns)
Here:
$1,360
State:
$4,746
(% of AGI for various income ranges: 2.5% for AGIs below $10k, 0.8% for AGIs $10k-25k, 0.3% for AGIs $25k-50k, 0.3% for AGIs $50k-75k, 0.3% for AGIs $75k-100k, 0.4% for AGIs over 100k)
Net capital gain/loss: +$11,592 (reported on 10.4% of returns)
Here:
+$11,592
State:
+$23,418
(% of AGI for various income ranges: 2.1% for AGIs below $10k, 0.6% for AGIs $10k-25k, 0.5% for AGIs $25k-50k, 0.7% for AGIs $50k-75k, 3.8% for AGIs $75k-100k, 8.3% for AGIs over 100k)
Profit/loss from business: +$8,401 (reported on 17.0% of returns)
Here:
+$8,401
State:
+$16,826
(% of AGI for various income ranges: 11.6% for AGIs below $10k, 6.8% for AGIs $10k-25k, 3.0% for AGIs $25k-50k, 1.9% for AGIs $50k-75k, 1.4% for AGIs $75k-100k, 5.1% for AGIs over 100k)
IRA payment deduction: $2,646 (reported on 2.1% of returns)
92359:
$2,646
California:
$3,192
(% of AGI for various income ranges: 0.1% for AGIs $10k-25k, 0.2% for AGIs $25k-50k, 0.1% for AGIs $50k-75k, 0.3% for AGIs $75k-100k)
Total itemized deductions: $18,867 (27% of AGI, reported on 38.7% of returns)
Here:
$18,867
State:
$28,113
Here:
26.9% of AGI
State:
25.3% of AGI
(% of AGI for various income ranges: 13.3% for AGIs below $10k, 11.5% for AGIs $10k-25k, 15.8% for AGIs $25k-50k, 21.4% for AGIs $50k-75k, 21.7% for AGIs $75k-100k, 16.2% for AGIs over 100k)
Charity contributions deductions: $2,939 (4% of AGI, reported on 34.1% of returns)
Here:
$2,939
State:
$3,923
Here:
4.1% of AGI
State:
3.3% of AGI
(% of AGI for various income ranges: 0.6% for AGIs below $10k, 1.3% for AGIs $10k-25k, 2.0% for AGIs $25k-50k, 2.9% for AGIs $50k-75k, 2.9% for AGIs $75k-100k, 2.8% for AGIs over 100k)
Total tax: $5,179 (reported on 74.8% of returns)
92359:
$5,179
State:
$10,761
(% of AGI for various income ranges: 3.8% for AGIs below $10k, 4.0% for AGIs $10k-25k, 6.3% for AGIs $25k-50k, 7.9% for AGIs $50k-75k, 9.1% for AGIs $75k-100k, 17.6% for AGIs over 100k)
Earned income credit: $1,718 (reported on 18.6% of returns)
Here:
$1,718
State:
$1,763
Percentage of individuals using paid preparers for their 2004 taxes: 65.6%
Here:
66%
State:
66%
(% for various income ranges: 55.6% for AGIs below $10k, 65.9% for AGIs $10k-25k, 66.6% for AGIs $25k-50k, 70.2% for AGIs $50k-75k, 68.0% for AGIs $75k-100k, 77.1% for AGIs over 100k)
Household received Food Stamps/SNAP in the past 12 months: 547 Household did not receive Food Stamps/SNAP in the past 12 months: 2,797
Women who had a birth in the past 12 months: 93 (67 now married, 26 unmarried) Women who did not have a birth in the past 12 months: 1,869 (944 now married, 916 unmarried)
Housing units in zip code 92359 with a mortgage: 1,438 (80 second mortgage, 60 both second mortgage and home equity loan) Median monthly owner costs for units with a mortgage: $1,934 Median monthly owner costs for units without a mortgage: $521
Residents with income below the poverty level in 2022:
This zip code:
11.6%
Whole state:
12.2%
Residents with income below 50% of the poverty level in 2022:
This zip code:
7.4%
Whole state:
6.2%
Median number of rooms in houses and condos:
Here:
5.8
State:
6.0
Median number of rooms in apartments:
Here:
4.1
State:
3.9
Notable locations in this zip code not listed on our city pages
Notable locations in zip code 92359: San Bernardino County Fire Department Station 9 Mentone (A), Mentone Branch San Bernardino County Library (B). Display/hide their locations on the map
1,722 married couples with children.
349 single-parent households (64 men, 285 women).
74.6% of residents of 92359 zip code speak English at home.
19.2% of residents speak Spanish at home (75% very well, 15% well, 8% not well, 2% not at all).
3.0% of residents speak other Indo-European language at home (58% very well, 16% well, 16% not well, 10% not at all).
2.5% of residents speak Asian or Pacific Island language at home (59% very well, 14% well, 28% not well).
0.2% of residents speak other language at home (38% very well, 62% not well).
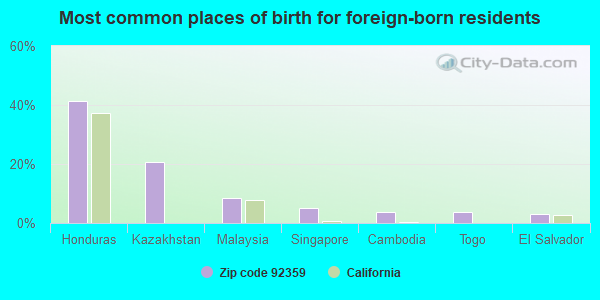
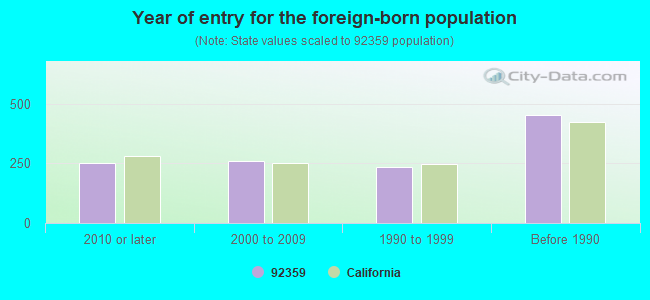
Foreign born population: 1,087 (11.2%) (63.1% of them are naturalized citizens)
This zip code:
11.2%
Whole state:
26.7%
41%Honduras
21%Kazakhstan
8%Malaysia
5%Singapore
4%Cambodia
4%Togo
3%El Salvador
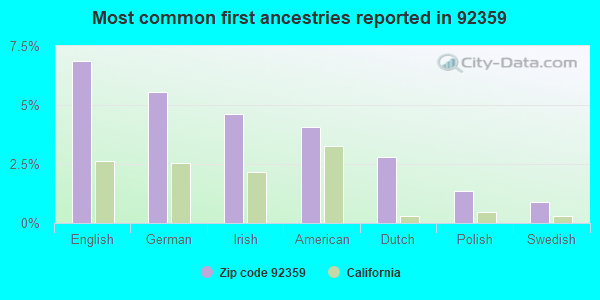
7%English
6%German
5%Irish
4%American
3%Dutch
1%Polish
1%Swedish
Year of entry for the foreign-born population
2502010 or later
2612000 to 2009
2361990 to 1999
453Before 1990
Facilities with environmental interests located in this zip code:
LARRY JACINTO CONSTRUCTION INC (988 WABASH in MENTONE, CA)
STATE MASTER (California - Hazardous Waste Tracking) - HAZARDOU WASTE PROGRAM Small Quantity Generators, between 100 kg and 1000 kg of hazardous waste/month (Resource Conservation and Recovery Act (tracking hazardous waste)) - notification
MENTONE ELEMENTARY (1320 CRAFTON AVE. in MENTONE, CA)
(National Center for Education Statistics) - STATE ID-6036560 Organizations: REDLANDS UNIFIED (SCHOOL DISTRICT)
Housing units lacking complete plumbing facilities: 2.3% Housing units lacking complete kitchen facilities: 2.4%
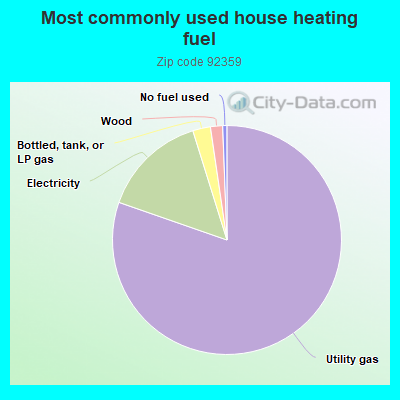
80.1%Utility gas
14.8%Electricity
2.5%Bottled, tank, or LP gas
1.7%Wood
0.6%No fuel used
Population in 1990: 5,832. Population change in the 1990s: +1,474 (+25.3%).
Place of birth for U.S.-born residents:
This state: 6,875
Northeast: 376
Midwest: 438
South: 295
West: 471
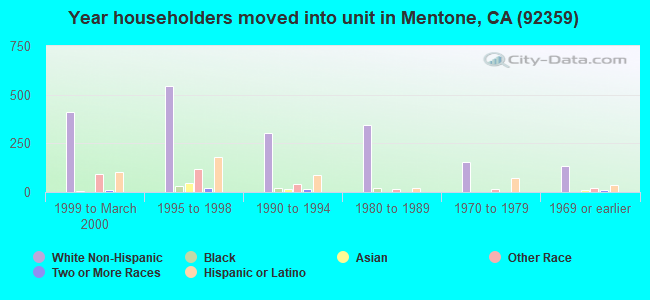
52% of the 92359 zip code residents lived in the same house 5 years ago. Out of people who lived in different houses, 76% lived in this county. Out of people who lived in different counties, 50% lived in California.
91% of the 92359 zip code residents lived in the same house 1 year ago. Out of people who lived in different houses, 37% moved from this county. Out of people who lived in different houses, 52% moved from different county within same state. Out of people who lived in different houses, 11% moved from different state.
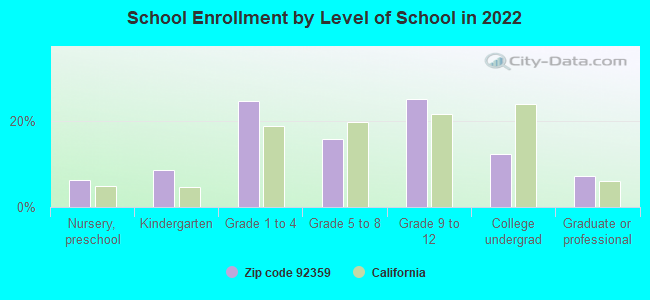
Private vs. public school enrollment:
Students in private schools in grades 1 to 8 (elementary and middle school): 43
Here:
5.2%
California:
10.5%
Students in private schools in grades 9 to 12 (high school):
Here:
0.0%
California:
8.5%
Students in private undergraduate colleges: 54
Here:
21.0%
California:
15.9%
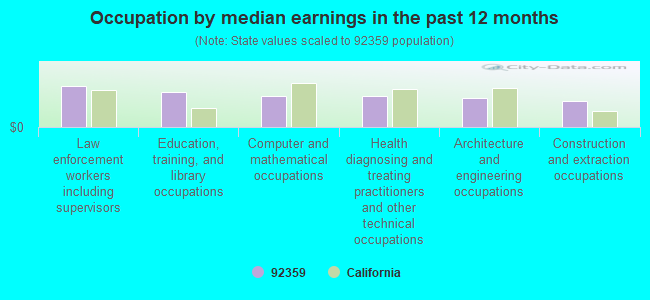
Occupation by median earnings in the past 12 months ($)
105,527Law enforcement workers including supervisors
89,235Education, training, and library occupations
80,996Computer and mathematical occupations
79,412Health diagnosing and treating practitioners and other technical occupations
74,466Architecture and engineering occupations
66,506Construction and extraction occupations
Companies with federal contracts located in this zip code:
ADVANCED MATERIAL HANDLING (9461 N OPAL AVE in MENTONE, CA; small business) : $140,280 in 3 contractsin 2005
$132,975 with Navy for Miscellaneous Prefabricated Structures. Signed on 2005-04-08. Completion date: 2005-05-19.
$6,705, same as above.Signed on 2005-05-17. Completion date: 2005-05-19.
$600, same as above.Signed on 2005-06-09. Completion date: 2005-05-19.
ASPECTS INC (9477 OPAL AVE in MENTONE, CA; small business)
$53,136 with Air Force for Office Furniture. Signed on 2003-03-28. Completion date: 2003-04-28.
CLASSROOM SOLUTIONS, LLC (31140 NICE AVE in MENTONE, CA; small business)
$10,450 with Army for Office Furniture. Signed on 2004-09-29. Completion date: 2004-10-29.
Top industries in this zip code by the number of employees in 2005:
Construction: All Other Specialty Trade Contractors (100-249 employees: 1 establishment, 1-4 employees: 1 establishment)
Construction: Site Preparation Contractors (100-249: 1)
Health Care and Social Assistance: Other Residential Care Facilities (100-249: 1)
Health Care and Social Assistance: Nursing Care Facilities (50-99: 1, 20-49: 1)
Construction: Masonry Contractors (20-49: 1)
Construction: Water and Sewer Line and Related Structures Construction (20-49: 1)
Accommodation and Food Services: Full-Service Restaurants (10-19: 2, 1-4: 1)
People in group quarters in 2010:
50 people in nursing facilities/skilled-nursing facilities
45 people in group homes intended for adults
13 people in workers' group living quarters and job corps centers
5 people in residential treatment centers for juveniles (non-correctional)
People in group quarters in 2000:
88 people in nursing homes
30 people in homes for abused, dependent, and neglected children
24 people in other group homes
8 people in other noninstitutional group quarters
Fatal accident statistics in 2013:
Fatal accident count: 1
Vehicles involved in fatal accidents: 1
Fatal accidents caused by drunken drivers: 1
Fatalities: 1
Persons involved in fatal accidents: 1
Pedestrians involved in fatal accidents: 0
Fatal accident statistics in 2012:
Fatal accident count: 2
Vehicles involved in fatal accidents: 3
Fatal accidents caused by drunken drivers: 0
Fatalities: 2
Persons involved in fatal accidents: 4
Pedestrians involved in fatal accidents: 1
Home Mortgage Disclosure Act Aggregated Statistics For Year 2009 (Based on 2 partial tracts)
A) FHA, FSA/RHS & VA Home Purchase Loans
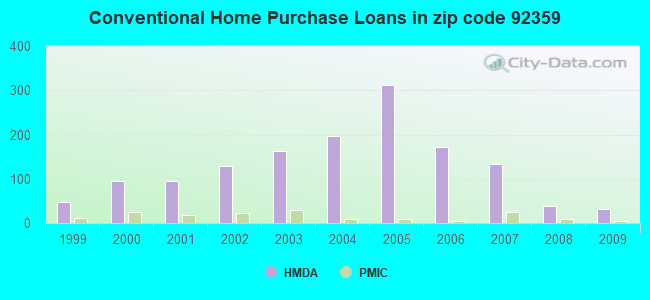
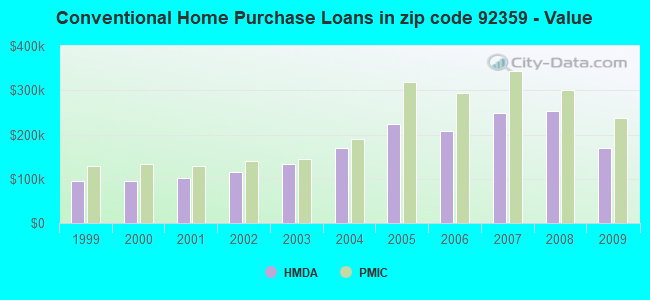
B) Conventional Home Purchase Loans
C) Refinancings
D) Home Improvement Loans
E) Loans on Dwellings For 5+ Families
F) Non-occupant Loans on < 5 Family Dwellings (A B C & D)
G) Loans On Manufactured Home Dwelling (A B C & D)
Number
Average Value
Number
Average Value
Number
Average Value
Number
Average Value
Number
Average Value
Number
Average Value
Number
Average Value
LOANS ORIGINATED
72
$244,237
32
$170,105
82
$223,207
5
$164,288
2
$2,707,690
9
$88,474
2
$139,395
APPLICATIONS APPROVED, NOT ACCEPTED
3
$153,223
5
$238,880
18
$199,948
1
$89,510
0
$0
2
$190,675
5
$57,250
APPLICATIONS DENIED
9
$267,081
7
$106,693
57
$233,624
11
$52,130
0
$0
5
$154,778
7
$38,761
APPLICATIONS WITHDRAWN
7
$218,847
8
$208,974
29
$250,044
2
$30,305
0
$0
4
$103,030
0
$0
FILES CLOSED FOR INCOMPLETENESS
0
$0
1
$186,480
7
$169,164
0
$0
0
$0
2
$98,835
0
$0
Aggregated Statistics For Year 2008 (Based on 2 partial tracts)
A) FHA, FSA/RHS & VA Home Purchase Loans
B) Conventional Home Purchase Loans
C) Refinancings
D) Home Improvement Loans
E) Loans on Dwellings For 5+ Families
F) Non-occupant Loans on < 5 Family Dwellings (A B C & D)
G) Loans On Manufactured Home Dwelling (A B C & D)
Number
Average Value
Number
Average Value
Number
Average Value
Number
Average Value
Number
Average Value
Number
Average Value
Number
Average Value
LOANS ORIGINATED
35
$271,222
39
$253,852
80
$241,084
12
$98,368
1
$1,072,260
11
$153,168
4
$129,838
APPLICATIONS APPROVED, NOT ACCEPTED
4
$211,422
7
$164,769
19
$216,562
3
$4,040
0
$0
2
$48,950
6
$64,492
APPLICATIONS DENIED
4
$285,315
9
$193,524
99
$259,951
23
$157,251
0
$0
7
$184,216
7
$72,594
APPLICATIONS WITHDRAWN
4
$217,250
7
$283,450
34
$216,125
2
$146,855
0
$0
2
$68,530
0
$0
FILES CLOSED FOR INCOMPLETENESS
2
$274,125
3
$410,877
9
$313,390
3
$65,267
0
$0
2
$302,100
0
$0
Aggregated Statistics For Year 2007 (Based on 2 partial tracts)
A) FHA, FSA/RHS & VA Home Purchase Loans
B) Conventional Home Purchase Loans
C) Refinancings
D) Home Improvement Loans
F) Non-occupant Loans on < 5 Family Dwellings (A B C & D)
G) Loans On Manufactured Home Dwelling (A B C & D)
Number
Average Value
Number
Average Value
Number
Average Value
Number
Average Value
Number
Average Value
Number
Average Value
LOANS ORIGINATED
4
$291,375
133
$248,832
221
$226,354
34
$137,529
23
$211,087
12
$63,948
APPLICATIONS APPROVED, NOT ACCEPTED
0
$0
29
$270,653
42
$219,580
7
$173,826
2
$127,740
9
$80,083
APPLICATIONS DENIED
1
$363,640
47
$275,098
140
$279,047
33
$159,553
13
$197,310
8
$53,612
APPLICATIONS WITHDRAWN
1
$279,720
59
$284,666
63
$267,022
7
$167,831
7
$246,420
0
$0
FILES CLOSED FOR INCOMPLETENESS
1
$26,110
9
$298,576
19
$236,094
2
$196,735
2
$200,465
1
$26,110
Aggregated Statistics For Year 2006 (Based on 2 partial tracts)
A) FHA, FSA/RHS & VA Home Purchase Loans
B) Conventional Home Purchase Loans
C) Refinancings
D) Home Improvement Loans
E) Loans on Dwellings For 5+ Families
F) Non-occupant Loans on < 5 Family Dwellings (A B C & D)
G) Loans On Manufactured Home Dwelling (A B C & D)
Number
Average Value
Number
Average Value
Number
Average Value
Number
Average Value
Number
Average Value
Number
Average Value
Number
Average Value
LOANS ORIGINATED
1
$287,180
171
$208,928
341
$229,507
68
$131,263
0
$0
90
$176,431
8
$65,968
APPLICATIONS APPROVED, NOT ACCEPTED
0
$0
43
$191,684
93
$235,306
5
$130,908
0
$0
23
$170,305
10
$91,935
APPLICATIONS DENIED
0
$0
77
$234,565
185
$259,258
45
$146,035
1
$195,800
35
$186,587
8
$97,669
APPLICATIONS WITHDRAWN
0
$0
30
$195,400
158
$272,048
15
$144,522
0
$0
24
$141,686
0
$0
FILES CLOSED FOR INCOMPLETENESS
0
$0
7
$186,080
24
$291,997
2
$110,955
0
$0
7
$190,609
0
$0
Aggregated Statistics For Year 2005 (Based on 2 partial tracts)
A) FHA, FSA/RHS & VA Home Purchase Loans
B) Conventional Home Purchase Loans
C) Refinancings
D) Home Improvement Loans
F) Non-occupant Loans on < 5 Family Dwellings (A B C & D)
G) Loans On Manufactured Home Dwelling (A B C & D)
Number
Average Value
Number
Average Value
Number
Average Value
Number
Average Value
Number
Average Value
Number
Average Value
LOANS ORIGINATED
7
$218,981
311
$223,677
382
$204,015
54
$155,124
76
$160,949
8
$64,801
APPLICATIONS APPROVED, NOT ACCEPTED
0
$0
65
$190,080
65
$192,505
8
$202,214
7
$148,119
12
$78,866
APPLICATIONS DENIED
0
$0
104
$181,280
173
$227,603
31
$122,505
43
$185,006
12
$73,271
APPLICATIONS WITHDRAWN
1
$157,580
71
$223,408
119
$210,895
31
$126,445
11
$138,080
3
$170,940
FILES CLOSED FOR INCOMPLETENESS
2
$296,505
12
$208,780
36
$220,953
1
$27,970
4
$174,825
0
$0
Aggregated Statistics For Year 2004 (Based on 2 partial tracts)
A) FHA, FSA/RHS & VA Home Purchase Loans
B) Conventional Home Purchase Loans
C) Refinancings
D) Home Improvement Loans
E) Loans on Dwellings For 5+ Families
F) Non-occupant Loans on < 5 Family Dwellings (A B C & D)
G) Loans On Manufactured Home Dwelling (A B C & D)
Number
Average Value
Number
Average Value
Number
Average Value
Number
Average Value
Number
Average Value
Number
Average Value
Number
Average Value
LOANS ORIGINATED
4
$162,938
196
$170,153
428
$171,037
39
$88,219
1
$1,086,250
66
$148,435
7
$54,079
APPLICATIONS APPROVED, NOT ACCEPTED
0
$0
37
$151,376
72
$160,968
8
$55,011
0
$0
9
$135,406
6
$37,297
APPLICATIONS DENIED
1
$356,180
40
$169,697
143
$159,134
33
$88,493
0
$0
12
$112,121
12
$79,098
APPLICATIONS WITHDRAWN
2
$125,875
34
$177,677
121
$164,488
23
$108,037
0
$0
10
$153,473
3
$84,537
FILES CLOSED FOR INCOMPLETENESS
0
$0
7
$180,086
40
$146,154
4
$59,908
0
$0
7
$124,409
0
$0
Aggregated Statistics For Year 2003 (Based on 2 partial tracts)
A) FHA, FSA/RHS & VA Home Purchase Loans
B) Conventional Home Purchase Loans
C) Refinancings
D) Home Improvement Loans
E) Loans on Dwellings For 5+ Families
F) Non-occupant Loans on < 5 Family Dwellings (A B C & D)
Number
Average Value
Number
Average Value
Number
Average Value
Number
Average Value
Number
Average Value
Number
Average Value
LOANS ORIGINATED
30
$141,507
162
$132,372
534
$139,245
19
$63,747
1
$1,729,600
52
$111,512
APPLICATIONS APPROVED, NOT ACCEPTED
2
$47,085
33
$114,459
86
$133,312
7
$67,399
0
$0
6
$112,355
APPLICATIONS DENIED
1
$27,040
42
$109,224
179
$140,131
21
$48,618
0
$0
13
$119,562
APPLICATIONS WITHDRAWN
6
$137,685
27
$166,658
111
$143,178
1
$151,980
0
$0
11
$81,119
FILES CLOSED FOR INCOMPLETENESS
0
$0
7
$118,414
22
$141,216
4
$16,317
0
$0
6
$104,740
Aggregated Statistics For Year 2002 (Based on 2 partial tracts)
A) FHA, FSA/RHS & VA Home Purchase Loans
B) Conventional Home Purchase Loans
C) Refinancings
D) Home Improvement Loans
E) Loans on Dwellings For 5+ Families
F) Non-occupant Loans on < 5 Family Dwellings (A B C & D)
Number
Average Value
Number
Average Value
Number
Average Value
Number
Average Value
Number
Average Value
Number
Average Value
LOANS ORIGINATED
50
$122,741
128
$116,149
316
$132,115
20
$38,974
3
$2,007,767
26
$107,872
APPLICATIONS APPROVED, NOT ACCEPTED
5
$143,776
18
$86,247
63
$125,844
7
$30,236
0
$0
5
$72,168
APPLICATIONS DENIED
5
$133,334
46
$101,915
137
$129,536
21
$20,291
0
$0
10
$145,268
APPLICATIONS WITHDRAWN
4
$108,625
16
$150,349
87
$122,316
8
$25,758
1
$4,662,000
2
$57,345
FILES CLOSED FOR INCOMPLETENESS
0
$0
4
$112,355
34
$139,202
0
$0
0
$0
3
$77,080
Aggregated Statistics For Year 2001 (Based on 2 partial tracts)
A) FHA, FSA/RHS & VA Home Purchase Loans
B) Conventional Home Purchase Loans
C) Refinancings
D) Home Improvement Loans
F) Non-occupant Loans on < 5 Family Dwellings (A B C & D)
Number
Average Value
Number
Average Value
Number
Average Value
Number
Average Value
Number
Average Value
LOANS ORIGINATED
79
$108,713
94
$101,889
199
$110,501
7
$25,441
25
$79,814
APPLICATIONS APPROVED, NOT ACCEPTED
3
$77,700
15
$76,084
37
$98,204
2
$23,310
7
$60,606
APPLICATIONS DENIED
7
$113,753
48
$94,328
129
$104,935
15
$24,056
13
$81,979
APPLICATIONS WITHDRAWN
7
$95,239
23
$111,807
65
$110,927
2
$9,790
6
$105,362
FILES CLOSED FOR INCOMPLETENESS
0
$0
6
$107,382
16
$107,576
0
$0
3
$37,607
Aggregated Statistics For Year 2000 (Based on 2 partial tracts)
A) FHA, FSA/RHS & VA Home Purchase Loans
B) Conventional Home Purchase Loans
C) Refinancings
D) Home Improvement Loans
F) Non-occupant Loans on < 5 Family Dwellings (A B C & D)
Number
Average Value
Number
Average Value
Number
Average Value
Number
Average Value
Number
Average Value
LOANS ORIGINATED
67
$107,699
95
$94,418
49
$87,056
19
$30,769
16
$67,308
APPLICATIONS APPROVED, NOT ACCEPTED
3
$88,890
14
$73,127
12
$91,686
6
$47,863
2
$82,515
APPLICATIONS DENIED
6
$61,383
93
$60,776
73
$66,660
18
$17,094
14
$61,206
APPLICATIONS WITHDRAWN
11
$107,311
15
$103,869
30
$71,515
2
$13,985
3
$132,710
FILES CLOSED FOR INCOMPLETENESS
2
$121,210
4
$74,125
7
$121,879
0
$0
5
$85,408
Aggregated Statistics For Year 1999 (Based on 1 partial tract)
A) FHA, FSA/RHS & VA Home Purchase Loans
B) Conventional Home Purchase Loans
C) Refinancings
D) Home Improvement Loans
E) Loans on Dwellings For 5+ Families
F) Non-occupant Loans on < 5 Family Dwellings (A B C & D)
Detailed PMIC statistics for the following Tracts:0086.00
2005 - 2018 National Fire Incident Reporting System (NFIRS) incidents
According to the data from the years 2005 - 2018 the average number of fire incidents per year is 24. The highest number of fires - 69 took place in 2008, and the least - 4 in 2014. The data has a dropping trend.
When looking into fire subcategories, the most incidents belonged to: Outside Fires (48.1%), and Structure Fires (34.0%).
Fire incident types reported to NFIRS in Zip Code 92359
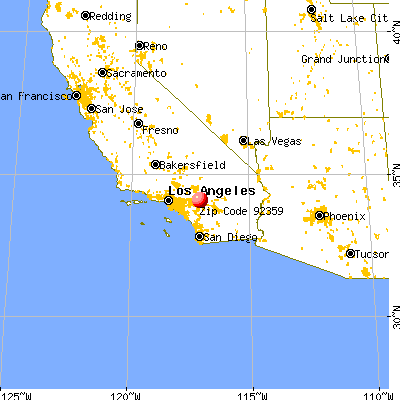


 Nearest zip codes: 92399, 92320, 92374, 92373, 92346, 92382.


 According to the data from the years 2005 - 2018 the average number of fire incidents per year is 24. The highest number of fires - 69 took place in 2008, and the least - 4 in 2014. The data has a dropping trend.
 When looking into fire subcategories, the most incidents belonged to: Outside Fires (48.1%), and Structure Fires (34.0%).