Estimated zip code population in 2022: 44,602 Zip code population in 2010: 40,267 Zip code population in 2000: 36,658
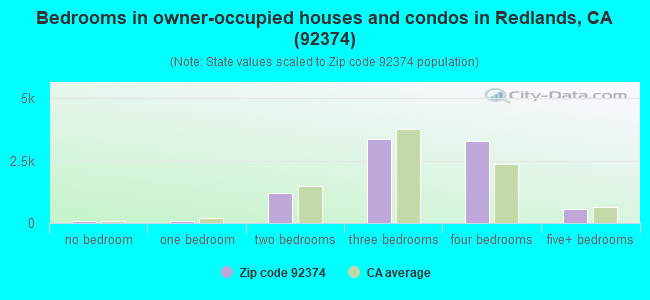
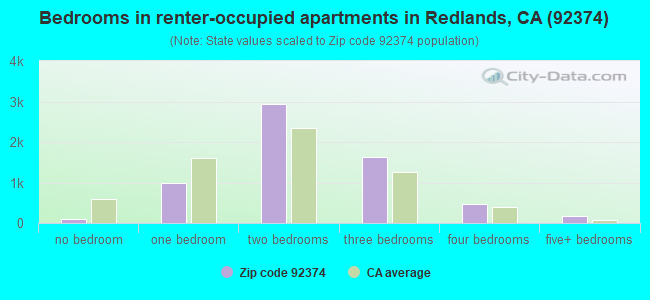
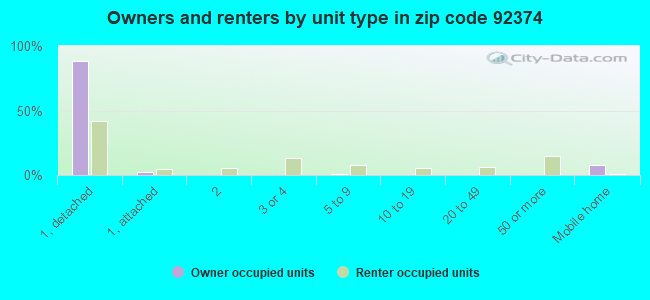
Houses and condos: 15,432 Renter-occupied apartments: 6,319
% of renters here:
43%
State:
44%
March 2022 cost of living index in zip code 92374: 82.0 (low, U.S. average is 100)
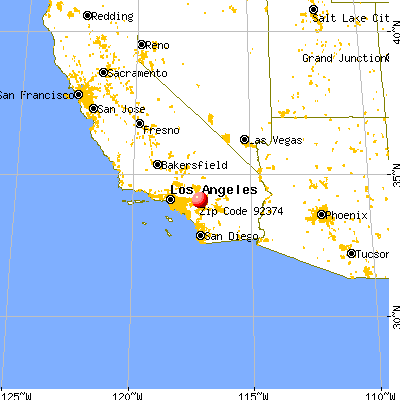
Land area: 18.7 sq. mi. Water area: 0.0 sq. mi.
Population density: 2,382 people per square mile
(low).
OSM Map
General Map
Google Map
MSN Map
OSM Map
General Map
Google Map
MSN Map
OSM Map
General Map
Google Map
MSN Map
OSM Map
General Map
Google Map
MSN Map
Please wait while loading the map...
Real estate property taxes paid for housing units in 2022:
This zip code:
0.8% ($3,976)
California:
0.7% ($4,831)
Median real estate property taxes paid for housing units with mortgages in 2022: $4,698 (0.9%) Median real estate property taxes paid for housing units with no mortgage in 2022: $2,809 (0.6%)
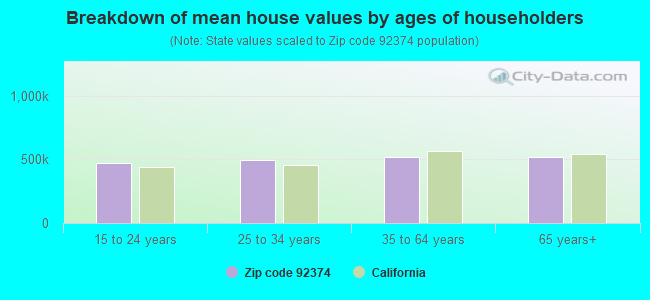
Estimated median house/condo value in 2022: $512,195
92374:
$512,195
California:
$715,900
According to our research of California and other state lists, there were 51 registered sex offenders living in 92374 zip code as of April 27, 2024. The ratio of all residents to sex offenders in zip code 92374 is 824 to 1. The ratio of registered sex offenders to all residents in this zip code is near the state average.
Median resident age:
This zip code:
33.2 years
California median age:
37.9 years
Average household size:
This zip code:
2.9 people
California:
2.8 people
Averages for the 2020 tax year for zip code 92374, filed in 2021:
Average Adjusted Gross Income (AGI) in 2020: $72,249 (Individual Income Tax Returns)
Here:
$72,249
State:
$95,910
Salary/wage: $62,299 (reported on 83.2% of returns)
Here:
$62,299
State:
$77,331
(% of AGI for various income ranges: 1152.8% for AGIs below $25k, 3692.3% for AGIs $25k-50k, 7214.8% for AGIs $50k-75k, 10656.1% for AGIs $75k-100k, 20295.1% for AGIs $100k-200k, 68623.3% for AGIs over 200k)
Taxable interest for individuals: $864 (reported on 33.0% of returns)
This zip code:
$864
California:
$2,294
(% of AGI for various income ranges: 8.5% for AGIs below $25k, 9.4% for AGIs $25k-50k, 21.3% for AGIs $50k-75k, 37.8% for AGIs $75k-100k, 87.7% for AGIs $100k-200k, 786.1% for AGIs over 200k)
Ordinary dividends: $4,011 (reported on 12.7% of returns)
Here:
$4,011
State:
$10,949
(% of AGI for various income ranges: 11.3% for AGIs below $25k, 15.1% for AGIs $25k-50k, 30.9% for AGIs $50k-75k, 64.4% for AGIs $75k-100k, 155.0% for AGIs $100k-200k, 1540.6% for AGIs over 200k)
Net capital gain/loss in AGI: +$22,257 (reported on 12.9% of returns)
Here:
+$22,257
State:
+$49,306
(% of AGI for various income ranges: 3.1% for AGIs below $25k, 21.2% for AGIs $25k-50k, 37.2% for AGIs $50k-75k, 103.5% for AGIs $75k-100k, 331.5% for AGIs $100k-200k, 14957.3% for AGIs over 200k)
Profit/loss from business: +$9,097 (reported on 15.8% of returns)
Here:
+$9,097
State:
+$15,671
(% of AGI for various income ranges: 132.7% for AGIs below $25k, 124.5% for AGIs $25k-50k, 154.6% for AGIs $50k-75k, 187.2% for AGIs $75k-100k, 298.2% for AGIs $100k-200k, 2344.2% for AGIs over 200k)
Taxable individual retirement arrangement distribution: $19,366 (reported on 5.7% of returns)
92374:
$19,366
California:
$23,505
(% of AGI for various income ranges: 34.5% for AGIs below $25k, 66.8% for AGIs $25k-50k, 139.0% for AGIs $50k-75k, 175.8% for AGIs $75k-100k, 498.7% for AGIs $100k-200k, 1407.3% for AGIs over 200k)
Self-employed (Keogh) retirement plans: $28,850 (reported on 0.4% of returns)
92374:
$28,850
California:
$30,163
(% of AGI for various income ranges: 25.6% for AGIs $75k-100k, 598.5% for AGIs over 200k)
Total itemized deductions: $33,277 (reported on 14.4% of returns)
Here:
$33,277
State:
$39,517
(% of AGI for various income ranges: 32.6% for AGIs below $25k, 135.9% for AGIs $25k-50k, 495.6% for AGIs $50k-75k, 977.2% for AGIs $75k-100k, 2133.6% for AGIs $100k-200k, 9453.0% for AGIs over 200k)
Charity contributions: $10,529 (reported on 12.5% of returns)
Here:
$10,529
State:
$12,598
(% of AGI for various income ranges: 2.6% for AGIs below $25k, 21.3% for AGIs $25k-50k, 87.1% for AGIs $50k-75k, 161.7% for AGIs $75k-100k, 483.1% for AGIs $100k-200k, 4089.7% for AGIs over 200k)
Taxes paid: $8,575 (reported on 14.4% of returns)
92374:
$8,575
State:
$8,807
(% of AGI for various income ranges: 7.4% for AGIs below $25k, 28.1% for AGIs $25k-50k, 127.2% for AGIs $50k-75k, 310.6% for AGIs $75k-100k, 654.2% for AGIs $100k-200k, 1727.0% for AGIs over 200k)
Earned income credit: $2,168 (reported on 16.2% of returns)
Here:
$2,168
State:
$2,074
(% of AGI for various income ranges: 91.3% for AGIs below $25k, 78.1% for AGIs $25k-50k, 0.9% for AGIs $50k-75k)
Percentage of individuals using paid preparers for their 2020 taxes: 93.6%
Here:
94%
State:
92%
(% for various income ranges: 92.9% for AGIs below $25k, 93.8% for AGIs $25k-50k, 94.0% for AGIs $50k-75k, 94.1% for AGIs $75k-100k, 93.6% for AGIs $100k-200k, 94.0% for AGIs over 200k)
Averages for the 2012 tax year for zip code 92374, filed in 2013:
Average Adjusted Gross Income (AGI) in 2012: $55,967 (Individual Income Tax Returns)
Here:
$55,967
State:
$72,726
Salary/wage: $50,729 (reported on 83.5% of returns)
Here:
$50,729
State:
$59,079
(% of AGI for various income ranges: 72.7% for AGIs below $25k, 81.8% for AGIs $25k-50k, 80.0% for AGIs $50k-75k, 79.0% for AGIs $75k-100k, 80.1% for AGIs $100k-200k, 58.2% for AGIs over 200k)
Taxable interest for individuals: $839 (reported on 34.9% of returns)
This zip code:
$839
California:
$2,146
(% of AGI for various income ranges: 0.6% for AGIs below $25k, 0.4% for AGIs $25k-50k, 0.4% for AGIs $50k-75k, 0.4% for AGIs $75k-100k, 0.4% for AGIs $100k-200k, 0.9% for AGIs over 200k)
Ordinary dividends: $3,892 (reported on 12.2% of returns)
Here:
$3,892
State:
$9,308
(% of AGI for various income ranges: 0.9% for AGIs below $25k, 0.6% for AGIs $25k-50k, 0.5% for AGIs $50k-75k, 0.5% for AGIs $75k-100k, 0.6% for AGIs $100k-200k, 2.0% for AGIs over 200k)
Net capital gain/loss in AGI: +$6,919 (reported on 10.4% of returns)
Here:
+$6,919
State:
+$30,460
(% of AGI for various income ranges: 0.3% for AGIs $75k-100k, 0.6% for AGIs $100k-200k, 6.2% for AGIs over 200k)
Profit/loss from business: +$12,213 (reported on 16.4% of returns)
Here:
+$12,213
State:
+$17,064
(% of AGI for various income ranges: 11.9% for AGIs below $25k, 2.4% for AGIs $25k-50k, 1.9% for AGIs $50k-75k, 2.1% for AGIs $75k-100k, 1.4% for AGIs $100k-200k, 6.6% for AGIs over 200k)
Taxable individual retirement arrangement distribution: $14,149 (reported on 6.9% of returns)
92374:
$14,149
California:
$19,557
(% of AGI for various income ranges: 1.9% for AGIs below $25k, 1.7% for AGIs $25k-50k, 1.6% for AGIs $50k-75k, 1.7% for AGIs $75k-100k, 2.0% for AGIs $100k-200k, 1.5% for AGIs over 200k)
Self-employment retirement plans: $44,400 (reported on 0.4% of returns)
92374:
$44,400
California:
$24,530
Total itemized deductions: $26,417 (25% of AGI, reported on 36.6% of returns)
Here:
$26,417
State:
$34,004
Here:
25.3% of AGI
State:
22.7% of AGI
(% of AGI for various income ranges: 7.6% for AGIs below $25k, 12.2% for AGIs $25k-50k, 16.4% for AGIs $50k-75k, 19.4% for AGIs $75k-100k, 19.9% for AGIs $100k-200k, 20.8% for AGIs over 200k)
Charity contributions: $4,556 (reported on 31.7% of returns)
Here:
$4,556
State:
$4,659
(% of AGI for various income ranges: 0.6% for AGIs below $25k, 1.5% for AGIs $25k-50k, 2.4% for AGIs $50k-75k, 2.7% for AGIs $75k-100k, 3.0% for AGIs $100k-200k, 3.8% for AGIs over 200k)
Taxes paid: $8,718 (reported on 36.4% of returns)
92374:
$8,718
State:
$14,448
(% of AGI for various income ranges: 1.2% for AGIs below $25k, 2.4% for AGIs $25k-50k, 4.2% for AGIs $50k-75k, 5.6% for AGIs $75k-100k, 7.1% for AGIs $100k-200k, 9.7% for AGIs over 200k)
Earned income credit: $2,471 (reported on 22.0% of returns)
Here:
$2,471
State:
$2,286
(% of AGI for various income ranges: 8.7% for AGIs below $25k, 1.4% for AGIs $25k-50k)
Percentage of individuals using paid preparers for their 2012 taxes: 61.3%
Here:
61%
State:
64%
(% for various income ranges: 56.4% for AGIs below $25k, 61.6% for AGIs $25k-50k, 64.4% for AGIs $50k-75k, 66.0% for AGIs $75k-100k, 65.5% for AGIs $100k-200k, 79.1% for AGIs over 200k)
Averages for the 2004 tax year for zip code 92374, filed in 2005:
Average Adjusted Gross Income (AGI) in 2004: $48,216 (Individual Income Tax Returns)
Here:
$48,216
State:
$58,600
Salary/wage: $44,109 (reported on 86.1% of returns)
Here:
$44,109
State:
$49,455
(% of AGI for various income ranges: 109.0% for AGIs below $10k, 78.0% for AGIs $10k-25k, 84.8% for AGIs $25k-50k, 84.6% for AGIs $50k-75k, 87.2% for AGIs $75k-100k, 68.4% for AGIs over 100k)
Taxable interest for individuals: $1,102 (reported on 42.2% of returns)
This zip code:
$1,102
California:
$2,365
(% of AGI for various income ranges: 3.0% for AGIs below $10k, 1.4% for AGIs $10k-25k, 0.8% for AGIs $25k-50k, 0.8% for AGIs $50k-75k, 0.5% for AGIs $75k-100k, 1.2% for AGIs over 100k)
Taxable dividends: $2,545 (reported on 16.6% of returns)
Here:
$2,545
State:
$4,746
(% of AGI for various income ranges: 2.6% for AGIs below $10k, 1.0% for AGIs $10k-25k, 0.6% for AGIs $25k-50k, 0.5% for AGIs $50k-75k, 0.3% for AGIs $75k-100k, 1.3% for AGIs over 100k)
Net capital gain/loss: +$8,435 (reported on 13.4% of returns)
Here:
+$8,435
State:
+$23,418
(% of AGI for various income ranges: -2.0% for AGIs below $10k, 0.1% for AGIs $10k-25k, 0.3% for AGIs $25k-50k, 0.4% for AGIs $50k-75k, 0.8% for AGIs $75k-100k, 5.7% for AGIs over 100k)
Profit/loss from business: +$13,753 (reported on 15.7% of returns)
Here:
+$13,753
State:
+$16,826
(% of AGI for various income ranges: 9.8% for AGIs below $10k, 6.7% for AGIs $10k-25k, 2.8% for AGIs $25k-50k, 2.5% for AGIs $50k-75k, 2.4% for AGIs $75k-100k, 6.4% for AGIs over 100k)
IRA payment deduction: $2,898 (reported on 2.3% of returns)
92374:
$2,898
California:
$3,192
(% of AGI for various income ranges: 0.2% for AGIs below $10k, 0.1% for AGIs $10k-25k, 0.2% for AGIs $25k-50k, 0.2% for AGIs $50k-75k, 0.1% for AGIs $75k-100k, 0.1% for AGIs over 100k)
Self-employed pension: $20,664 (reported on 0.8% of returns)
Here:
$20,664
California:
$17,688
(% of AGI for various income ranges: 0.1% for AGIs $10k-25k, 0.1% for AGIs $50k-75k, 0.2% for AGIs $75k-100k, 0.8% for AGIs over 100k)
Total itemized deductions: $22,331 (26% of AGI, reported on 41.4% of returns)
Here:
$22,331
State:
$28,113
Here:
26.5% of AGI
State:
25.3% of AGI
(% of AGI for various income ranges: 10.0% for AGIs below $10k, 9.9% for AGIs $10k-25k, 16.8% for AGIs $25k-50k, 22.0% for AGIs $50k-75k, 22.5% for AGIs $75k-100k, 20.0% for AGIs over 100k)
Charity contributions deductions: $3,886 (4% of AGI, reported on 37.8% of returns)
Here:
$3,886
State:
$3,923
Here:
4.5% of AGI
State:
3.3% of AGI
(% of AGI for various income ranges: 0.7% for AGIs below $10k, 1.2% for AGIs $10k-25k, 2.1% for AGIs $25k-50k, 3.0% for AGIs $50k-75k, 3.4% for AGIs $75k-100k, 3.9% for AGIs over 100k)
Total tax: $6,854 (reported on 74.0% of returns)
92374:
$6,854
State:
$10,761
(% of AGI for various income ranges: 3.4% for AGIs below $10k, 3.9% for AGIs $10k-25k, 6.0% for AGIs $25k-50k, 8.2% for AGIs $50k-75k, 9.3% for AGIs $75k-100k, 16.2% for AGIs over 100k)
Earned income credit: $1,862 (reported on 17.9% of returns)
Here:
$1,862
State:
$1,763
Percentage of individuals using paid preparers for their 2004 taxes: 65.9%
Here:
66%
State:
66%
(% for various income ranges: 56.3% for AGIs below $10k, 67.7% for AGIs $10k-25k, 67.6% for AGIs $25k-50k, 66.5% for AGIs $50k-75k, 68.3% for AGIs $75k-100k, 71.5% for AGIs over 100k)
Likely homosexual households (counted as self-reported same-sex unmarried-partner households)
Lesbian couples: 0.1% of all households
Gay men: 0.1% of all households
Household received Food Stamps/SNAP in the past 12 months: 1,312 Household did not receive Food Stamps/SNAP in the past 12 months: 13,411
Women who had a birth in the past 12 months: 340 (237 now married, 102 unmarried) Women who did not have a birth in the past 12 months: 11,711 (3,909 now married, 7,832 unmarried)
Housing units in zip code 92374 with a mortgage: 5,499 (362 second mortgage, 12 home equity loan, 271 both second mortgage and home equity loan) Houses without a mortgage: 48
Median monthly owner costs for units with a mortgage: $2,310 Median monthly owner costs for units without a mortgage: $640
Residents with income below the poverty level in 2022:
This zip code:
10.3%
Whole state:
12.2%
Residents with income below 50% of the poverty level in 2022:
This zip code:
4.7%
Whole state:
6.2%
Median number of rooms in houses and condos:
Here:
6.2
State:
6.0
Median number of rooms in apartments:
Here:
4.5
State:
3.9
Notable locations in this zip code not listed on our city pages
Notable locations in zip code 92374: Watchorn Hall (A), Truesdail Speech Center (B), Tom and Ann Peppers Art Center (C), Sara Grace Parker Hall of Letters (D), Richard C and Virginia M Hunsaker University Center (E), Orton Center (F), North Hall (G), Merriam Hall (H), Melrose Hall (I), Larsen Hall (J), John Williams Conference Center (K), Hornby Hall (L), Hentschke Hall (M), Grossmont Hall (N), Glenn Wallichs Theatre (O), Gannett Center (P), Founders Hall (Q), Fairmont Hall (R), East Hall (S), Duke Hall (T). Display/hide their locations on the map
Shopping Centers: Western Shopping Center (1), University Plaza Shopping Center (2), Tri-City Center Shopping Center (3), Redlands Oasis Shopping Center (4), Orange Street Plaza Shopping Center (5), North Redlands Shopping Center (6). Display/hide their locations on the map
Churches in zip code 92374 include: Memorial Chapel (A), Northside Baptist Church (B), Redlands Christian Center (C), Christ the King Lutheran Church (D), Christian Inland Embassy (E), Church of Christ (F), Church of the Nazarene (G), Community Missionary Baptist Church (H), Community Presbyterian Church (I). Display/hide their locations on the map
Parks in zip code 92374 include: Ford Park (1), Pepper Park (2), Sylvan Park (3), Ted Runner Stadium (4), Crafton Park (5), Lugonia Park (6). Display/hide their locations on the map
5,631 married couples with children.
2,606 single-parent households (789 men, 1,817 women).
65.7% of residents of 92374 zip code speak English at home.
25.7% of residents speak Spanish at home (74% very well, 12% well, 10% not well, 4% not at all).
2.7% of residents speak other Indo-European language at home (79% very well, 21% well, 1% not well).
4.8% of residents speak Asian or Pacific Island language at home (51% very well, 31% well, 14% not well, 4% not at all).
0.7% of residents speak other language at home (70% very well, 16% well, 14% not well).
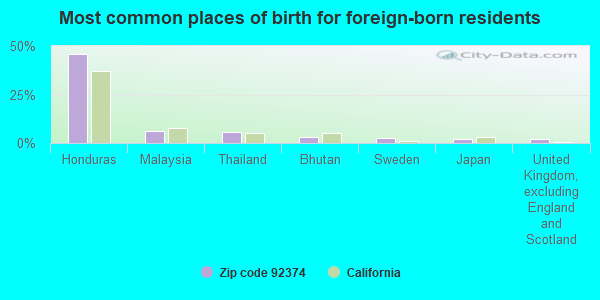
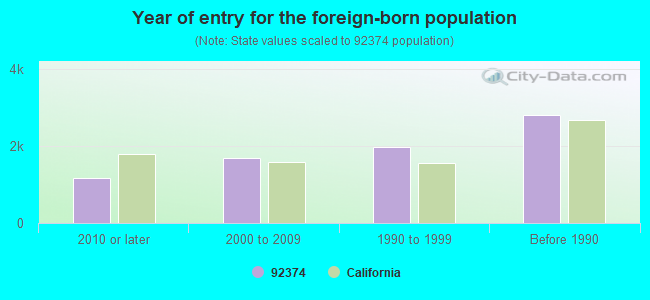
Foreign born population: 7,376 (16.5%) (55.5% of them are naturalized citizens)
Major facilities with environmental interests located in this zip code:
LORAN INC. (1705 E. COLTON AVE. in REDLANDS, CA)
STATE MASTER (California - Hazardous Waste Tracking) - HAZARDOU WASTE PROGRAM COMPLIANCE ACTIVITY (Tracking inspections of insecticide, fungicide, and rodenticide, and toxic substances) CRITERIA AND HAZARDOUS AIR POLLUTANT INVENTORY (Inventory of air pollution sources) Small Quantity Generators, between 100 kg and 1000 kg of hazardous waste/month (Resource Conservation and Recovery Act (tracking hazardous waste)) TRI REPORTER (Tracking of toxic chemicals releasing facilities) - ICIS-, ENFORCEMENT/COMPLIANCE ACTIVITY Business SIC classification: CURRENT-CARRYING WIRING DEVICES Business NAICS classification: RESIDENTIAL ELECTRIC LIGHTING FIXTURE MANUFACTURING. Alternative names: LORAN INC DBA NIGHTSCAPING
MOUNTAINVIEW POWER COMPANY (2492 W SAN BERNARDINO AVE in REDLANDS, CA)
FORMAL ENFORCEMENT ACTION (Integrated Compliance Information System) - ICIS-09-2006-0019, ENFORCEMENT/COMPLIANCE ACTIVITY Large Quantity Generators, more that 1000 kg of hazardous waste/month (Resource Conservation and Recovery Act (tracking hazardous waste)) Organizations: MOUNTAINVIEW POWER COMPANY LLC (CONTACT/OPERATOR)
A 1 CLEANERS (1558 N ORANGE ST STE 29C1 in REDLANDS, CA)
STATE MASTER (California - Hazardous Waste Tracking) - HAZARDOU WASTE PROGRAM Small Quantity Generators, between 100 kg and 1000 kg of hazardous waste/month (Resource Conservation and Recovery Act (tracking hazardous waste)) - notification Organizations: KIM (CONTACT/OWNER)
CHEVRON STATION NO 98167 (120 THE TERRACE in REDLANDS, CA)
STATE MASTER (California - Hazardous Waste Tracking) - HAZARDOU WASTE PROGRAM Small Quantity Generators, between 100 kg and 1000 kg of hazardous waste/month (Resource Conservation and Recovery Act (tracking hazardous waste)) - notification Organizations: CHEVRON PRODUCTS CO (CONTACT/OWNER)
FRANKLIN ELEMENTARY (850 E. COLTON AVE. in REDLANDS, CA)
(National Center for Education Statistics) - STATE ID-6036503 Organizations: REDLANDS UNIFIED (SCHOOL DISTRICT)
GORMAN LEARNING CENTER (1235 INDIANA COURT STE 105 in REDLANDS, CA)
(National Center for Education Statistics) - STATE ID-1996305 Organizations: GORMAN ELEMENTARY (SCHOOL DISTRICT)
LUGONIA ELEMENTARY (202 E. PENNSYLVANIA AVE. in REDLANDS, CA)
(National Center for Education Statistics) - STATE ID-6036537 Organizations: REDLANDS UNIFIED (SCHOOL DISTRICT)
MOORE MIDDLE (1550 E. HIGHLAND AVE. in REDLANDS, CA)
(National Center for Education Statistics) - STATE ID-6061881 Organizations: REDLANDS UNIFIED (SCHOOL DISTRICT)
HOME DEPOT USA INC HD 1013 (1151 W LUGONIA AVE in REDLANDS, CA)
Small Quantity Generators, between 100 kg and 1000 kg of hazardous waste/month (Resource Conservation and Recovery Act (tracking hazardous waste))
JOHN DAVIS AUTO (1633 H W REDLANDS BLVD in REDLANDS, CA)
Small Quantity Generators, between 100 kg and 1000 kg of hazardous waste/month (Resource Conservation and Recovery Act (tracking hazardous waste)) - notification
LOUIS GONZALES (1115 WASHINGTON ST in REDLANDS, CA)
Small Quantity Generators, between 100 kg and 1000 kg of hazardous waste/month (Resource Conservation and Recovery Act (tracking hazardous waste)) Organizations: HARLEY GREEN (CONTACT/OPERATOR)
CARRIAGE CLEANERS (1221 N WABUSH AVE in REDLANDS, CA)
Small Quantity Generators, between 100 kg and 1000 kg of hazardous waste/month (Resource Conservation and Recovery Act (tracking hazardous waste)) - notification Organizations: KATHERINE O HILL (CONTACT/OWNER)
H E L P RANCH, INC (1026 COLLEGE AVE in REDLANDS, CA)
COMPLIANCE ACTIVITY (Tracking inspections of insecticide, fungicide, and rodenticide, and toxic substances)
Housing units lacking complete plumbing facilities: 0.2% Housing units lacking complete kitchen facilities: 2.5%
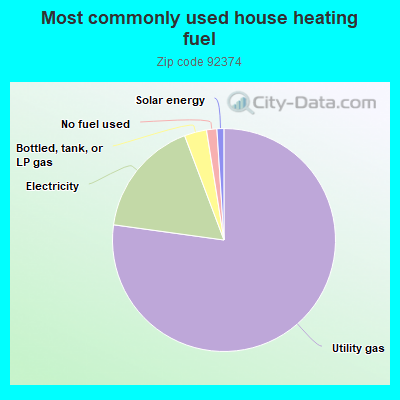
76.8%Utility gas
17.0%Electricity
3.2%Bottled, tank, or LP gas
1.5%No fuel used
1.0%Solar energy
Population in 1990: 36,952.
Place of birth for U.S.-born residents:
This state: 30,019
Northeast: 1,377
Midwest: 1,823
South: 1,386
West: 2,204
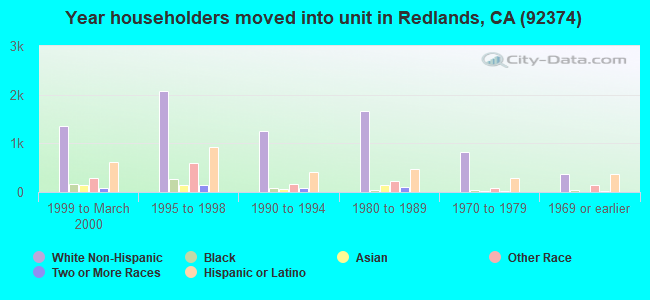
53% of the 92374 zip code residents lived in the same house 5 years ago. Out of people who lived in different houses, 66% lived in this county. Out of people who lived in different counties, 50% lived in California.
88% of the 92374 zip code residents lived in the same house 1 year ago. Out of people who lived in different houses, 65% moved from this county. Out of people who lived in different houses, 26% moved from different county within same state. Out of people who lived in different houses, 4% moved from different state. Out of people who lived in different houses, 2% moved from abroad.
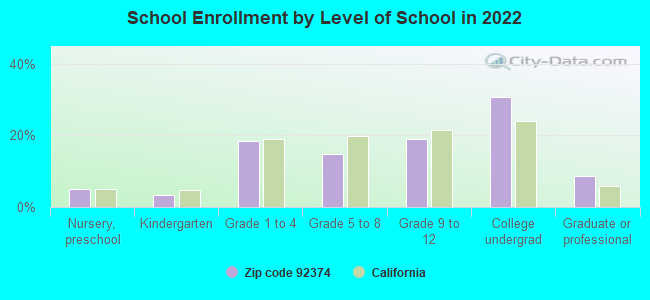
Private vs. public school enrollment:
Students in private schools in grades 1 to 8 (elementary and middle school): 241
Here:
5.7%
California:
10.5%
Students in private schools in grades 9 to 12 (high school): 100
Here:
4.1%
California:
8.5%
Students in private undergraduate colleges: 1,651
Here:
41.2%
California:
15.9%
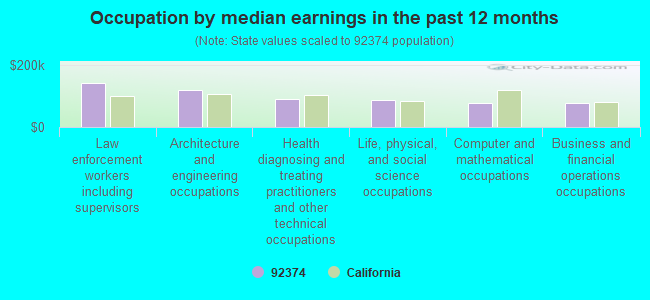
Occupation by median earnings in the past 12 months ($)
142,559Law enforcement workers including supervisors
120,793Architecture and engineering occupations
90,823Health diagnosing and treating practitioners and other technical occupations
88,992Life, physical, and social science occupations
77,592Computer and mathematical occupations
77,129Business and financial operations occupations
Companies with biggest federal contracts located in this zip code (REDLANDS, CA):
GEM POWER, LLC (10444 CORPORATE DR; small business) : $4,597,593 in 4 contractsfrom 2003 to 2006
$1,600,000 with Navy for Product or Service Improvement -- Basic Research (R&D). Signed on 2003-05-23. Completion date: 2005-02-28.
$1,506,755 with Navy for Other Defense -- Basic Research (R&D). Signed on 2004-12-02. Completion date: 2006-08-31.
$747,894 with Army for Defense Tank - Automotive -- Applied Research and Exploratory Development (R&D). Signed on 2006-05-02. Completion date: 2007-11-02.
$742,944, same as above.Signed on 2005-05-02. Completion date: 2006-07-30.
SANTA ANA WATERSHED ASSOCIATIO (25864-K BUSINESS CENTER DR)
$1,614,500 with Army for Other Natural Resources and Conservation Services. Signed on 2006-03-31. Completion date: 2007-03-31.
VAN JOYCE LINES INC (1785 INDUSTRIAL PARK AVE; small business) : $913,760 in 12 contractsfrom 2002 to 2006
Contracts for Other Transportation Travel and Relocation Services, Personal Services Contracts, Other Cargo and Freight Services, Packing/Crating Services, and moreby Air Force Signed by year:2000: $0; 2001: $0; 2002: $325,791; 2003: $611,825; 2004: -$49,166; 2005: $13,250; 2006: $12,060.
Biggest contracts:
$429,500 with Air Force for Other Transportation Travel and Relocation Services. Signed on 2003-09-15. Completion date: 2003-11-21.
$275,801 with Air Force for Personal Services Contracts. Signed on 2002-10-16. Completion date: 2003-09-30.
$50,039, same as above.Signed on 2003-04-01. Completion date: 2003-09-30.
$50,039, same as above.Signed on 2003-05-21. Completion date: 2003-09-30.
HYDRO TEK SYSTEMS INC (10418 ENTERPRISE DRIVE; small business) : $276,209 in 18 contractsfrom 2001 to 2006
Contracts for Trailers, Miscellaneous Special Industry Machinery, Miscellaneous Maintenance and Repair Shop Specialized Equipment, Diesel Engines and Components, and moreby Air Force, Army, Navy, U.S. Fish and Wildlife Service, and others Signed by year:2000: $0; 2001: $43,944; 2002: $0; 2003: $35,649; 2004: $76,602; 2005: $79,205; 2006: $40,809.
Biggest contracts:
$43,944 with Air Force for Trailers. Signed on 2001-08-27. Completion date: 2001-09-30.
$39,065 with Army for Miscellaneous Special Industry Machinery. Signed on 2004-04-09. Completion date: 2004-04-29.
$35,649 with Army for Miscellaneous Maintenance and Repair Shop Specialized Equipment. Signed on 2003-02-13. Completion date: 2003-02-28.
$33,283 with Army for Miscellaneous Maintenance and Repair Shop Specialized Equipment. Taking place in AL. Signed on 2004-09-13. Completion date: 2004-10-01.
GENERAL AMERICAN LIFE INSURANC (25884 BUS CTR DR STE C; small business) : $245,033 in 46 contractsfrom 2002 to 2006
Contracts for Lease or Rental of Facilities -- Office Buildings by Public Buildings Service Signed by year:2000: $0; 2001: $0; 2002: $24,502; 2003: $114,347; 2004: $12,252; 2005: $53,092; 2006: $40,840.
Biggest contracts:
$12,251 with Public Buildings Service for Lease or Rental of Facilities -- Office Buildings. Signed on 2003-09-15. Completion date: 2003-09-15.
$12,251, same as above.Signed on 2002-12-15. Completion date: 2002-12-15.
$12,251, same as above.Signed on 2002-12-15. Completion date: 2002-12-15.
$12,251, same as above.Signed on 2003-06-15. Completion date: 2003-06-15.
TCI CABLEVISION OF CALIFORNIA (1722 ORANGE TREE LN) : $232,928 in 9 contractsfrom 1999 to 2003
Contracts for Other Utilities, Telephone and/or Communications Services (includes Telegraph, Telex, and Cablevision Services) by Air Force, Department of Defense Signed by year:2000: $38,897; 2001: $73,516; 2002: $75,524; 2003: $6,766; 2004: $0; 2005: $0; 2006: $0.
Biggest contracts:
$44,735 with Air Force for Other Utilities. Signed on 2002-05-10. Completion date: 2002-09-30.
$42,930, same as above.Signed on 2001-10-01. Completion date: 2002-03-31.
$38,897, same as above.Signed on 2000-10-11. Completion date: 2001-03-31.
$38,225, same as above.Signed on 1999-12-23. Completion date: 2000-06-30.
VENTUREDYNE, LTD (1320 W COLTON AVE) : $141,047 in 6 contractsfrom 2000 to 2006
Contracts for Clean Work Stations, Controlled Environment and Related Equipment, Environmental Chambers and Related Equipment, Combination and Miscellaneous Instruments, , and moreby Navy, Air Force, NASA Signed by year:2000: $89,689; 2001: $0; 2002: $0; 2003: $26,785; 2004: $9,500; 2005: $7,000; 2006: $8,073.
Biggest contracts:
$61,058 with Navy for Clean Work Stations, Controlled Environment and Related Equipment. Signed on 2000-03-23. Completion date: 2000-06-14.
$28,631 with Navy for Environmental Chambers and Related Equipment. Signed on 2000-07-07. Completion date: 2000-08-18.
$26,785 with Air Force for Combination and Miscellaneous Instruments. Taking place in FL. Signed on 2003-05-21. Completion date: 2003-05-21.
$9,500 with NASA for . Signed on 2004-11-23. Completion date: 2005-02-08.
TELEDYNE BATTERY PRODUCTS (840 W BROCKTON AVE) : $135,935 in 3 contractsfrom 2001 to 2002
$77,035 with Defense Logistics Agency for Batteries, Rechargeable. Signed on 2002-01-31. Completion date: 2002-04-01.
$58,900, same as above.Signed on 2001-06-18. Completion date: 2001-08-17.
$0, same as above.Signed on 2002-05-02. Completion date: 2007-05-01.
SOUTHERN CALIFORNIA GAS COMPAN (1981 W LUGONIA AVE) : $125,461 in 63 contractsfrom 2001 to 2005
Contracts for Facilities Operations Support Services, Maintenance, Repair or Alteration of Real Property -- Hospitals and Infirmaries by Navy Signed by year:2000: $0; 2001: $3,905; 2002: $0; 2003: $30,964; 2004: $37,404; 2005: $53,188; 2006: $0.
Biggest contracts:
$12,456 with Navy for Facilities Operations Support Services. Signed on 2004-03-22. Completion date: 2004-04-02.
$4,813, same as above.Signed on 2004-01-15. Completion date: 2004-01-21.
$4,530, same as above.Signed on 2003-12-22. Completion date: 2003-12-22.
$3,905 with Navy for Maintenance, Repair or Alteration of Real Property -- Hospitals and Infirmaries. Taking place in MO. Signed on 2001-09-21. Completion date: 2001-10-11.
DELTA CONTRACTING CORP (1980 ORANGE TREE LN STE 10; small business)
$57,220 with Navy for Maintenance, Repair or Alteration of Real Property -- Government-Owned Government-Operated (GOGO) R&D Facilities. Taking place in VA. Signed on 2002-09-26. Completion date: 2003-01-09.
Top industries in this zip code by the number of employees in 2005:
Educational Services: Colleges, Universities, and Professional Schools (over 1000 employees: 1 establishment)
Administrative and Support and Waste Management and Remediation Services: Temporary Help Services (500-999: 1, 50-99: 1)
Other Services (except Public Administration): Religious Organizations (100-249: 2, 50-99: 1, 20-49: 4, 10-19: 3, 5-9: 6, 1-4: 8)
2005 - 2018 National Fire Incident Reporting System (NFIRS) incidents
According to the data from the years 2005 - 2018 the average number of fire incidents per year is 155. The highest number of fires - 220 took place in 2018, and the least - 96 in 2008. The data has a growing trend.
When looking into fire subcategories, the most incidents belonged to: Outside Fires (45.9%), and Structure Fires (26.9%).
Fire incident types reported to NFIRS in Zip Code 92374


 Nearest zip codes: 92373, 92346, 92354, 92408, 92359, 92324.


 According to the data from the years 2005 - 2018 the average number of fire incidents per year is 155. The highest number of fires - 220 took place in 2018, and the least - 96 in 2008. The data has a growing trend.
 When looking into fire subcategories, the most incidents belonged to: Outside Fires (45.9%), and Structure Fires (26.9%).