Highland, California Submit your own pictures of this city and show them to the world
OSM Map
General Map
Google Map
MSN Map
OSM Map
General Map
Google Map
MSN Map
OSM Map
General Map
Google Map
MSN Map
OSM Map
General Map
Google Map
MSN Map
Please wait while loading the map...
Population in 2022: 56,705 (100% urban, 0% rural). Population change since 2000: +27.1%Males: 28,195 Females: 28,510
March 2022 cost of living index in Highland: 82.4 (low, U.S. average is 100) Percentage of residents living in poverty in 2022: 15.9%for White Non-Hispanic residents , 12.4% for Black residents , 18.8% for Hispanic or Latino residents , 4.0% for American Indian residents , 21.3% for other race residents , 13.1% for two or more races residents )
Profiles of local businesses
Business Search - 14 Million verified businesses
Data:
Median household income ($)
Median household income (% change since 2000)
Household income diversity
Ratio of average income to average house value (%)
Ratio of average income to average rent
Median household income ($) - White
Median household income ($) - Black or African American
Median household income ($) - Asian
Median household income ($) - Hispanic or Latino
Median household income ($) - American Indian and Alaska Native
Median household income ($) - Multirace
Median household income ($) - Other Race
Median household income for houses/condos with a mortgage ($)
Median household income for apartments without a mortgage ($)
Races - White alone (%)
Races - White alone (% change since 2000)
Races - Black alone (%)
Races - Black alone (% change since 2000)
Races - American Indian alone (%)
Races - American Indian alone (% change since 2000)
Races - Asian alone (%)
Races - Asian alone (% change since 2000)
Races - Hispanic (%)
Races - Hispanic (% change since 2000)
Races - Native Hawaiian and Other Pacific Islander alone (%)
Races - Native Hawaiian and Other Pacific Islander alone (% change since 2000)
Races - Two or more races (%)
Races - Two or more races (% change since 2000)
Races - Other race alone (%)
Races - Other race alone (% change since 2000)
Racial diversity
Unemployment (%)
Unemployment (% change since 2000)
Unemployment (%) - White
Unemployment (%) - Black or African American
Unemployment (%) - Asian
Unemployment (%) - Hispanic or Latino
Unemployment (%) - American Indian and Alaska Native
Unemployment (%) - Multirace
Unemployment (%) - Other Race
Population density (people per square mile)
Population - Males (%)
Population - Females (%)
Population - Males (%) - White
Population - Males (%) - Black or African American
Population - Males (%) - Asian
Population - Males (%) - Hispanic or Latino
Population - Males (%) - American Indian and Alaska Native
Population - Males (%) - Multirace
Population - Males (%) - Other Race
Population - Females (%) - White
Population - Females (%) - Black or African American
Population - Females (%) - Asian
Population - Females (%) - Hispanic or Latino
Population - Females (%) - American Indian and Alaska Native
Population - Females (%) - Multirace
Population - Females (%) - Other Race
Coronavirus confirmed cases (Apr 24, 2024)
Deaths caused by coronavirus (Apr 24, 2024)
Coronavirus confirmed cases (per 100k population) (Apr 24, 2024)
Deaths caused by coronavirus (per 100k population) (Apr 24, 2024)
Daily increase in number of cases (Apr 24, 2024)
Weekly increase in number of cases (Apr 24, 2024)
Cases doubled (in days) (Apr 24, 2024)
Hospitalized patients (Apr 18, 2022)
Negative test results (Apr 18, 2022)
Total test results (Apr 18, 2022)
COVID Vaccine doses distributed (per 100k population) (Sep 19, 2023)
COVID Vaccine doses administered (per 100k population) (Sep 19, 2023)
COVID Vaccine doses distributed (Sep 19, 2023)
COVID Vaccine doses administered (Sep 19, 2023)
Likely homosexual households (%)
Likely homosexual households (% change since 2000)
Likely homosexual households - Lesbian couples (%)
Likely homosexual households - Lesbian couples (% change since 2000)
Likely homosexual households - Gay men (%)
Likely homosexual households - Gay men (% change since 2000)
Cost of living index
Median gross rent ($)
Median contract rent ($)
Median monthly housing costs ($)
Median house or condo value ($)
Median house or condo value ($ change since 2000)
Mean house or condo value by units in structure - 1, detached ($)
Mean house or condo value by units in structure - 1, attached ($)
Mean house or condo value by units in structure - 2 ($)
Mean house or condo value by units in structure by units in structure - 3 or 4 ($)
Mean house or condo value by units in structure - 5 or more ($)
Mean house or condo value by units in structure - Boat, RV, van, etc. ($)
Mean house or condo value by units in structure - Mobile home ($)
Median house or condo value ($) - White
Median house or condo value ($) - Black or African American
Median house or condo value ($) - Asian
Median house or condo value ($) - Hispanic or Latino
Median house or condo value ($) - American Indian and Alaska Native
Median house or condo value ($) - Multirace
Median house or condo value ($) - Other Race
Median resident age
Resident age diversity
Median resident age - Males
Median resident age - Females
Median resident age - White
Median resident age - Black or African American
Median resident age - Asian
Median resident age - Hispanic or Latino
Median resident age - American Indian and Alaska Native
Median resident age - Multirace
Median resident age - Other Race
Median resident age - Males - White
Median resident age - Males - Black or African American
Median resident age - Males - Asian
Median resident age - Males - Hispanic or Latino
Median resident age - Males - American Indian and Alaska Native
Median resident age - Males - Multirace
Median resident age - Males - Other Race
Median resident age - Females - White
Median resident age - Females - Black or African American
Median resident age - Females - Asian
Median resident age - Females - Hispanic or Latino
Median resident age - Females - American Indian and Alaska Native
Median resident age - Females - Multirace
Median resident age - Females - Other Race
Commute - mean travel time to work (minutes)
Travel time to work - Less than 5 minutes (%)
Travel time to work - Less than 5 minutes (% change since 2000)
Travel time to work - 5 to 9 minutes (%)
Travel time to work - 5 to 9 minutes (% change since 2000)
Travel time to work - 10 to 19 minutes (%)
Travel time to work - 10 to 19 minutes (% change since 2000)
Travel time to work - 20 to 29 minutes (%)
Travel time to work - 20 to 29 minutes (% change since 2000)
Travel time to work - 30 to 39 minutes (%)
Travel time to work - 30 to 39 minutes (% change since 2000)
Travel time to work - 40 to 59 minutes (%)
Travel time to work - 40 to 59 minutes (% change since 2000)
Travel time to work - 60 to 89 minutes (%)
Travel time to work - 60 to 89 minutes (% change since 2000)
Travel time to work - 90 or more minutes (%)
Travel time to work - 90 or more minutes (% change since 2000)
Marital status - Never married (%)
Marital status - Now married (%)
Marital status - Separated (%)
Marital status - Widowed (%)
Marital status - Divorced (%)
Median family income ($)
Median family income (% change since 2000)
Median non-family income ($)
Median non-family income (% change since 2000)
Median per capita income ($)
Median per capita income (% change since 2000)
Median family income ($) - White
Median family income ($) - Black or African American
Median family income ($) - Asian
Median family income ($) - Hispanic or Latino
Median family income ($) - American Indian and Alaska Native
Median family income ($) - Multirace
Median family income ($) - Other Race
Median year house/condo built
Median year apartment built
Year house built - Built 2005 or later (%)
Year house built - Built 2000 to 2004 (%)
Year house built - Built 1990 to 1999 (%)
Year house built - Built 1980 to 1989 (%)
Year house built - Built 1970 to 1979 (%)
Year house built - Built 1960 to 1969 (%)
Year house built - Built 1950 to 1959 (%)
Year house built - Built 1940 to 1949 (%)
Year house built - Built 1939 or earlier (%)
Average household size
Household density (households per square mile)
Average household size - White
Average household size - Black or African American
Average household size - Asian
Average household size - Hispanic or Latino
Average household size - American Indian and Alaska Native
Average household size - Multirace
Average household size - Other Race
Occupied housing units (%)
Vacant housing units (%)
Owner occupied housing units (%)
Renter occupied housing units (%)
Vacancy status - For rent (%)
Vacancy status - For sale only (%)
Vacancy status - Rented or sold, not occupied (%)
Vacancy status - For seasonal, recreational, or occasional use (%)
Vacancy status - For migrant workers (%)
Vacancy status - Other vacant (%)
Residents with income below the poverty level (%)
Residents with income below 50% of the poverty level (%)
Children below poverty level (%)
Poor families by family type - Married-couple family (%)
Poor families by family type - Male, no wife present (%)
Poor families by family type - Female, no husband present (%)
Poverty status for native-born residents (%)
Poverty status for foreign-born residents (%)
Poverty among high school graduates not in families (%)
Poverty among people who did not graduate high school not in families (%)
Residents with income below the poverty level (%) - White
Residents with income below the poverty level (%) - Black or African American
Residents with income below the poverty level (%) - Asian
Residents with income below the poverty level (%) - Hispanic or Latino
Residents with income below the poverty level (%) - American Indian and Alaska Native
Residents with income below the poverty level (%) - Multirace
Residents with income below the poverty level (%) - Other Race
Air pollution - Air Quality Index (AQI)
Air pollution - CO
Air pollution - NO2
Air pollution - SO2
Air pollution - Ozone
Air pollution - PM10
Air pollution - PM25
Air pollution - Pb
Crime - Murders per 100,000 population
Crime - Rapes per 100,000 population
Crime - Robberies per 100,000 population
Crime - Assaults per 100,000 population
Crime - Burglaries per 100,000 population
Crime - Thefts per 100,000 population
Crime - Auto thefts per 100,000 population
Crime - Arson per 100,000 population
Crime - City-data.com crime index
Crime - Violent crime index
Crime - Property crime index
Crime - Murders per 100,000 population (5 year average)
Crime - Rapes per 100,000 population (5 year average)
Crime - Robberies per 100,000 population (5 year average)
Crime - Assaults per 100,000 population (5 year average)
Crime - Burglaries per 100,000 population (5 year average)
Crime - Thefts per 100,000 population (5 year average)
Crime - Auto thefts per 100,000 population (5 year average)
Crime - Arson per 100,000 population (5 year average)
Crime - City-data.com crime index (5 year average)
Crime - Violent crime index (5 year average)
Crime - Property crime index (5 year average)
1996 Presidential Elections Results (%) - Democratic Party (Clinton)
1996 Presidential Elections Results (%) - Republican Party (Dole)
1996 Presidential Elections Results (%) - Other
2000 Presidential Elections Results (%) - Democratic Party (Gore)
2000 Presidential Elections Results (%) - Republican Party (Bush)
2000 Presidential Elections Results (%) - Other
2004 Presidential Elections Results (%) - Democratic Party (Kerry)
2004 Presidential Elections Results (%) - Republican Party (Bush)
2004 Presidential Elections Results (%) - Other
2008 Presidential Elections Results (%) - Democratic Party (Obama)
2008 Presidential Elections Results (%) - Republican Party (McCain)
2008 Presidential Elections Results (%) - Other
2012 Presidential Elections Results (%) - Democratic Party (Obama)
2012 Presidential Elections Results (%) - Republican Party (Romney)
2012 Presidential Elections Results (%) - Other
2016 Presidential Elections Results (%) - Democratic Party (Clinton)
2016 Presidential Elections Results (%) - Republican Party (Trump)
2016 Presidential Elections Results (%) - Other
2020 Presidential Elections Results (%) - Democratic Party (Biden)
2020 Presidential Elections Results (%) - Republican Party (Trump)
2020 Presidential Elections Results (%) - Other
Ancestries Reported - Arab (%)
Ancestries Reported - Czech (%)
Ancestries Reported - Danish (%)
Ancestries Reported - Dutch (%)
Ancestries Reported - English (%)
Ancestries Reported - French (%)
Ancestries Reported - French Canadian (%)
Ancestries Reported - German (%)
Ancestries Reported - Greek (%)
Ancestries Reported - Hungarian (%)
Ancestries Reported - Irish (%)
Ancestries Reported - Italian (%)
Ancestries Reported - Lithuanian (%)
Ancestries Reported - Norwegian (%)
Ancestries Reported - Polish (%)
Ancestries Reported - Portuguese (%)
Ancestries Reported - Russian (%)
Ancestries Reported - Scotch-Irish (%)
Ancestries Reported - Scottish (%)
Ancestries Reported - Slovak (%)
Ancestries Reported - Subsaharan African (%)
Ancestries Reported - Swedish (%)
Ancestries Reported - Swiss (%)
Ancestries Reported - Ukrainian (%)
Ancestries Reported - United States (%)
Ancestries Reported - Welsh (%)
Ancestries Reported - West Indian (%)
Ancestries Reported - Other (%)
Educational Attainment - No schooling completed (%)
Educational Attainment - Less than high school (%)
Educational Attainment - High school or equivalent (%)
Educational Attainment - Less than 1 year of college (%)
Educational Attainment - 1 or more years of college (%)
Educational Attainment - Associate degree (%)
Educational Attainment - Bachelor's degree (%)
Educational Attainment - Master's degree (%)
Educational Attainment - Professional school degree (%)
Educational Attainment - Doctorate degree (%)
School Enrollment - Nursery, preschool (%)
School Enrollment - Kindergarten (%)
School Enrollment - Grade 1 to 4 (%)
School Enrollment - Grade 5 to 8 (%)
School Enrollment - Grade 9 to 12 (%)
School Enrollment - College undergrad (%)
School Enrollment - Graduate or professional (%)
School Enrollment - Not enrolled in school (%)
School enrollment - Public schools (%)
School enrollment - Private schools (%)
School enrollment - Not enrolled (%)
Median number of rooms in houses and condos
Median number of rooms in apartments
Housing units lacking complete plumbing facilities (%)
Housing units lacking complete kitchen facilities (%)
Density of houses
Urban houses (%)
Rural houses (%)
Households with people 60 years and over (%)
Households with people 65 years and over (%)
Households with people 75 years and over (%)
Households with one or more nonrelatives (%)
Households with no nonrelatives (%)
Population in households (%)
Family households (%)
Nonfamily households (%)
Population in families (%)
Family households with own children (%)
Median number of bedrooms in owner occupied houses
Mean number of bedrooms in owner occupied houses
Median number of bedrooms in renter occupied houses
Mean number of bedrooms in renter occupied houses
Median number of vehichles in owner occupied houses
Mean number of vehichles in owner occupied houses
Median number of vehichles in renter occupied houses
Mean number of vehichles in renter occupied houses
Mortgage status - with mortgage (%)
Mortgage status - with second mortgage (%)
Mortgage status - with home equity loan (%)
Mortgage status - with both second mortgage and home equity loan (%)
Mortgage status - without a mortgage (%)
Average family size
Average family size - White
Average family size - Black or African American
Average family size - Asian
Average family size - Hispanic or Latino
Average family size - American Indian and Alaska Native
Average family size - Multirace
Average family size - Other Race
Geographical mobility - Same house 1 year ago (%)
Geographical mobility - Moved within same county (%)
Geographical mobility - Moved from different county within same state (%)
Geographical mobility - Moved from different state (%)
Geographical mobility - Moved from abroad (%)
Place of birth - Born in state of residence (%)
Place of birth - Born in other state (%)
Place of birth - Native, outside of US (%)
Place of birth - Foreign born (%)
Housing units in structures - 1, detached (%)
Housing units in structures - 1, attached (%)
Housing units in structures - 2 (%)
Housing units in structures - 3 or 4 (%)
Housing units in structures - 5 to 9 (%)
Housing units in structures - 10 to 19 (%)
Housing units in structures - 20 to 49 (%)
Housing units in structures - 50 or more (%)
Housing units in structures - Mobile home (%)
Housing units in structures - Boat, RV, van, etc. (%)
House/condo owner moved in on average (years ago)
Renter moved in on average (years ago)
Year householder moved into unit - Moved in 1999 to March 2000 (%)
Year householder moved into unit - Moved in 1995 to 1998 (%)
Year householder moved into unit - Moved in 1990 to 1994 (%)
Year householder moved into unit - Moved in 1980 to 1989 (%)
Year householder moved into unit - Moved in 1970 to 1979 (%)
Year householder moved into unit - Moved in 1969 or earlier (%)
Means of transportation to work - Drove car alone (%)
Means of transportation to work - Carpooled (%)
Means of transportation to work - Public transportation (%)
Means of transportation to work - Bus or trolley bus (%)
Means of transportation to work - Streetcar or trolley car (%)
Means of transportation to work - Subway or elevated (%)
Means of transportation to work - Railroad (%)
Means of transportation to work - Ferryboat (%)
Means of transportation to work - Taxicab (%)
Means of transportation to work - Motorcycle (%)
Means of transportation to work - Bicycle (%)
Means of transportation to work - Walked (%)
Means of transportation to work - Other means (%)
Working at home (%)
Industry diversity
Most Common Industries - Agriculture, forestry, fishing and hunting, and mining (%)
Most Common Industries - Agriculture, forestry, fishing and hunting (%)
Most Common Industries - Mining, quarrying, and oil and gas extraction (%)
Most Common Industries - Construction (%)
Most Common Industries - Manufacturing (%)
Most Common Industries - Wholesale trade (%)
Most Common Industries - Retail trade (%)
Most Common Industries - Transportation and warehousing, and utilities (%)
Most Common Industries - Transportation and warehousing (%)
Most Common Industries - Utilities (%)
Most Common Industries - Information (%)
Most Common Industries - Finance and insurance, and real estate and rental and leasing (%)
Most Common Industries - Finance and insurance (%)
Most Common Industries - Real estate and rental and leasing (%)
Most Common Industries - Professional, scientific, and management, and administrative and waste management services (%)
Most Common Industries - Professional, scientific, and technical services (%)
Most Common Industries - Management of companies and enterprises (%)
Most Common Industries - Administrative and support and waste management services (%)
Most Common Industries - Educational services, and health care and social assistance (%)
Most Common Industries - Educational services (%)
Most Common Industries - Health care and social assistance (%)
Most Common Industries - Arts, entertainment, and recreation, and accommodation and food services (%)
Most Common Industries - Arts, entertainment, and recreation (%)
Most Common Industries - Accommodation and food services (%)
Most Common Industries - Other services, except public administration (%)
Most Common Industries - Public administration (%)
Occupation diversity
Most Common Occupations - Management, business, science, and arts occupations (%)
Most Common Occupations - Management, business, and financial occupations (%)
Most Common Occupations - Management occupations (%)
Most Common Occupations - Business and financial operations occupations (%)
Most Common Occupations - Computer, engineering, and science occupations (%)
Most Common Occupations - Computer and mathematical occupations (%)
Most Common Occupations - Architecture and engineering occupations (%)
Most Common Occupations - Life, physical, and social science occupations (%)
Most Common Occupations - Education, legal, community service, arts, and media occupations (%)
Most Common Occupations - Community and social service occupations (%)
Most Common Occupations - Legal occupations (%)
Most Common Occupations - Education, training, and library occupations (%)
Most Common Occupations - Arts, design, entertainment, sports, and media occupations (%)
Most Common Occupations - Healthcare practitioners and technical occupations (%)
Most Common Occupations - Health diagnosing and treating practitioners and other technical occupations (%)
Most Common Occupations - Health technologists and technicians (%)
Most Common Occupations - Service occupations (%)
Most Common Occupations - Healthcare support occupations (%)
Most Common Occupations - Protective service occupations (%)
Most Common Occupations - Fire fighting and prevention, and other protective service workers including supervisors (%)
Most Common Occupations - Law enforcement workers including supervisors (%)
Most Common Occupations - Food preparation and serving related occupations (%)
Most Common Occupations - Building and grounds cleaning and maintenance occupations (%)
Most Common Occupations - Personal care and service occupations (%)
Most Common Occupations - Sales and office occupations (%)
Most Common Occupations - Sales and related occupations (%)
Most Common Occupations - Office and administrative support occupations (%)
Most Common Occupations - Natural resources, construction, and maintenance occupations (%)
Most Common Occupations - Farming, fishing, and forestry occupations (%)
Most Common Occupations - Construction and extraction occupations (%)
Most Common Occupations - Installation, maintenance, and repair occupations (%)
Most Common Occupations - Production, transportation, and material moving occupations (%)
Most Common Occupations - Production occupations (%)
Most Common Occupations - Transportation occupations (%)
Most Common Occupations - Material moving occupations (%)
People in Group quarters - Institutionalized population (%)
People in Group quarters - Correctional institutions (%)
People in Group quarters - Federal prisons and detention centers (%)
People in Group quarters - Halfway houses (%)
People in Group quarters - Local jails and other confinement facilities (including police lockups) (%)
People in Group quarters - Military disciplinary barracks (%)
People in Group quarters - State prisons (%)
People in Group quarters - Other types of correctional institutions (%)
People in Group quarters - Nursing homes (%)
People in Group quarters - Hospitals/wards, hospices, and schools for the handicapped (%)
People in Group quarters - Hospitals/wards and hospices for chronically ill (%)
People in Group quarters - Hospices or homes for chronically ill (%)
People in Group quarters - Military hospitals or wards for chronically ill (%)
People in Group quarters - Other hospitals or wards for chronically ill (%)
People in Group quarters - Hospitals or wards for drug/alcohol abuse (%)
People in Group quarters - Mental (Psychiatric) hospitals or wards (%)
People in Group quarters - Schools, hospitals, or wards for the mentally retarded (%)
People in Group quarters - Schools, hospitals, or wards for the physically handicapped (%)
People in Group quarters - Institutions for the deaf (%)
People in Group quarters - Institutions for the blind (%)
People in Group quarters - Orthopedic wards and institutions for the physically handicapped (%)
People in Group quarters - Wards in general hospitals for patients who have no usual home elsewhere (%)
People in Group quarters - Wards in military hospitals for patients who have no usual home elsewhere (%)
People in Group quarters - Juvenile institutions (%)
People in Group quarters - Long-term care (%)
People in Group quarters - Homes for abused, dependent, and neglected children (%)
People in Group quarters - Residential treatment centers for emotionally disturbed children (%)
People in Group quarters - Training schools for juvenile delinquents (%)
People in Group quarters - Short-term care, detention or diagnostic centers for delinquent children (%)
People in Group quarters - Type of juvenile institution unknown (%)
People in Group quarters - Noninstitutionalized population (%)
People in Group quarters - College dormitories (includes college quarters off campus) (%)
People in Group quarters - Military quarters (%)
People in Group quarters - On base (%)
People in Group quarters - Barracks, unaccompanied personnel housing (UPH), (Enlisted/Officer), ;and similar group living quarters for military personnel (%)
People in Group quarters - Transient quarters for temporary residents (%)
People in Group quarters - Military ships (%)
People in Group quarters - Group homes (%)
People in Group quarters - Homes or halfway houses for drug/alcohol abuse (%)
People in Group quarters - Homes for the mentally ill (%)
People in Group quarters - Homes for the mentally retarded (%)
People in Group quarters - Homes for the physically handicapped (%)
People in Group quarters - Other group homes (%)
People in Group quarters - Religious group quarters (%)
People in Group quarters - Dormitories (%)
People in Group quarters - Agriculture workers' dormitories on farms (%)
People in Group quarters - Job Corps and vocational training facilities (%)
People in Group quarters - Other workers' dormitories (%)
People in Group quarters - Crews of maritime vessels (%)
People in Group quarters - Other nonhousehold living situations (%)
People in Group quarters - Other noninstitutional group quarters (%)
Residents speaking English at home (%)
Residents speaking English at home - Born in the United States (%)
Residents speaking English at home - Native, born elsewhere (%)
Residents speaking English at home - Foreign born (%)
Residents speaking Spanish at home (%)
Residents speaking Spanish at home - Born in the United States (%)
Residents speaking Spanish at home - Native, born elsewhere (%)
Residents speaking Spanish at home - Foreign born (%)
Residents speaking other language at home (%)
Residents speaking other language at home - Born in the United States (%)
Residents speaking other language at home - Native, born elsewhere (%)
Residents speaking other language at home - Foreign born (%)
Class of Workers - Employee of private company (%)
Class of Workers - Self-employed in own incorporated business (%)
Class of Workers - Private not-for-profit wage and salary workers (%)
Class of Workers - Local government workers (%)
Class of Workers - State government workers (%)
Class of Workers - Federal government workers (%)
Class of Workers - Self-employed workers in own not incorporated business and Unpaid family workers (%)
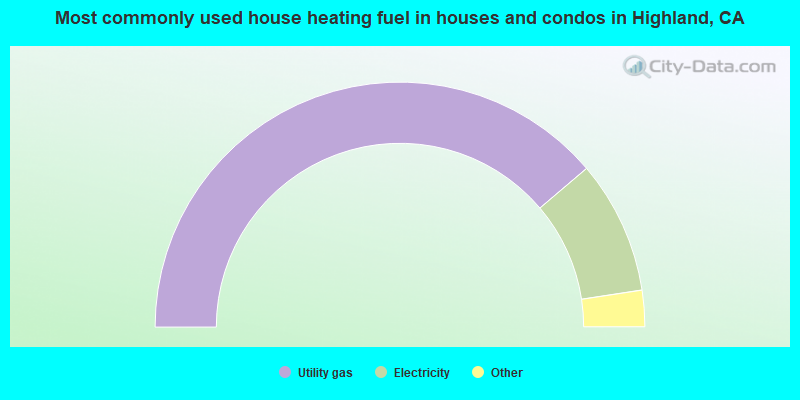
House heating fuel used in houses and condos - Utility gas (%)
House heating fuel used in houses and condos - Bottled, tank, or LP gas (%)
House heating fuel used in houses and condos - Electricity (%)
House heating fuel used in houses and condos - Fuel oil, kerosene, etc. (%)
House heating fuel used in houses and condos - Coal or coke (%)
House heating fuel used in houses and condos - Wood (%)
House heating fuel used in houses and condos - Solar energy (%)
House heating fuel used in houses and condos - Other fuel (%)
House heating fuel used in houses and condos - No fuel used (%)
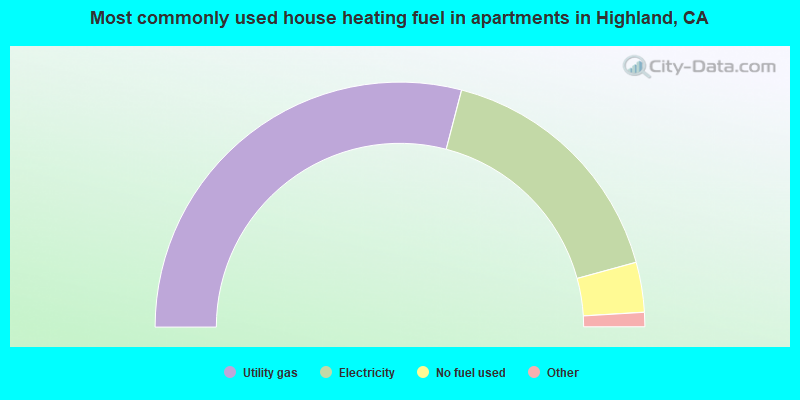
House heating fuel used in apartments - Utility gas (%)
House heating fuel used in apartments - Bottled, tank, or LP gas (%)
House heating fuel used in apartments - Electricity (%)
House heating fuel used in apartments - Fuel oil, kerosene, etc. (%)
House heating fuel used in apartments - Coal or coke (%)
House heating fuel used in apartments - Wood (%)
House heating fuel used in apartments - Solar energy (%)
House heating fuel used in apartments - Other fuel (%)
House heating fuel used in apartments - No fuel used (%)
Armed forces status - In Armed Forces (%)
Armed forces status - Civilian (%)
Armed forces status - Civilian - Veteran (%)
Armed forces status - Civilian - Nonveteran (%)
Fatal accidents locations in years 2005-2021
Fatal accidents locations in 2005
Fatal accidents locations in 2006
Fatal accidents locations in 2007
Fatal accidents locations in 2008
Fatal accidents locations in 2009
Fatal accidents locations in 2010
Fatal accidents locations in 2011
Fatal accidents locations in 2012
Fatal accidents locations in 2013
Fatal accidents locations in 2014
Fatal accidents locations in 2015
Fatal accidents locations in 2016
Fatal accidents locations in 2017
Fatal accidents locations in 2018
Fatal accidents locations in 2019
Fatal accidents locations in 2020
Fatal accidents locations in 2021
Alcohol use - People drinking some alcohol every month (%)
Alcohol use - People not drinking at all (%)
Alcohol use - Average days/month drinking alcohol
Alcohol use - Average drinks/week
Alcohol use - Average days/year people drink much
Audiometry - Average condition of hearing (%)
Audiometry - People that can hear a whisper from across a quiet room (%)
Audiometry - People that can hear normal voice from across a quiet room (%)
Audiometry - Ears ringing, roaring, buzzing (%)
Audiometry - Had a job exposure to loud noise (%)
Audiometry - Had off-work exposure to loud noise (%)
Blood Pressure & Cholesterol - Has high blood pressure (%)
Blood Pressure & Cholesterol - Checking blood pressure at home (%)
Blood Pressure & Cholesterol - Frequently checking blood cholesterol (%)
Blood Pressure & Cholesterol - Has high cholesterol level (%)
Consumer Behavior - Money monthly spent on food at supermarket/grocery store
Consumer Behavior - Money monthly spent on food at other stores
Consumer Behavior - Money monthly spent on eating out
Consumer Behavior - Money monthly spent on carryout/delivered foods
Consumer Behavior - Income spent on food at supermarket/grocery store (%)
Consumer Behavior - Income spent on food at other stores (%)
Consumer Behavior - Income spent on eating out (%)
Consumer Behavior - Income spent on carryout/delivered foods (%)
Current Health Status - General health condition (%)
Current Health Status - Blood donors (%)
Current Health Status - Has blood ever tested for HIV virus (%)
Current Health Status - Left-handed people (%)
Dermatology - People using sunscreen (%)
Diabetes - Diabetics (%)
Diabetes - Had a blood test for high blood sugar (%)
Diabetes - People taking insulin (%)
Diet Behavior & Nutrition - Diet health (%)
Diet Behavior & Nutrition - Milk product consumption (# of products/month)
Diet Behavior & Nutrition - Meals not home prepared (#/week)
Diet Behavior & Nutrition - Meals from fast food or pizza place (#/week)
Diet Behavior & Nutrition - Ready-to-eat foods (#/month)
Diet Behavior & Nutrition - Frozen meals/pizza (#/month)
Drug Use - People that ever used marijuana or hashish (%)
Drug Use - Ever used hard drugs (%)
Drug Use - Ever used any form of cocaine (%)
Drug Use - Ever used heroin (%)
Drug Use - Ever used methamphetamine (%)
Health Insurance - People covered by health insurance (%)
Kidney Conditions-Urology - Avg. # of times urinating at night
Medical Conditions - People with asthma (%)
Medical Conditions - People with anemia (%)
Medical Conditions - People with psoriasis (%)
Medical Conditions - People with overweight (%)
Medical Conditions - Elderly people having difficulties in thinking or remembering (%)
Medical Conditions - People who ever received blood transfusion (%)
Medical Conditions - People having trouble seeing even with glass/contacts (%)
Medical Conditions - People with arthritis (%)
Medical Conditions - People with gout (%)
Medical Conditions - People with congestive heart failure (%)
Medical Conditions - People with coronary heart disease (%)
Medical Conditions - People with angina pectoris (%)
Medical Conditions - People who ever had heart attack (%)
Medical Conditions - People who ever had stroke (%)
Medical Conditions - People with emphysema (%)
Medical Conditions - People with thyroid problem (%)
Medical Conditions - People with chronic bronchitis (%)
Medical Conditions - People with any liver condition (%)
Medical Conditions - People who ever had cancer or malignancy (%)
Mental Health - People who have little interest in doing things (%)
Mental Health - People feeling down, depressed, or hopeless (%)
Mental Health - People who have trouble sleeping or sleeping too much (%)
Mental Health - People feeling tired or having little energy (%)
Mental Health - People with poor appetite or overeating (%)
Mental Health - People feeling bad about themself (%)
Mental Health - People who have trouble concentrating on things (%)
Mental Health - People moving or speaking slowly or too fast (%)
Mental Health - People having thoughts they would be better off dead (%)
Oral Health - Average years since last visit a dentist
Oral Health - People embarrassed because of mouth (%)
Oral Health - People with gum disease (%)
Oral Health - General health of teeth and gums (%)
Oral Health - Average days a week using dental floss/device
Oral Health - Average days a week using mouthwash for dental problem
Oral Health - Average number of teeth
Pesticide Use - Households using pesticides to control insects (%)
Pesticide Use - Households using pesticides to kill weeds (%)
Physical Activity - People doing vigorous-intensity work activities (%)
Physical Activity - People doing moderate-intensity work activities (%)
Physical Activity - People walking or bicycling (%)
Physical Activity - People doing vigorous-intensity recreational activities (%)
Physical Activity - People doing moderate-intensity recreational activities (%)
Physical Activity - Average hours a day doing sedentary activities
Physical Activity - Average hours a day watching TV or videos
Physical Activity - Average hours a day using computer
Physical Functioning - People having limitations keeping them from working (%)
Physical Functioning - People limited in amount of work they can do (%)
Physical Functioning - People that need special equipment to walk (%)
Physical Functioning - People experiencing confusion/memory problems (%)
Physical Functioning - People requiring special healthcare equipment (%)
Prescription Medications - Average number of prescription medicines taking
Preventive Aspirin Use - Adults 40+ taking low-dose aspirin (%)
Reproductive Health - Vaginal deliveries (%)
Reproductive Health - Cesarean deliveries (%)
Reproductive Health - Deliveries resulted in a live birth (%)
Reproductive Health - Pregnancies resulted in a delivery (%)
Reproductive Health - Women breastfeeding newborns (%)
Reproductive Health - Women that had a hysterectomy (%)
Reproductive Health - Women that had both ovaries removed (%)
Reproductive Health - Women that have ever taken birth control pills (%)
Reproductive Health - Women taking birth control pills (%)
Reproductive Health - Women that have ever used Depo-Provera or injectables (%)
Reproductive Health - Women that have ever used female hormones (%)
Sexual Behavior - People 18+ that ever had sex (vaginal, anal, or oral) (%)
Sexual Behavior - Males 18+ that ever had vaginal sex with a woman (%)
Sexual Behavior - Males 18+ that ever performed oral sex on a woman (%)
Sexual Behavior - Males 18+ that ever had anal sex with a woman (%)
Sexual Behavior - Males 18+ that ever had any sex with a man (%)
Sexual Behavior - Females 18+ that ever had vaginal sex with a man (%)
Sexual Behavior - Females 18+ that ever performed oral sex on a man (%)
Sexual Behavior - Females 18+ that ever had anal sex with a man (%)
Sexual Behavior - Females 18+ that ever had any kind of sex with a woman (%)
Sexual Behavior - Average age people first had sex
Sexual Behavior - Average number of female sex partners in lifetime (males 18+)
Sexual Behavior - Average number of female vaginal sex partners in lifetime (males 18+)
Sexual Behavior - Average age people first performed oral sex on a woman (18+)
Sexual Behavior - Average number of woman performed oral sex on in lifetime (18+)
Sexual Behavior - Average number of male sex partners in lifetime (males 18+)
Sexual Behavior - Average number of male anal sex partners in lifetime (males 18+)
Sexual Behavior - Average age people first performed oral sex on a man (18+)
Sexual Behavior - Average number of male oral sex partners in lifetime (18+)
Sexual Behavior - People using protection when performing oral sex (%)
Sexual Behavior - Average number of times people have vaginal or anal sex a year
Sexual Behavior - People having sex without condom (%)
Sexual Behavior - Average number of male sex partners in lifetime (females 18+)
Sexual Behavior - Average number of male vaginal sex partners in lifetime (females 18+)
Sexual Behavior - Average number of female sex partners in lifetime (females 18+)
Sexual Behavior - Circumcised males 18+ (%)
Sleep Disorders - Average hours sleeping at night
Sleep Disorders - People that has trouble sleeping (%)
Smoking-Cigarette Use - People smoking cigarettes (%)
Taste & Smell - People 40+ having problems with smell (%)
Taste & Smell - People 40+ having problems with taste (%)
Taste & Smell - People 40+ that ever had wisdom teeth removed (%)
Taste & Smell - People 40+ that ever had tonsils teeth removed (%)
Taste & Smell - People 40+ that ever had a loss of consciousness because of a head injury (%)
Taste & Smell - People 40+ that ever had a broken nose or other serious injury to face or skull (%)
Taste & Smell - People 40+ that ever had two or more sinus infections (%)
Weight - Average height (inches)
Weight - Average weight (pounds)
Weight - Average BMI
Weight - People that are obese (%)
Weight - People that ever were obese (%)
Weight - People trying to lose weight (%)
34,395 60.2% Hispanic 12,073 21.1% White alone 5,179 9.1% Asian alone 3,760 6.6% Black alone 1,428 2.5% Two or more races 647 1.1% Other race alone 12 0.02% American Indian alone 8 0.01% Native Hawaiian and Other
According to our research of California and other state lists, there were 2 registered sex offenders living in Highland, California as of April 24, 2024 . The ratio of all residents to sex offenders in Highland is 27,676 to 1.The ratio of registered sex offenders to all residents in this city is much lower than the state average.
The City-Data.com crime index weighs serious crimes and violent crimes more heavily. Higher means more crime, U.S. average is 246.1. It adjusts for the number of visitors and daily workers commuting into cities.
- means the value is smaller than the state average.
- means the value is about the same as the state average.
- means the value is bigger than the state average.
- means the value is much bigger than the state average.
Crime rate in Highland detailed stats: murders, rapes, robberies, assaults, burglaries, thefts, arson Officers per 1,000 residents here:
0.02California average:
1.98
Latest news from Highland, CA collected exclusively by city-data.com from local newspapers, TV, and radio stations
Ancestries: Irish (2.8%), English (2.6%), Italian (2.2%), American (2.0%), German (1.5%), African (1.5%).
Current Local Time:
Land area: 13.6 square miles.
Population density: 4,161 people per square mile (average).
13,091 residents are foreign born (16.5% Latin America , 5.5% Asia ).
This city:
22.9%California:
26.5%
Median real estate property taxes paid for housing units with mortgages in 2022: $3,995 (0.8%)Median real estate property taxes paid for housing units with no mortgage in 2022: $2,001 (0.5%)
Nearest city with pop. 50,000+: Redlands, CA
Nearest city with pop. 200,000+: Riverside, CA
Nearest city with pop. 1,000,000+: Los Angeles, CA
Nearest cities:
Latitude: 34.12 N, Longitude: 117.20 W
Daytime population change due to commuting: -14,592 (-25.5%)Workers who live and work in this city: 3,727 (14.5%)
Property values in Highland, CA
Single-family new house construction building permits:
2022: 100 buildings , average cost: $284,1002021: 31 buildings , average cost: $246,6002020: 48 buildings , average cost: $271,6002019: 62 buildings , average cost: $272,4002018: 65 buildings , average cost: $282,5002017: 67 buildings , average cost: $268,9002016: 89 buildings , average cost: $228,0002015: 8 buildings , average cost: $250,5002014: 7 buildings , average cost: $229,9002013: 8 buildings , average cost: $330,1002012: 29 buildings , average cost: $167,4002011: 16 buildings , average cost: $228,2002010: 23 buildings , average cost: $382,8002009: 8 buildings , average cost: $399,0002008: 6 buildings , average cost: $171,8002007: 75 buildings , average cost: $276,4002006: 185 buildings , average cost: $331,0002005: 344 buildings , average cost: $325,0002004: 297 buildings , average cost: $273,2002003: 366 buildings , average cost: $289,6002002: 289 buildings , average cost: $292,0002001: 265 buildings , average cost: $288,4002000: 53 buildings , average cost: $244,2001999: 136 buildings , average cost: $226,7001998: 191 buildings , average cost: $183,9001997: 246 buildings , average cost: $158,500Unemployment in December 2023: Population change in the 1990s: +9,585 (+27.4%).
Most common occupations in Highland, CA (%)
Both Males Females
Building and grounds cleaning and maintenance occupations (5.0%)
Other management occupations, except farmers and farm managers (4.7%)
Other office and administrative support workers, including supervisors (4.3%)
Material recording, scheduling, dispatching, and distributing workers (3.6%)
Other sales and related occupations, including supervisors (3.6%)
Preschool, kindergarten, elementary, and middle school teachers (3.5%)
Other production occupations, including supervisors (3.2%)
Building and grounds cleaning and maintenance occupations (7.1%)
Other management occupations, except farmers and farm managers (5.5%)
Material recording, scheduling, dispatching, and distributing workers (4.8%)
Driver/sales workers and truck drivers (4.8%)
Vehicle and mobile equipment mechanics, installers, and repairers (4.5%)
Other production occupations, including supervisors (4.3%)
Laborers and material movers, hand (3.7%)
Other office and administrative support workers, including supervisors (7.5%)
Preschool, kindergarten, elementary, and middle school teachers (5.8%)
Secretaries and administrative assistants (4.1%)
Other management occupations, except farmers and farm managers (3.8%)
Information and record clerks, except customer service representatives (3.7%)
Other sales and related occupations, including supervisors (3.6%)
Child care workers (3.6%)
Earthquake activity:
Highland-area historical earthquake activity is significantly above California state average. It is 7377% greater than the overall U.S. average. On 6/28/1992 at 11:57:34, a magnitude 7.6 (6.2 MB, 7.6 MS, 7.3 MW, Depth: 0.7 mi, Class: Major, Intensity: VIII - XII) earthquake occurred 38.6 miles away from Highland center, causing 3 deaths ( 1 shaking deaths, 2 other deaths) and 400 injuries, causing $100,000,000 total damage and $40,000,000 insured lossesOn 7/21/1952 at 11:52:14, a magnitude 7.7 (7.7 UK) earthquake occurred 119.2 miles away from the city center, causing $50,000,000 total damage On 10/16/1999 at 09:46:44, a magnitude 7.4 (6.3 MB, 7.4 MS, 7.2 MW, 7.3 ML) earthquake occurred 51.7 miles away from the city center On 6/28/1992 at 15:05:30, a magnitude 6.9 (6.3 MB, 6.7 MS, 6.5 MW, 6.9 ME, Depth: 3.1 mi, Class: Strong, Intensity: VII - IX) earthquake occurred 25.0 miles away from the city center On 5/19/1940 at 04:36:40, a magnitude 7.2 (7.2 UK) earthquake occurred 106.6 miles away from the city center, causing $33,000,000 total damage On 4/21/1918 at 22:32:30, a magnitude 6.8 (6.8 UK) earthquake occurred 25.2 miles away from the city center Magnitude types: body-wave magnitude (MB), energy magnitude (ME), local magnitude (ML), surface-wave magnitude (MS), moment magnitude (MW) Natural disasters: The number of natural disasters in San Bernardino County (46) is a lot greater than the US average (15).Major Disasters (Presidential) Declared: 27Emergencies Declared: 2Fires: 24, Floods: 18, Storms: 9, Winter Storms: 6, Landslides: 5, Mudslides: 4, Heavy Rains: 2, Earthquake: 1, Flash Flood: 1, Freeze: 1, Hurricane: 1, Snow: 1, Tornado: 1, Tropical Storm: 1, Wind: 1, Other: 1 (Note: some incidents may be assigned to more than one category). Hospitals and medical centers in Highland: HIGHLAND PALMS HEALTHCARE CENTER (7534 PALM AVENUE)
SIERRA VISTA (3455 EAST HIGHLAND AVE)
HIGHLAND RANCH DIALYSIS CENTER (7223 CHURCH STREET, SUITE A-14)
Amtrak stations near Highland: 7 miles: SAN BERNADINO (SAN BERNARDINO, 1170 W. 3RD ST.) Services: ticket office, partially wheelchair accessible, public payphones, free short-term parking, free long-term parking.
14 miles: RIVERSIDE (4066 VINE ST.) - Bus Station Services: fully wheelchair accessible, public payphones, full-service food facilities, free short-term parking, free long-term parking, call for car rental service, call for taxi service, public transit connection.
15 miles: MORENO VALLEY (ARCO MINI MART, 2624 E. ALESSANDRO BLVD.) - Bus Station Services: public payphones.
Colleges/universities with over 2000 students nearest to Highland:
University of Redlands (about 5 miles; Redlands, CA ; Full-time enrollment: 4,854)
The Art Institute of California-Argosy University Inland Empire (about 6 miles; San Bernardino, CA ; FT enrollment: 2,238)
Loma Linda University (about 6 miles; Loma Linda, CA ; FT enrollment: 2,839)
San Bernardino Valley College (about 7 miles; San Bernardino, CA ; FT enrollment: 7,444)
Crafton Hills College (about 9 miles; Yucaipa, CA ; FT enrollment: 3,222)
California State University-San Bernardino (about 9 miles; San Bernardino, CA ; FT enrollment: 15,748)
University of California-Riverside (about 13 miles; Riverside, CA ; FT enrollment: 20,647)
Public high schools in Highland:
Biggest public elementary/middle schools in Highland: BEATTIE MIDDLE Students: 1,246, Location: 7800 ORANGE ST., Grades: 6-8)BELVEDERE ELEMENTARY Students: 524, Location: 2501 E. MARSHALL BLVD., Grades: KG-6)LANKERSHIM ELEMENTARY Students: 451, Location: 7499 LANKERSHIM AVE., Grades: KG-6)CRAM ELEMENTARY Students: 441, Location: 29700 WATER ST., Grades: KG-5)ARROYO VERDE ELEMENTARY Students: 378, Location: 7701 CHURCH ST., Grades: KG-5)HIGHLAND GROVE ELEMENTARY Students: 369, Location: 7700 ORANGE ST., Grades: KG-5)OEHL ELEMENTARY Students: 347, Location: 2525 PALM AVE., Grades: KG-6)HIGHLAND PACIFIC ELEMENTARY Students: 206, Location: 3340 PACIFIC ST., Grades: KG-6)CYPRESS ELEMENTARY Location: 26825 CYPRESS ST., Grades: KG-6)
SERRANO MIDDLE Location: 3131 PIEDMONT DR., Grades: 7-8)
Private elementary/middle school in Highland: ST ADELAIDE ELEMENTARY SCHOOL Students: 202, Location: 27487 BASELINE ST, Grades: PK-8)
See full list of schools located in Highland
Notable locations in Highland: (A) , Dudas Golf Range (B) , California Department of Forestry and Fire Protection Station 3 San Bernardino (C) , California Department of Forestry and Fire Protection Station 1 - Highland Fire Department (D) , California Department of Forestry and Fire Protection Station 2 East Highland (E) , Highland City Hall (F) , Highland Branch San Bernardino County Library (G) . Display/hide their locations on the map
Shopping Center: (1) . Display/hide its location on the map
Churches in Highland include: (A) , Saint Adelaide Catholic Church (B) , Highland Hills Church (C) , Living Work Book of Acts Church (D) , Church of God (E) . Display/hide their locations on the map
Reservoirs: (A) , East Highland Reservoir (B) . Display/hide their locations on the map
Creek: (A) . Display/hide its location on the map
Birthplace of: Charles E. Young - University professor, Chris Brazelton - College basketball player (Fresno State Bulldogs), Frank Gabler - Baseball player, Kevin Houston - College basketball player (Long Beach State 49ers), Milt Whitehead - Baseball player.
San Bernardino County has a predicted average indoor radon screening level between 2 and 4 pCi/L (pico curies per liter) - Moderate Potential Average household size: This city:
3.4 peopleCalifornia:
2.9 people
Percentage of family households: This city:
81.1%Whole state:
68.7%
Percentage of households with unmarried partners: This city:
8.0%Whole state:
7.2%
Likely homosexual households (counted as self-reported same-sex unmarried-partner households)
Lesbian couples: 0.5% of all households Gay men: 0.2% of all households
People in group quarters in Highland in 2010:
96 people in nursing facilities/skilled-nursing facilities
45 people in other noninstitutional facilities
23 people in group homes intended for adults
8 people in emergency and transitional shelters (with sleeping facilities) for people experiencing homelessness
People in group quarters in Highland in 2000:
92 people in homes for the mentally retarded
80 people in other noninstitutional group quarters
28 people in homes or halfway houses for drug/alcohol abuse
15 people in other group homes
8 people in nursing homes
6 people in homes for the mentally ill
6 people in homes for the physically handicapped
5 people in other nonhousehold living situations
Banks with branches in Highland (2011 data):
Wells Fargo Bank, National Association: East Highland Branch at 28920 Greenspot Road, branch established on 2007/12/17; Highland Center Branch at 26529 East Highland Avenue, branch established on 1993/08/30. Info updated 2011/04/05: Bank assets: $1,161,490.0 mil, Deposits: $905,653.0 mil, headquarters in Sioux Falls, SD, positive income , 6395 total offices , Holding Company: Wells Fargo & Company
JPMorgan Chase Bank, National Association: Highland Stater Bros. Banking Center at 28988 Greenspot Rd, branch established on 2010/05/04; Boulder Branch at 7195 Boulder Avenue, branch established on 2006/07/10. Info updated 2011/11/10: Bank assets: $1,811,678.0 mil, Deposits: $1,190,738.0 mil, headquarters in Columbus, OH, positive income , International Specialization, 5577 total offices , Holding Company: Jpmorgan Chase & Co.
Citibank, National Association: Highland Branch at 4120 East Highland Avenue, branch established on 1998/09/11. Info updated 2012/01/10: Bank assets: $1,288,658.0 mil, Deposits: $882,541.0 mil, headquarters in Sioux Falls, SD, positive income , International Specialization, 1048 total offices , Holding Company: Citigroup Inc.
Bank of America, National Association: Highland In-Store Branch at 7201 Boulder Avenue, branch established on 1995/08/09. Info updated 2009/11/18: Bank assets: $1,451,969.3 mil, Deposits: $1,077,176.8 mil, headquarters in Charlotte, NC, positive income , 5782 total offices , Holding Company: Bank Of America Corporation
For population 15 years and over in Highland:
Never married: 40.0%Now married: 45.2%Separated: 1.3%Widowed: 4.7%Divorced: 8.9% For population 25 years and over in Highland:
High school or higher: 76.1%Bachelor's degree or higher: 21.3%Graduate or professional degree: 9.4%Unemployed: 10.4%Mean travel time to work (commute): 27.8 minutes
Education Gini index (Inequality in education) Here:
16.9California average:
15.5
Religion statistics for Highland, CA (based on San Bernardino County data)
Religion Adherents Congregations Catholic 445,334 55 Evangelical Protestant 243,524 832 Other 80,047 205 Mainline Protestant 26,062 135 Black Protestant 14,969 37 Orthodox 3,868 10 None 1,221,406 -
Source: Clifford Grammich, Kirk Hadaway, Richard Houseal, Dale E.Jones, Alexei Krindatch, Richie Stanley and Richard H.Taylor. 2012. 2010 U.S.Religion Census: Religious Congregations & Membership Study. Association of Statisticians of American Religious Bodies. Jones, Dale E., et al. 2002. Congregations and Membership in the United States 2000. Nashville, TN: Glenmary Research Center. Graphs represent county-level data
Food Environment Statistics: Number of grocery stores : 301San Bernardino County :
1.50 / 10,000 pop.California :
2.14 / 10,000 pop.
Number of supercenters and club stores : 11San Bernardino County :
0.05 / 10,000 pop.California :
0.04 / 10,000 pop.
Number of convenience stores (no gas) : 114Here :
0.57 / 10,000 pop.California :
0.62 / 10,000 pop.
Number of convenience stores (with gas) : 320San Bernardino County :
1.60 / 10,000 pop.State :
1.49 / 10,000 pop.
Number of full-service restaurants : 940San Bernardino County :
4.69 / 10,000 pop.California :
7.42 / 10,000 pop.
Adult diabetes rate : San Bernardino County :
7.4%State :
7.3%
Adult obesity rate : San Bernardino County :
27.1%State :
21.3%
Low-income preschool obesity rate : San Bernardino County :
16.2%California :
17.9%
Health and Nutrition: Healthy diet rate : Highland:
47.5%California:
49.4%
Average overall health of teeth and gums : This city:
46.3%California:
48.0%
Average BMI : This city:
28.5California:
28.1
People feeling badly about themselves : This city:
21.6%State:
20.2%
People not drinking alcohol at all : Here:
10.8%California:
11.2%
Average hours sleeping at night : Overweight people : This city:
32.5%California:
31.5%
General health condition : Average condition of hearing : Highland:
81.2%California:
80.9%
More about Health and Nutrition of Highland, CA Residents
Local government employment and payroll (March 2022)
Function
Full-time employees
Monthly full-time payroll
Average yearly full-time wage
Part-time employees
Monthly part-time payroll
Streets and Highways
11 $101,005 $110,187 0 $0 Other Government Administration
10 $124,962 $149,954 0 $0 Other and Unallocable
8 $51,128 $76,692 0 $0 Financial Administration
6 $55,997 $111,994 0 $0 Parks and Recreation
2 $12,862 $77,172 0 $0 Housing and Community Development (Local)
0 $0 7 $11,596
Totals for Government
37 $345,954 $112,201 7 $11,596
Highland government finances - Expenditure in 2017 (per resident):
Construction - Regular Highways: $8,437,000 ($148.79)
Housing and Community Development: $2,706,000 ($47.72)Local Fire Protection: $577,000 ($10.18)Current Operations - Police Protection: $8,934,000 ($157.55)
Regular Highways: $3,904,000 ($68.85)Local Fire Protection: $2,617,000 ($46.15)Central Staff Services: $2,515,000 ($44.35)Health - Other: $1,687,000 ($29.75)Protective Inspection and Regulation - Other: $1,488,000 ($26.24)Parks and Recreation: $1,092,000 ($19.26)Housing and Community Development: $690,000 ($12.17)Financial Administration: $520,000 ($9.17)Intergovernmental to Local - Other - Police Protection: $8,342,000 ($147.11)
Other - Health - Other: $349,000 ($6.15)Intergovernmental to State - General - Other: $2,395,000 ($42.24)
Health - Other: $1,185,000 ($20.90)Other Capital Outlay - Police Protection: $37,000 ($0.65)
General - Other: $32,000 ($0.56)Central Staff Services: $2,000 ($0.04)
Highland government finances - Revenue in 2017 (per resident):
Charges - Other: $1,648,000 ($29.06)
Regular Highways: $331,000 ($5.84)Housing and Community Development: $125,000 ($2.20)Parks and Recreation: $2,000 ($0.04)Federal Intergovernmental - Other: $731,000 ($12.89)
Housing and Community Development: $171,000 ($3.02)Local Intergovernmental - Highways: $917,000 ($16.17)
Miscellaneous - Interest Earnings: $658,000 ($11.60)
Fines and Forfeits: $140,000 ($2.47)General Revenue - Other: $120,000 ($2.12)Rents: $100,000 ($1.76)State Intergovernmental - Highways: $1,023,000 ($18.04)
Other: $839,000 ($14.80)General Local Government Support: $94,000 ($1.66)Tax - Property: $11,578,000 ($204.18)
Other: $4,219,000 ($74.40)General Sales and Gross Receipts: $2,871,000 ($50.63)Public Utilities Sales: $1,535,000 ($27.07)Other License: $313,000 ($5.52)Other Selective Sales: $302,000 ($5.33)Occupation and Business License - Other: $173,000 ($3.05)Documentary and Stock Transfer: $138,000 ($2.43)
Highland government finances - Debt in 2017 (per resident):
Long Term Debt - Beginning Outstanding - Public Debt for Private Purpose: $7,076,000 ($124.79)
Outstanding Nonguaranteed - Industrial Revenue: $7,076,000 ($124.79)Beginning Outstanding - Unspecified Public Purpose: $4,415,000 ($77.86)Outstanding Unspecified Public Purpose: $4,160,000 ($73.36)Retired Unspecified Public Purpose: $255,000 ($4.50)
Highland government finances - Cash and Securities in 2017 (per resident):
Bond Funds - Cash and Securities: $24,899,000 ($439.10)
Other Funds - Cash and Securities: $33,314,000 ($587.50)
Sinking Funds - Cash and Securities: $7,076,000 ($124.79)
6.45% of this county's 2021 resident taxpayers lived in other counties in 2020 ($54,954 average adjusted gross income )
Here:
6.45%California average:
5.19%
0.03% of residents moved from foreign countries ($259 average AGI )San Bernardino County:
0.03%California average:
0.03%
Top counties from which taxpayers relocated into this county between 2020 and 2021:
6.46% of this county's 2020 resident taxpayers moved to other counties in 2021 ($59,647 average adjusted gross income )
Here:
6.46%California average:
6.14%
0.03% of residents moved to foreign countries ($253 average AGI )San Bernardino County:
0.03%California average:
0.02%
Top counties to which taxpayers relocated from this county between 2020 and 2021:
Businesses in Highland, CA
Name Count Name Count
AT&T 1 Knights Inn 1 Albertsons 1 Kroger 1 Applebee's 1 LA Fitness 1 AutoZone 1 Little Caesars Pizza 1 Baskin-Robbins 1 Lowe's 1 Blockbuster 1 McDonald's 2 Burger King 1 Nike 1 CVS 2 Payless 1 Carl\s Jr. 1 Pizza Hut 1 Cold Stone Creamery 1 Popeyes 1 Curves 1 Quiznos 1 Dairy Queen 1 RadioShack 1 Domino's Pizza 1 Staples 1 FedEx 4 Starbucks 1 GNC 1 Subway 4 GameStop 1 T-Mobile 2 Goodwill 2 Taco Bell 2 H&R Block 1 U-Haul 2 Hilton 1 UPS 3 IHOP 1 Walgreens 1 Jack In The Box 1 Walmart 1 Jones New York 1 Wendy's 1 KFC 1 YMCA 1
Strongest AM radio stations in Highland:
KKDD (1290 AM; 5 kW; SAN BERNARDINO, CA; Owner: AMFM RADIO LICENSES, L.L.C.)
KCAL (1410 AM; 5 kW; REDLANDS, CA; Owner: LAZER BROADCASTING CORPORATION)
KTDD (1350 AM; 5 kW; SAN BERNARDINO, CA)
KHPY (1670 AM; 10 kW; MORENO VALLEY, CA; Owner: DELBERT L. VAN VOORHIS)
KPLS (830 AM; 50 kW; ORANGE, CA; Owner: CRN LICENSES, LLC)
KRLH (590 AM; 2 kW; SAN BERNARDINO, CA; Owner: CARON BROADCASTING, INC.)
KLAC (570 AM; 50 kW; LOS ANGELES, CA; Owner: AMFM RADIO LICENSES, L.L.C.)
KFI (640 AM; 50 kW; LOS ANGELES, CA; Owner: CAPSTAR TX LIMITED PARTNERSHIP)
KTNQ (1020 AM; 50 kW; LOS ANGELES, CA; Owner: KTNQ-AM LICENSE CORP.)
KDIS (1110 AM; 50 kW; PASADENA, CA; Owner: ABC,INC.)
KXTA (1150 AM; 50 kW; LOS ANGELES, CA; Owner: CITICASTERS LICENSES, L.P.)
KEZY (1240 AM; 1 kW; SAN BERNARDINO, CA; Owner: HI-FAVOR BROADCASTING, LLC)
KFWB (980 AM; 50 kW; LOS ANGELES, CA; Owner: INFINITY BROADCASTING OPERATIONS, INC.)
Strongest FM radio stations in Highland:
KUOR-FM (89.1 FM; REDLANDS, CA; Owner: UNIVERSITY OF REDLANDS)
KCXX (103.9 FM; LAKE ARROWHEAD, CA; Owner: ALL-PRO BROADCASTING, INC.)
KGGI (99.1 FM; RIVERSIDE, CA; Owner: AMFM RADIO LICENSES, L.L.C.)
KLYY (97.5 FM; RIVERSIDE, CA; Owner: ENTRAVISION HOLDINGS, LLC)
K201CD (88.1 FM; VICTORVILLE, CA; Owner: SAN BERNARDINO COMMNTY COLLEGE DIST.)
KLRD (90.1 FM; YUCAIPA, CA; Owner: EDUCATIONAL MEDIA FOUNDATION)
K295AI (106.9 FM; MUSCOY, CA; Owner: ASSOCIATION FOR COMMUNITY EDUCATION, INC.)
KOLA (99.9 FM; SAN BERNARDINO, CA; Owner: INLAND EMPIRE BROADCASTING CORP.)
KVCR (91.9 FM; SAN BERNARDINO, CA; Owner: SAN BERNARDINO COMMUNITY COLLEGE DISTRICT)
KUCR (88.3 FM; RIVERSIDE, CA; Owner: THE REGENTS OF THE UNIV. OF CA)
K201AR (88.1 FM; BANNING, CA; Owner: KSGN, INC.)
K232CX (94.3 FM; DESERT HOT SPRINGS, CA; Owner: MCC RADIO, LLC)
KFRG (95.1 FM; SAN BERNARDINO, CA; Owner: INFINITY RADIO OPERATIONS INC.)
KCAL-FM (96.7 FM; REDLANDS, CA; Owner: SBR BROADCASTING CORPORATION)
KXSB (101.7 FM; BIG BEAR LAKE, CA; Owner: LAZER BROADCASTING CORPORATION)
K264AF (100.7 FM; GUASTI, CA; Owner: EDUCATIONAL MEDIA FOUNDATION)
KWRP (96.1 FM; SAN JACINTO, CA; Owner: MAGIC BROADCASTING, INC.)
KSGN (89.7 FM; RIVERSIDE, CA; Owner: KSGN, INC.)
KPLM-FM2 (106.1 FM; SAN JACINTO, CA; Owner: RM BROADCASTING L.L.C.)
KRTM (88.9 FM; TEMECULA, CA; Owner: PENFOLD COMMUNICATIONS, INC.)
TV broadcast stations around Highland:
KHIZ (Channel 64; BARSTOW, CA; Owner: SUNBELT TELEVISION, INC.)
KTRO-LP (Channel 50; LANCASTER, CA; Owner: ROBERT D. ADELMAN)
KVCR-TV (Channel 24; SAN BERNARDINO, CA; Owner: SAN BERNARDINO COMMUNITY COLLEGE DISTRICT)
KSGA-LP (Channel 59; SANTA BARBARA, CA; Owner: KJLA, LLC)
KTBN1 (Channel 40; LAKE ARROWHEAD, CA; Owner: TRINITY BROADCASTING NETWORK)
KBLM-LP (Channel 25; RIVERSIDE/PERRIS, CA; Owner: LOUIS MARTINEZ FAMILY GROUP, LLC)
National Bridge Inventory (NBI) Statistics 41 Number of bridges571ft / 174m Total length1,061,125 Total average daily traffic58,136 Total average daily truck traffic
New bridges - historical statistics
1 1910-1919 2 1930-1939 3 1940-1949 1 1960-1969 2 1970-1979 3 1980-1989 25 1990-1999 1 2000-2009 3 2010-2019
See full National Bridge Inventory statistics for Highland, CA
Home Mortgage Disclosure Act Aggregated Statistics For Year 2009(Based on 1 full and 8 partial tracts) A) FHA, FSA/RHS & VA B) Conventional C) Refinancings D) Home Improvement Loans F) Non-occupant Loans on G) Loans On Manufactured Number Average Value Number Average Value Number Average Value Number Average Value Number Average Value Number Average Value
LOANS ORIGINATED 227 $180,943 156 $160,006 335 $219,534 20 $111,666 63 $110,977 6 $43,158 APPLICATIONS APPROVED, NOT ACCEPTED 16 $154,326 17 $190,922 46 $256,944 4 $21,370 5 $151,814 3 $36,477 APPLICATIONS DENIED 47 $149,882 37 $170,841 184 $228,444 16 $69,782 21 $132,531 3 $111,333 APPLICATIONS WITHDRAWN 44 $182,745 27 $149,470 120 $225,839 7 $49,774 16 $122,104 1 $36,790 FILES CLOSED FOR INCOMPLETENESS 7 $194,440 8 $145,141 28 $245,459 4 $62,682 10 $157,472 0 $0
Aggregated Statistics For Year 2008(Based on 1 full and 8 partial tracts) A) FHA, FSA/RHS & VA B) Conventional C) Refinancings D) Home Improvement Loans E) Loans on Dwellings For 5+ Families F) Non-occupant Loans on G) Loans On Manufactured Number Average Value Number Average Value Number Average Value Number Average Value Number Average Value Number Average Value Number Average Value
LOANS ORIGINATED 135 $231,817 176 $209,961 326 $224,065 44 $110,179 0 $0 67 $161,797 14 $57,269 APPLICATIONS APPROVED, NOT ACCEPTED 14 $242,861 60 $190,545 102 $237,772 11 $50,291 1 $1,092,970 20 $151,934 14 $60,310 APPLICATIONS DENIED 44 $206,580 86 $229,555 452 $248,925 87 $136,387 0 $0 62 $152,348 14 $50,100 APPLICATIONS WITHDRAWN 22 $222,081 48 $207,776 151 $241,605 12 $114,064 0 $0 22 $183,232 1 $65,090 FILES CLOSED FOR INCOMPLETENESS 4 $250,512 15 $220,964 37 $214,697 2 $130,585 0 $0 9 $127,276 0 $0
Aggregated Statistics For Year 2007(Based on 1 full and 8 partial tracts) A) FHA, FSA/RHS & VA B) Conventional C) Refinancings D) Home Improvement Loans E) Loans on Dwellings For 5+ Families F) Non-occupant Loans on G) Loans On Manufactured Number Average Value Number Average Value Number Average Value Number Average Value Number Average Value Number Average Value Number Average Value
LOANS ORIGINATED 6 $266,937 411 $253,067 1,052 $240,884 175 $127,105 7 $2,911,530 159 $209,520 13 $68,422 APPLICATIONS APPROVED, NOT ACCEPTED 1 $381,810 152 $257,329 294 $240,842 44 $115,382 0 $0 41 $248,788 16 $77,629 APPLICATIONS DENIED 1 $196,810 292 $248,177 851 $274,055 171 $145,062 1 $510,510 124 $206,151 17 $50,665 APPLICATIONS WITHDRAWN 3 $207,660 112 $270,884 344 $270,377 41 $178,062 2 $333,390 37 $229,363 1 $147,780 FILES CLOSED FOR INCOMPLETENESS 0 $0 44 $251,574 139 $301,430 10 $182,390 0 $0 13 $250,432 0 $0
Aggregated Statistics For Year 2006(Based on 1 full and 8 partial tracts) A) FHA, FSA/RHS & VA B) Conventional C) Refinancings D) Home Improvement Loans E) Loans on Dwellings For 5+ Families F) Non-occupant Loans on G) Loans On Manufactured Number Average Value Number Average Value Number Average Value Number Average Value Number Average Value Number Average Value Number Average Value
LOANS ORIGINATED 11 $218,991 1,230 $227,004 1,679 $237,048 376 $123,673 7 $2,149,581 261 $197,458 7 $80,281 APPLICATIONS APPROVED, NOT ACCEPTED 0 $0 336 $247,773 379 $238,244 79 $158,707 0 $0 62 $191,590 17 $62,008 APPLICATIONS DENIED 3 $260,310 530 $202,874 917 $260,220 229 $127,611 0 $0 107 $233,360 19 $57,939 APPLICATIONS WITHDRAWN 1 $294,000 271 $224,898 650 $263,853 82 $204,996 0 $0 73 $203,896 3 $307,477 FILES CLOSED FOR INCOMPLETENESS 2 $171,430 69 $236,474 159 $272,903 8 $278,718 0 $0 19 $229,004 0 $0
Aggregated Statistics For Year 2005(Based on 1 full and 8 partial tracts) A) FHA, FSA/RHS & VA B) Conventional C) Refinancings D) Home Improvement Loans E) Loans on Dwellings For 5+ Families F) Non-occupant Loans on G) Loans On Manufactured Number Average Value Number Average Value Number Average Value Number Average Value Number Average Value Number Average Value Number Average Value
LOANS ORIGINATED 16 $209,041 1,399 $204,156 2,137 $211,278 273 $145,276 9 $978,786 311 $177,884 7 $115,931 APPLICATIONS APPROVED, NOT ACCEPTED 3 $236,737 291 $186,124 382 $209,249 52 $87,543 0 $0 72 $185,669 32 $63,346 APPLICATIONS DENIED 8 $173,168 543 $181,914 756 $223,644 191 $121,432 1 $341,460 109 $190,233 25 $61,055 APPLICATIONS WITHDRAWN 2 $227,965 326 $199,773 744 $219,980 100 $160,542 1 $462,950 84 $182,028 5 $96,386 FILES CLOSED FOR INCOMPLETENESS 0 $0 68 $197,197 257 $208,488 9 $111,707 0 $0 19 $171,328 0 $0
Aggregated Statistics For Year 2004(Based on 1 full and 8 partial tracts) A) FHA, FSA/RHS & VA B) Conventional C) Refinancings D) Home Improvement Loans E) Loans on Dwellings For 5+ Families F) Non-occupant Loans on G) Loans On Manufactured Number Average Value Number Average Value Number Average Value Number Average Value Number Average Value Number Average Value Number Average Value
LOANS ORIGINATED 69 $165,869 1,260 $174,851 2,215 $174,835 245 $117,712 9 $1,319,616 292 $146,868 6 $59,972 APPLICATIONS APPROVED, NOT ACCEPTED 13 $178,378 270 $176,232 393 $167,021 50 $117,255 0 $0 54 $133,183 17 $44,804 APPLICATIONS DENIED 13 $162,905 344 $152,298 798 $166,297 170 $88,086 2 $544,380 88 $128,732 27 $48,449 APPLICATIONS WITHDRAWN 10 $145,968 218 $187,576 645 $170,511 92 $120,766 0 $0 43 $155,055 2 $135,260 FILES CLOSED FOR INCOMPLETENESS 1 $156,870 32 $171,558 229 $181,723 18 $92,667 0 $0 11 $155,202 0 $0
Aggregated Statistics For Year 2003(Based on 1 full and 8 partial tracts) A) FHA, FSA/RHS & VA B) Conventional C) Refinancings D) Home Improvement Loans E) Loans on Dwellings For 5+ Families F) Non-occupant Loans on Number Average Value Number Average Value Number Average Value Number Average Value Number Average Value Number Average Value
LOANS ORIGINATED 159 $137,794 1,019 $154,594 2,552 $144,312 92 $53,681 10 $769,350 239 $105,541 APPLICATIONS APPROVED, NOT ACCEPTED 15 $121,096 200 $157,797 431 $144,204 25 $46,932 0 $0 60 $109,768 APPLICATIONS DENIED 30 $140,499 270 $123,924 763 $135,760 86 $47,570 2 $334,860 90 $105,745 APPLICATIONS WITHDRAWN 29 $136,992 153 $140,702 589 $149,705 35 $71,092 2 $688,845 34 $102,854 FILES CLOSED FOR INCOMPLETENESS 9 $122,901 41 $161,611 132 $141,217 5 $44,238 0 $0 11 $94,651
Aggregated Statistics For Year 2002(Based on 1 full and 2 partial tracts) A) FHA, FSA/RHS & VA B) Conventional C) Refinancings D) Home Improvement Loans E) Loans on Dwellings For 5+ Families F) Non-occupant Loans on Number Average Value Number Average Value Number Average Value Number Average Value Number Average Value Number Average Value
LOANS ORIGINATED 187 $112,616 313 $102,483 563 $99,172 38 $27,634 5 $1,988,828 100 $80,904 APPLICATIONS APPROVED, NOT ACCEPTED 24 $116,174 61 $85,210 117 $92,101 11 $30,688 1 $123,180 15 $66,815 APPLICATIONS DENIED 19 $112,362 90 $84,864 291 $90,981 46 $15,953 0 $0 42 $77,589 APPLICATIONS WITHDRAWN 31 $118,119 34 $101,349 221 $103,528 21 $26,154 0 $0 23 $90,934 FILES CLOSED FOR INCOMPLETENESS 9 $116,160 11 $87,199 70 $103,612 1 $8,300 0 $0 1 $192,830
Aggregated Statistics For Year 2001(Based on 1 full and 2 partial tracts) A) FHA, FSA/RHS & VA B) Conventional C) Refinancings D) Home Improvement Loans E) Loans on Dwellings For 5+ Families F) Non-occupant Loans on Number Average Value Number Average Value Number Average Value Number Average Value Number Average Value Number Average Value
LOANS ORIGINATED 195 $102,746 162 $81,963 397 $90,002 23 $15,297 4 $453,668 73 $82,686 APPLICATIONS APPROVED, NOT ACCEPTED 15 $92,436 21 $90,054 48 $99,486 5 $9,860 1 $125,000 6 $80,213 APPLICATIONS DENIED 32 $117,932 86 $62,732 236 $81,326 76 $15,353 1 $131,980 32 $85,416 APPLICATIONS WITHDRAWN 25 $105,976 40 $96,030 144 $96,045 23 $22,502 0 $0 21 $84,842 FILES CLOSED FOR INCOMPLETENESS 3 $104,930 3 $75,217 39 $87,861 3 $21,440 2 $2,623,000 3 $87,333
Aggregated Statistics For Year 2000(Based on 1 full and 2 partial tracts) A) FHA, FSA/RHS & VA B) Conventional C) Refinancings D) Home Improvement Loans E) Loans on Dwellings For 5+ Families F) Non-occupant Loans on Number Average Value Number Average Value Number Average Value Number Average Value Number Average Value Number Average Value
LOANS ORIGINATED 173 $96,190 129 $66,513 106 $72,868 33 $27,514 2 $688,885 34 $71,162 APPLICATIONS APPROVED, NOT ACCEPTED 19 $112,853 20 $81,539 43 $64,705 15 $25,578 0 $0 7 $87,544 APPLICATIONS DENIED 34 $92,115 88 $67,446 189 $62,843 47 $19,569 1 $927,500 25 $72,064 APPLICATIONS WITHDRAWN 25 $89,103 26 $88,930 65 $66,112 11 $22,031 0 $0 8 $84,164 FILES CLOSED FOR INCOMPLETENESS 9 $118,670 7 $89,283 32 $82,343 0 $0 0 $0 9 $74,878
Aggregated Statistics For Year 1999(Based on 7 partial tracts) A) FHA, FSA/RHS & VA B) Conventional C) Refinancings D) Home Improvement Loans E) Loans on Dwellings For 5+ Families F) Non-occupant Loans on Number Average Value Number Average Value Number Average Value Number Average Value Number Average Value Number Average Value
LOANS ORIGINATED 304 $105,391 245 $112,286 421 $95,588 85 $26,786 9 $644,276 58 $70,377 APPLICATIONS APPROVED, NOT ACCEPTED 21 $112,578 32 $90,341 101 $93,880 43 $26,563 1 $1,508,690 14 $72,838 APPLICATIONS DENIED 35 $102,694 106 $94,185 366 $76,323 103 $23,367 5 $117,296 37 $81,245 APPLICATIONS WITHDRAWN 51 $102,516 59 $120,218 194 $92,178 9 $31,177 3 $867,277 18 $84,874 FILES CLOSED FOR INCOMPLETENESS 7 $80,301 6 $95,618 62 $99,391 1 $18,380 1 $614,800 8 $74,578
Detailed mortgage data for all 9 tracts in Highland, CA
Private Mortgage Insurance Companies Aggregated Statistics For Year 2009(Based on 1 full and 7 partial tracts) A) Conventional B) Refinancings Number Average Value Number Average Value
LOANS ORIGINATED 19 $237,485 5 $173,326 APPLICATIONS APPROVED, NOT ACCEPTED 12 $266,709 10 $331,344 APPLICATIONS DENIED 2 $181,970 2 $110,455 APPLICATIONS WITHDRAWN 5 $188,450 0 $0 FILES CLOSED FOR INCOMPLETENESS 1 $346,200 1 $263,650
Aggregated Statistics For Year 2008(Based on 1 full and 8 partial tracts) A) Conventional B) Refinancings C) Non-occupant Loans on Number Average Value Number Average Value Number Average Value
LOANS ORIGINATED 57 $263,628 30 $293,067 6 $165,940 APPLICATIONS APPROVED, NOT ACCEPTED 50 $297,288 30 $294,125 5 $213,642 APPLICATIONS DENIED 12 $230,681 4 $267,178 4 $208,418 APPLICATIONS WITHDRAWN 10 $255,533 4 $279,240 3 $216,730 FILES CLOSED FOR INCOMPLETENESS 3 $193,797 2 $255,335 0 $0
Aggregated Statistics For Year 2007(Based on 1 full and 8 partial tracts) A) Conventional B) Refinancings C) Non-occupant Loans on Number Average Value Number Average Value Number Average Value
LOANS ORIGINATED 74 $271,641 68 $324,131 11 $205,437 APPLICATIONS APPROVED, NOT ACCEPTED 16 $306,919 24 $327,487 1 $434,050 APPLICATIONS DENIED 5 $247,448 5 $346,744 3 $290,730 APPLICATIONS WITHDRAWN 6 $345,290 3 $306,503 0 $0 FILES CLOSED FOR INCOMPLETENESS 1 $70,550 2 $336,580 0 $0
Aggregated Statistics For Year 2006(Based on 1 full and 8 partial tracts) A) Conventional B) Refinancings Number Average Value Number Average Value
LOANS ORIGINATED 23 $338,848 40 $319,096 APPLICATIONS APPROVED, NOT ACCEPTED 7 $416,979 11 $361,403 APPLICATIONS DENIED 0 $0 1 $217,490 APPLICATIONS WITHDRAWN 2 $392,625 0 $0 FILES CLOSED FOR INCOMPLETENESS 0 $0 0 $0
Aggregated Statistics For Year 2005(Based on 1 full and 8 partial tracts) A) Conventional B) Refinancings C) Non-occupant Loans on Number Average Value Number Average Value Number Average Value
LOANS ORIGINATED 43 $270,354 42 $259,755 7 $153,246 APPLICATIONS APPROVED, NOT ACCEPTED 6 $300,588 12 $280,929 1 $254,900 APPLICATIONS DENIED 0 $0 2 $243,105 0 $0 APPLICATIONS WITHDRAWN 1 $345,710 6 $324,203 1 $210,020 FILES CLOSED FOR INCOMPLETENESS 0 $0 0 $0 0 $0
Aggregated Statistics For Year 2004(Based on 1 full and 8 partial tracts) A) Conventional B) Refinancings C) Non-occupant Loans on Number Average Value Number Average Value Number Average Value
LOANS ORIGINATED 115 $191,637 50 $204,262 15 $158,200 APPLICATIONS APPROVED, NOT ACCEPTED 25 $210,485 34 $194,416 7 $121,997 APPLICATIONS DENIED 1 $232,630 3 $188,260 0 $0 APPLICATIONS WITHDRAWN 9 $263,429 4 $145,408 3 $190,517 FILES CLOSED FOR INCOMPLETENESS 4 $306,795 1 $196,810 0 $0
Aggregated Statistics For Year 2003(Based on 1 full and 8 partial tracts) A) Conventional B) Refinancings C) Non-occupant Loans on Number Average Value Number Average Value Number Average Value
LOANS ORIGINATED 187 $180,282 178 $169,238 30 $114,131 APPLICATIONS APPROVED, NOT ACCEPTED 33 $147,739 53 $175,461 2 $109,645 APPLICATIONS DENIED 5 $70,616 2 $178,105 3 $61,227 APPLICATIONS WITHDRAWN 4 $172,678 7 $156,003 0 $0 FILES CLOSED FOR INCOMPLETENESS 0 $0 1 $318,120 1 $147,760
Aggregated Statistics For Year 2002(Based on 1 full and 2 partial tracts) A) Conventional B) Refinancings C) Non-occupant Loans on Number Average Value Number Average Value Number Average Value
LOANS ORIGINATED 73 $121,412 79 $127,078 12 $88,598 APPLICATIONS APPROVED, NOT ACCEPTED 16 $125,717 13 $127,052 2 $86,500 APPLICATIONS DENIED 4 $101,570 1 $119,530 2 $92,560 APPLICATIONS WITHDRAWN 3 $134,600 5 $108,654 0 $0 FILES CLOSED FOR INCOMPLETENESS 0 $0 0 $0 0 $0
Aggregated Statistics For Year 2001(Based on 1 full and 2 partial tracts) A) Conventional B) Refinancings C) Non-occupant Loans on Number Average Value Number Average Value Number Average Value
LOANS ORIGINATED 37 $102,604 33 $115,832 4 $86,935 APPLICATIONS APPROVED, NOT ACCEPTED 11 $91,656 12 $115,058 0 $0 APPLICATIONS DENIED 2 $64,000 1 $118,700 2 $64,000 APPLICATIONS WITHDRAWN 4 $131,578 1 $110,000 1 $18,260 FILES CLOSED FOR INCOMPLETENESS 1 $49,120 1 $102,000 0 $0
Aggregated Statistics For Year 2000(Based on 1 full and 2 partial tracts) A) Conventional B) Refinancings C) Non-occupant Loans on Number Average Value Number Average Value Number Average Value
LOANS ORIGINATED 28 $97,291 8 $103,909 2 $152,360 APPLICATIONS APPROVED, NOT ACCEPTED 7 $81,924 1 $46,920 1 $45,460 APPLICATIONS DENIED 1 $95,320 0 $0 1 $52,790 APPLICATIONS WITHDRAWN 3 $81,657 0 $0 0 $0 FILES CLOSED FOR INCOMPLETENESS 0 $0 0 $0 0 $0
Aggregated Statistics For Year 1999(Based on 7 partial tracts) A) Conventional B) Refinancings C) Non-occupant Loans on Number Average Value Number Average Value Number Average Value
LOANS ORIGINATED 82 $150,515 65 $134,593 5 $90,152 APPLICATIONS APPROVED, NOT ACCEPTED 5 $154,816 12 $131,202 1 $57,890 APPLICATIONS DENIED 3 $141,387 1 $96,470 1 $114,270 APPLICATIONS WITHDRAWN 1 $140,310 1 $74,990 0 $0 FILES CLOSED FOR INCOMPLETENESS 1 $71,730 1 $103,820 0 $0
Fire-safe hotels and motels in Highland, California:
Knights Inn Highland, 26667 Highland Ave, Highland, California 92346 Phone: (909) 864-0100, Fax: (909) 363-0091
Hampton Inn & Suites - Highland @ San Manuel Village, 27959 Highland Ave, Highland, California 92346 Phone: (909) 862-8000, Fax: (909) 862-8100
All 2 fire-safe hotels and motels in Highland, California
Most common first names in Highland, CA among deceased individuals Name Count Lived (average)
Mary 159 78.3 years William 145 72.2 years Robert 139 70.3 years John 138 73.2 years James 108 71.0 years Charles 89 74.6 years Dorothy 88 77.5 years George 81 74.3 years Richard 70 68.9 years Helen 64 78.5 years
Most common last names in Highland, CA among deceased individuals Last name Count Lived (average)
Smith 71 75.2 years Johnson 60 73.1 years Williams 48 74.4 years Miller 40 76.9 years Jones 39 76.2 years Brown 36 78.8 years Wilson 30 74.8 years Walker 26 75.4 years Taylor 24 74.2 years Davis 24 69.3 years
Highland compared to California state average:
Hispanic race population percentage above state average. Length of stay since moving in significantly above state average.
#15 on the list of "Top 101 cities with largest percentage of males in industries: retail trade (population 50,000+)"
#39 on the list of "Top 101 cities with largest percentage of females in occupations: transportation occupations (population 50,000+)"
#48 on the list of "Top 101 cities that people commute from (largest negative percentage daily daytime population change due to commuting) (population 50,000+)"
#51 on the list of "Top 101 larger cities with the highest increase in house/condo value from 2000 (population 50,000+)"
#58 on the list of "Top 101 cities with the highest ratio of murders to rapes between 2002 and 2012 (population 50,000+)"
#59 on the list of "Top 101 cities with the most users submitting photos to our site per 10,000 residents (population 50,000+)"
#63 on the list of "Top 101 cities with largest percentage of males in occupations: farming, fishing, and forestry occupations (population 50,000+)"
#64 on the list of "Top 101 cities with largest percentage of males in industries: utilities (population 50,000+)"
#66 on the list of "Top 101 cities with the smallest sunshine amount differences during a year (population 50,000+)"
#75 on the list of "Top 101 cities with the largest city-data.com crime index increase from 2011 to 2012 (population 50,000+)"
#77 on the list of "Top 101 cities with largest percentage of females in industries: administrative and support and waste management services (population 50,000+)"
#78 on the list of "Top 101 cities with the lowest number of rapes per 100,000 residents (population 50,000+)"
#79 on the list of "Top 101 cities with the most cars per house, population 50,000+"
#81 on the list of "Top 101 cities with the most residents born in Indonesia (population 500+)"
#83 on the list of "Top 101 cities with largest percentage of females in industries: public administration (population 50,000+)"
#84 on the list of "Top 101 cities with largest percentage of males in occupations: transportation occupations (population 50,000+)"
#86 on the list of "Top 101 cities with largest percentage of females in occupations: building and grounds cleaning and maintenance occupations (population 50,000+)"
#86 on the list of "Top 101 cities with largest percentage of males in industries: agriculture, forestry, fishing and hunting (population 50,000+)"
#88 on the list of "Top 101 cities with the lowest number of thefts per 100,000 residents (population 50,000+)"
#90 on the list of "Top 101 cities with the largest differences between daily high and daily low temperatures (population 50,000+)"
#5 on the list of "Top 101 counties with the highest Nitrogen Dioxide air pollution readings in 2012 (ppm)"
#5 on the list of "Top 101 counties with the highest ground withdrawal of fresh water for public supply"
#10 on the list of "Top 101 counties with the most Evangelical Protestant congregations"
#14 on the list of "Top 101 counties with the highest total withdrawal of fresh water for public supply"
#15 on the list of "Top 101 counties with the most Evangelical Protestant adherents (pop. 50,000+)"
Top Patent Applicants
Aladar A. Szalay (34)
Themis Katsianos (14)
Di Li (11)
David John Smith (10)
David L. Chandler (5)
Ricardo A. Hylton (3)
William Grier (3)
Christopher L. Oelrich (3)
Jared Olivo (3)
Aladar Szalay (3)
Total of 122 patent applications in 2008-2024.


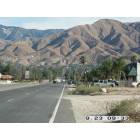
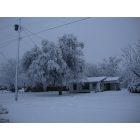
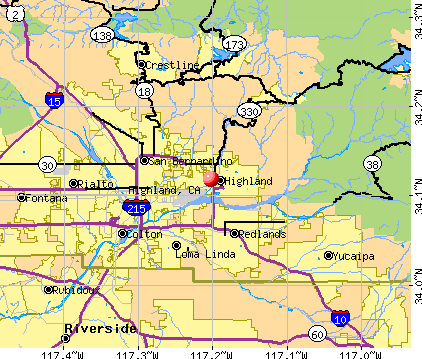


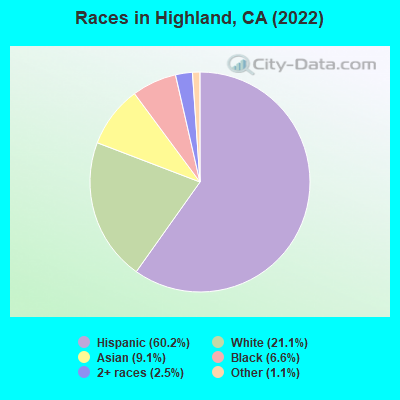
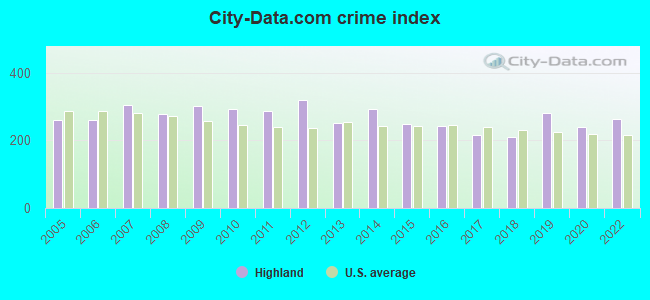
 Recent articles from our blog. Our writers, many of them Ph.D. graduates or candidates, create easy-to-read articles on a wide variety of topics.

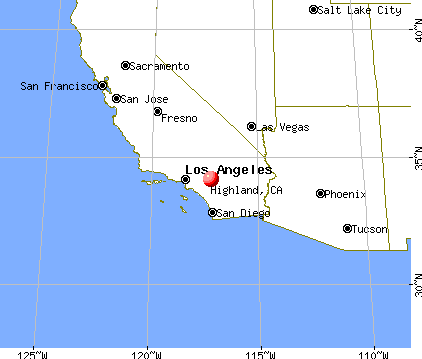
 (4.6 miles
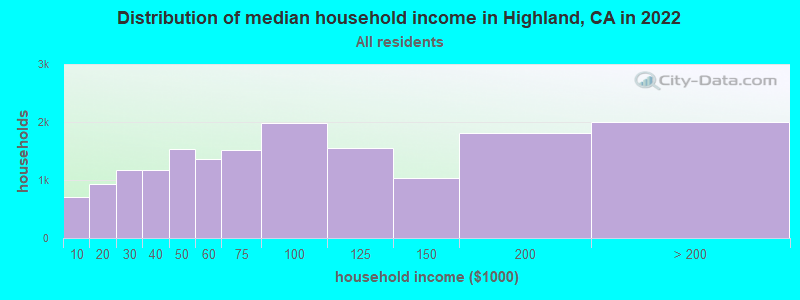
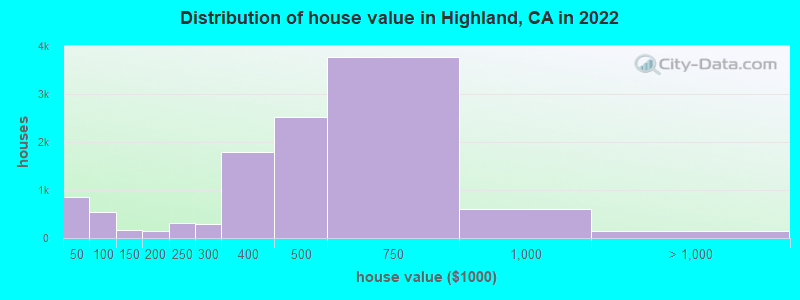
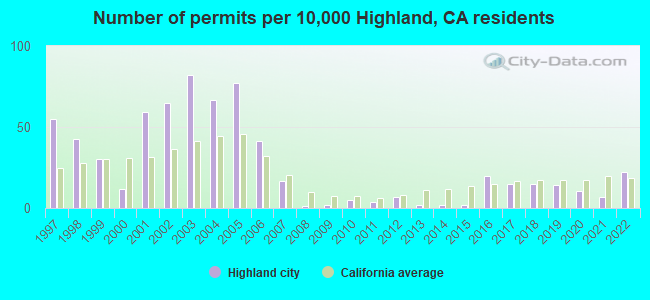
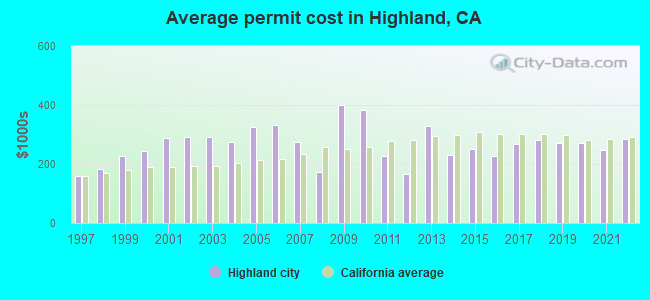
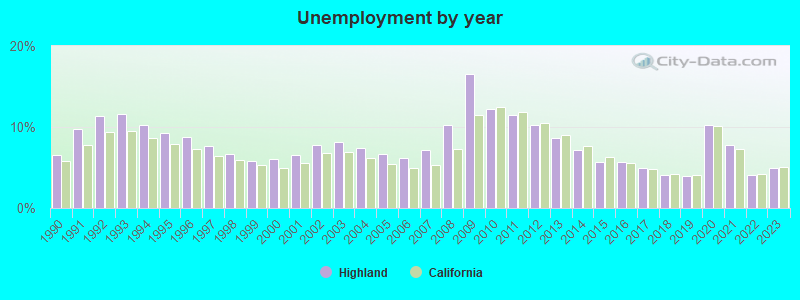
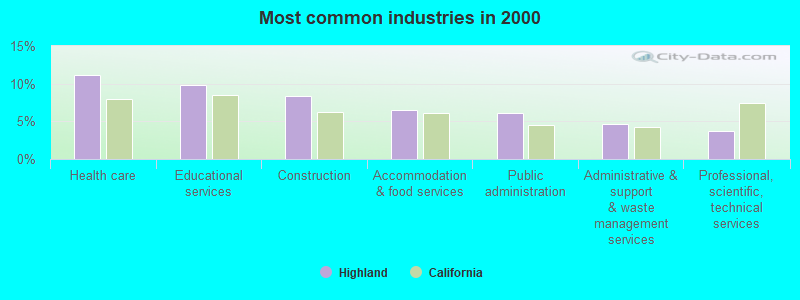
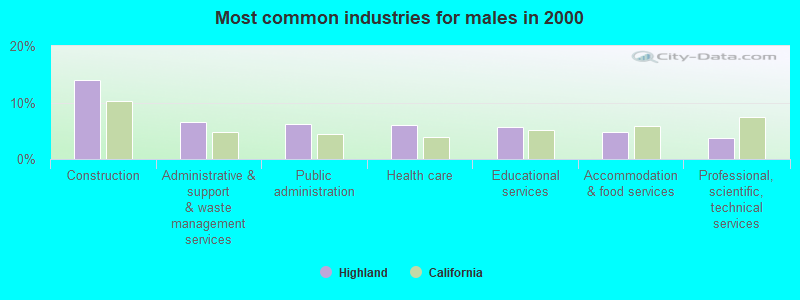
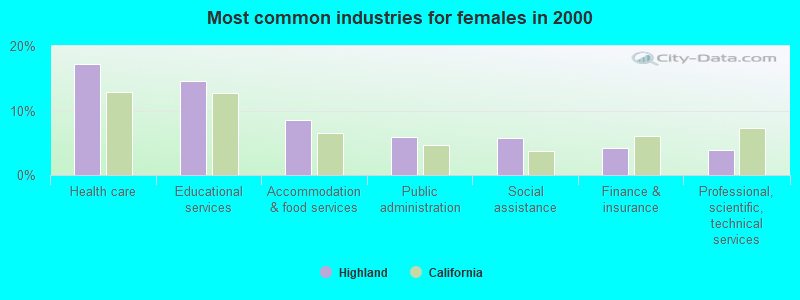
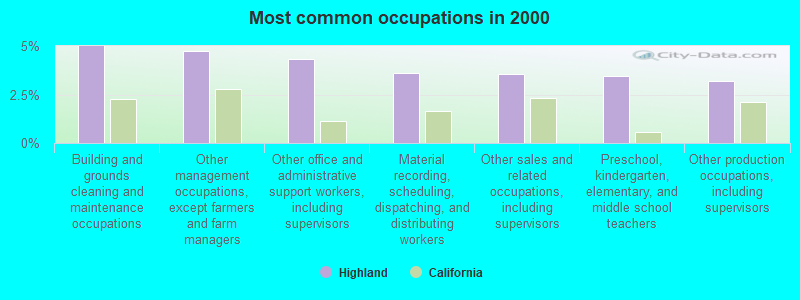
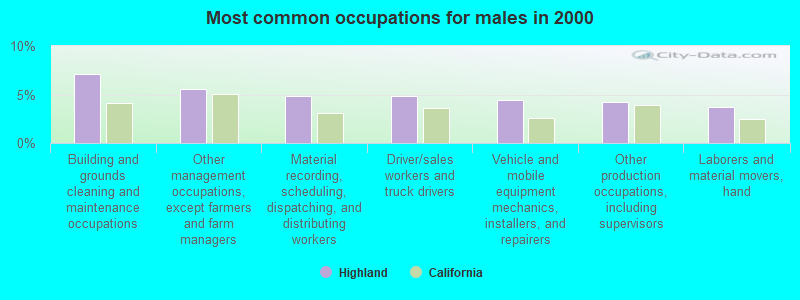
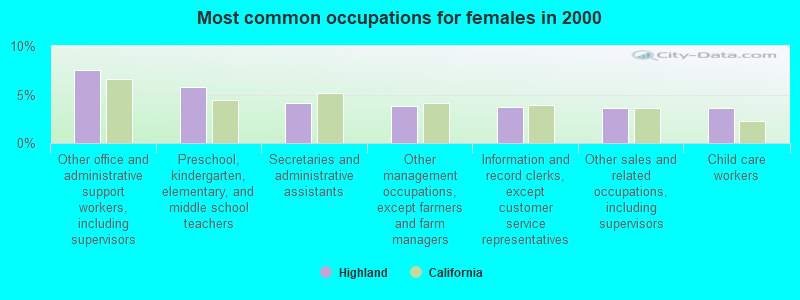
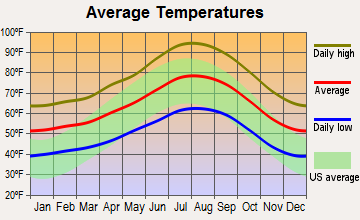
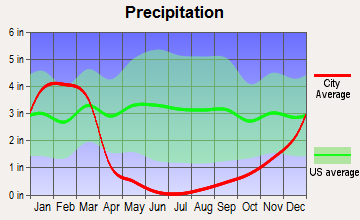
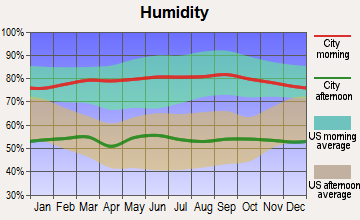
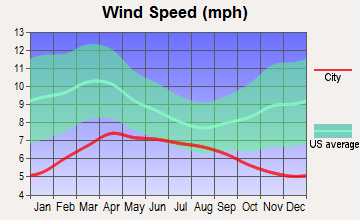
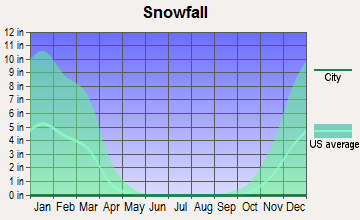
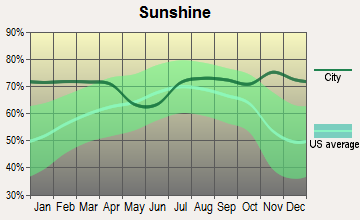
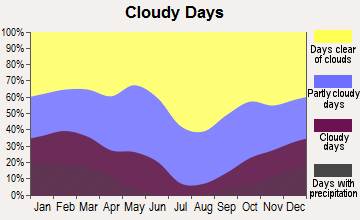
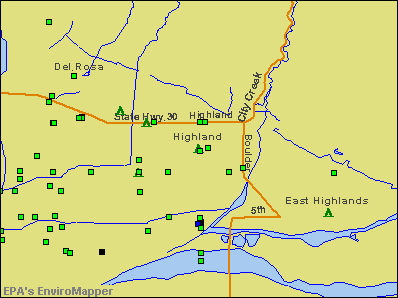

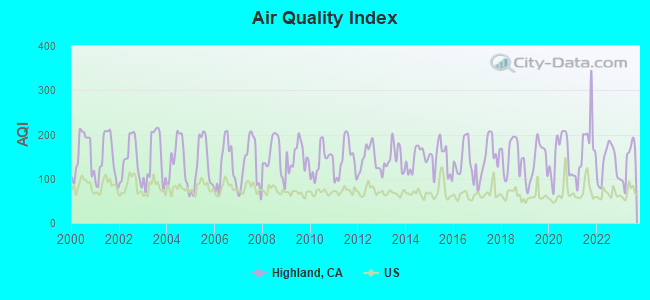
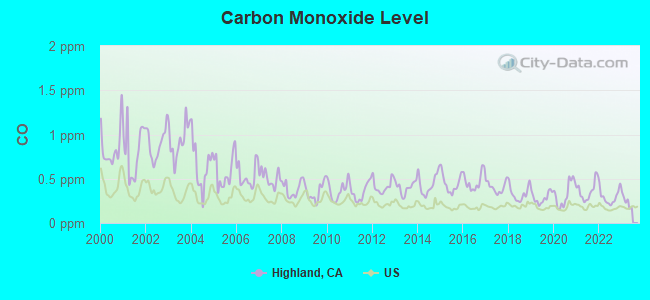
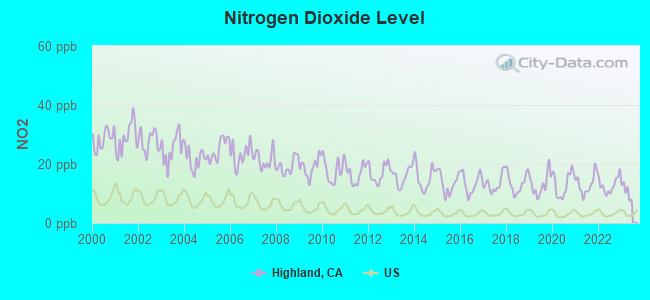
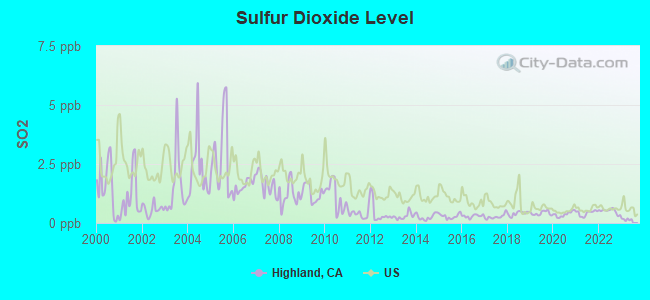
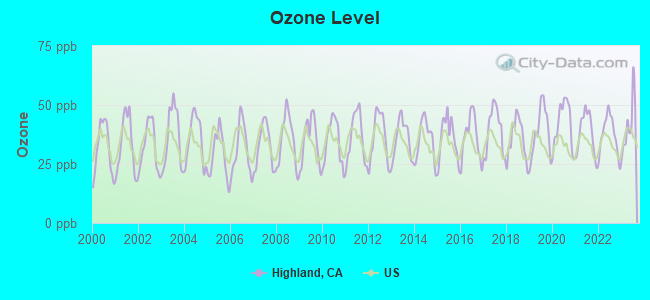
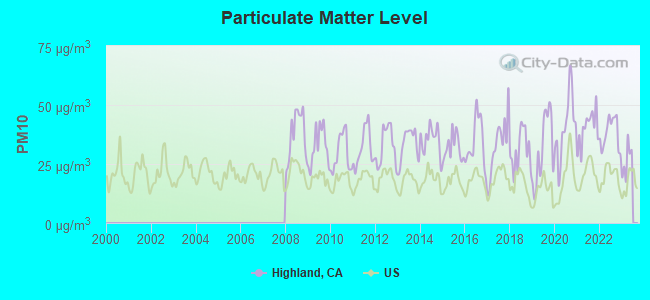
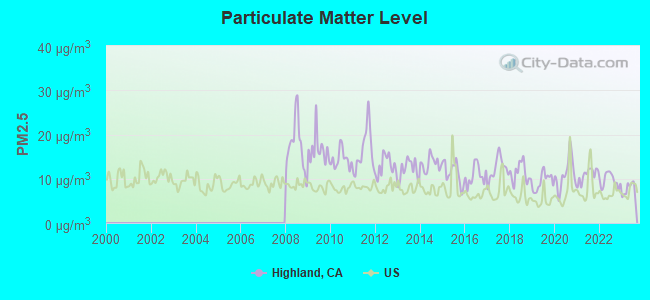
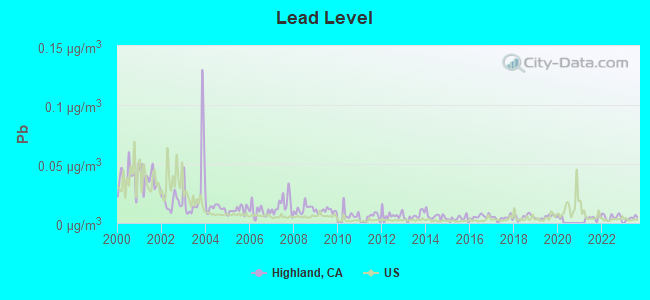

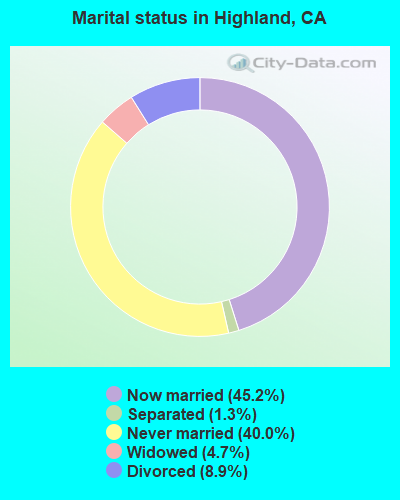
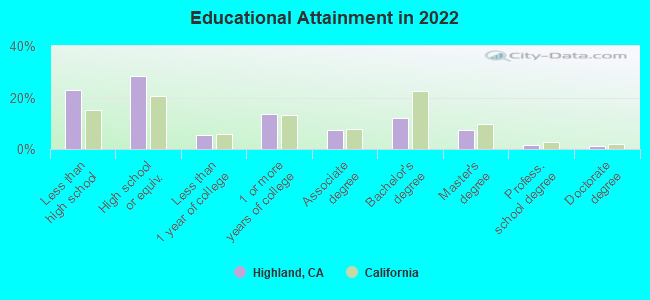
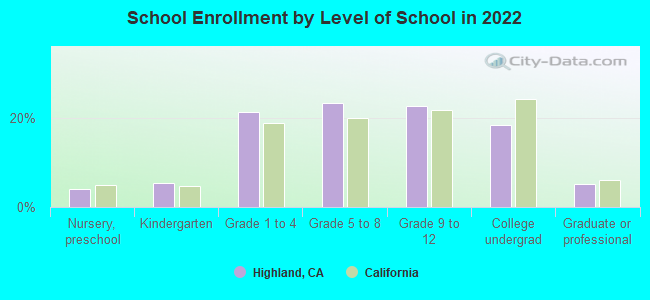
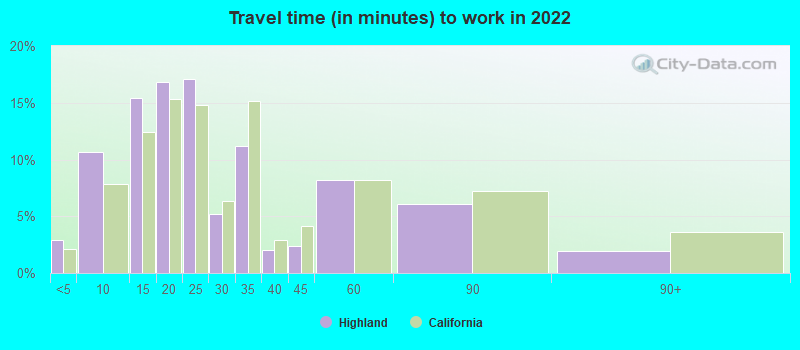
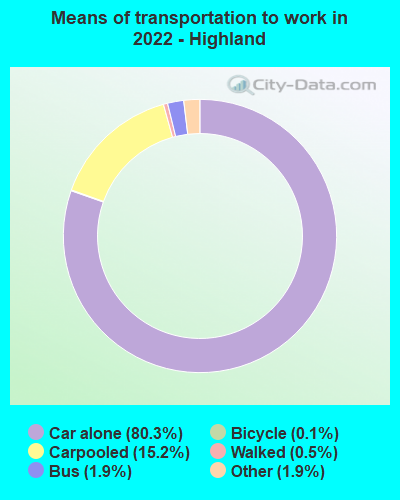
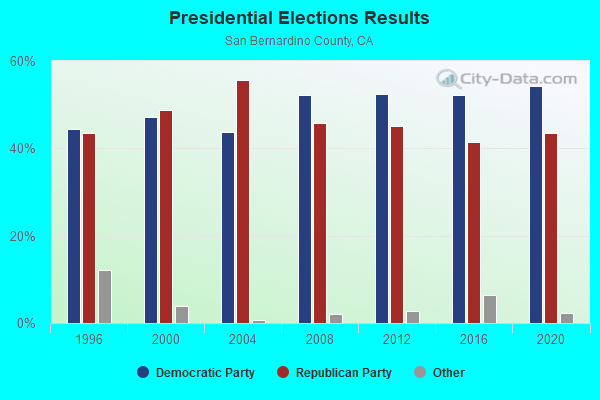
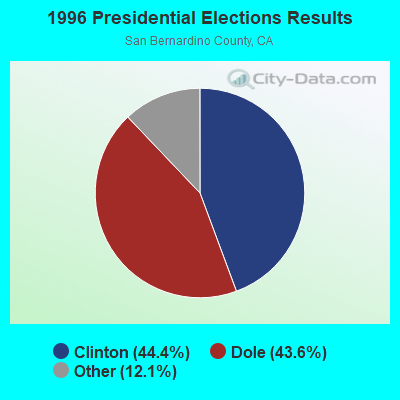
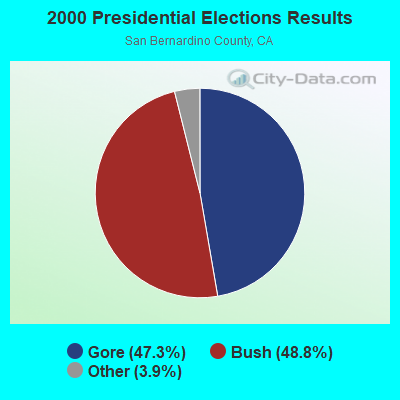
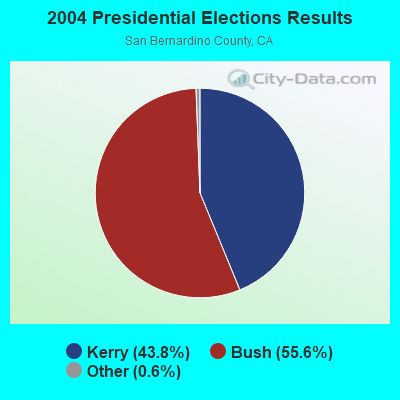
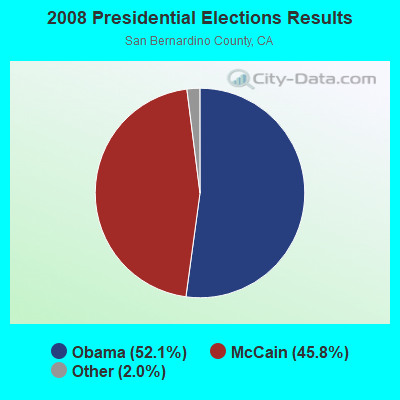
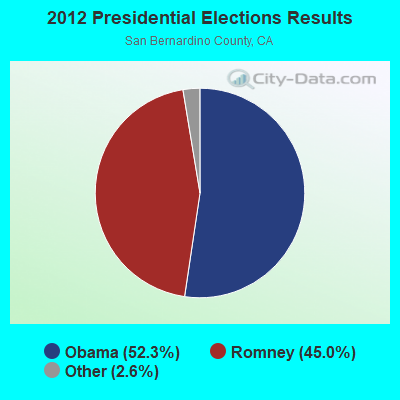
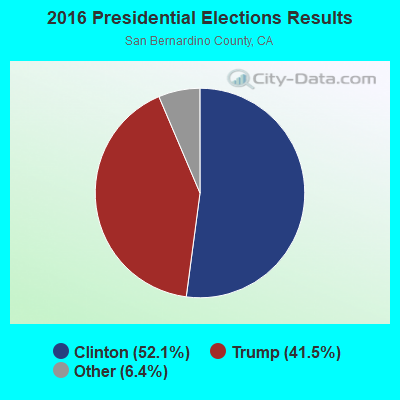
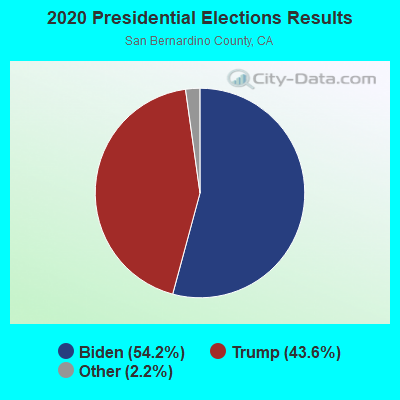
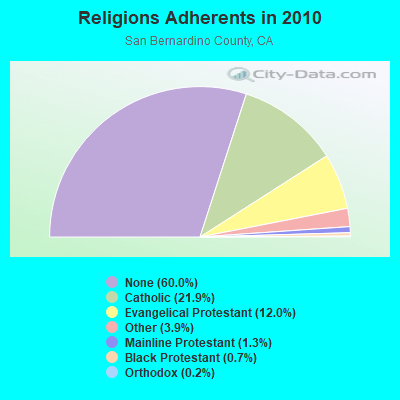
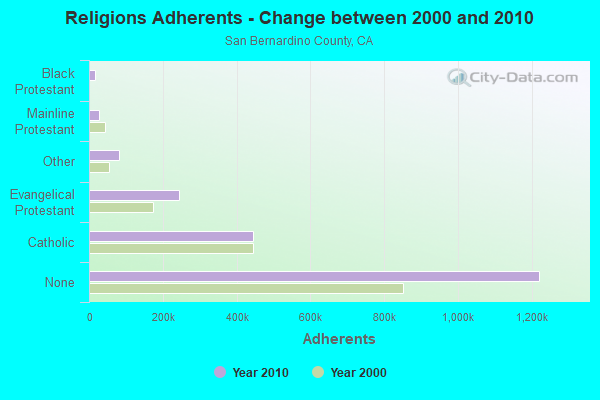
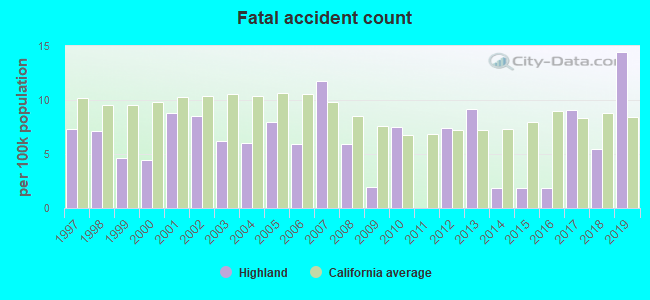
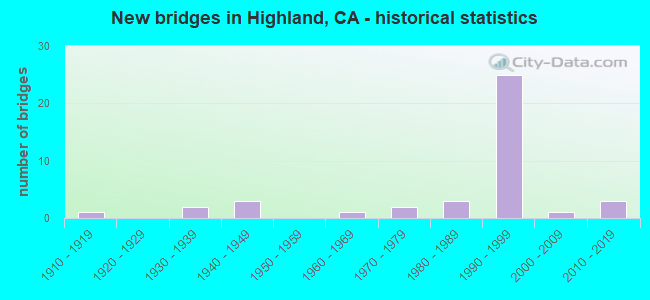

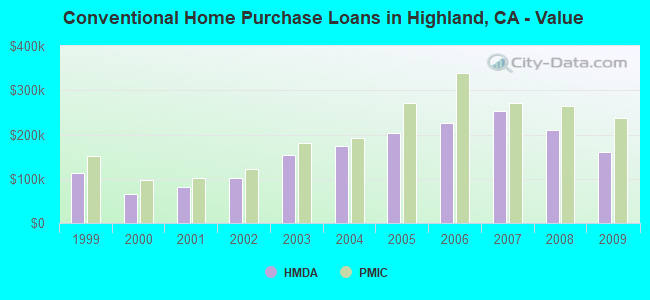
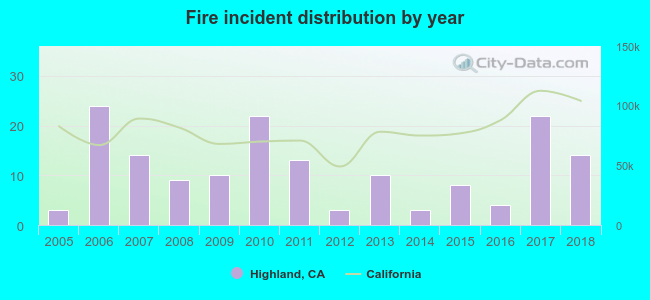 Based on the data from the years 2005 - 2018 the average number of fire incidents per year is 11. The highest number of reported fires - 24 took place in 2006, and the least - 3 in 2005. The data has a rising trend.
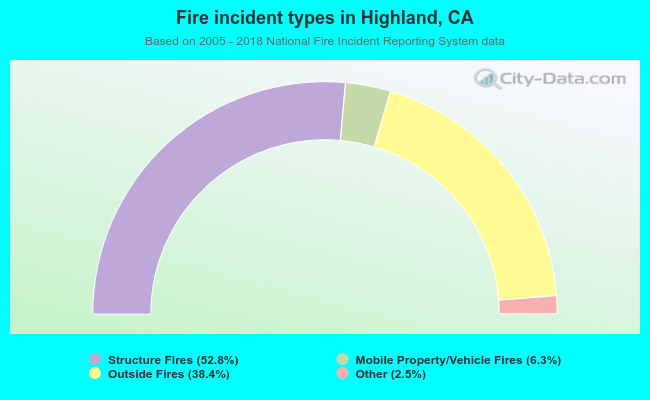 When looking into fire subcategories, the most reports belonged to: Structure Fires (52.8%), and Outside Fires (38.4%).