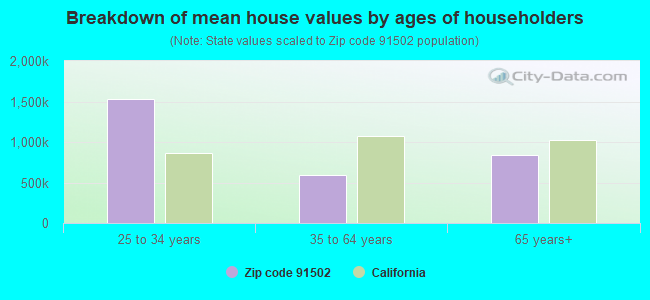
Estimated median house/condo value in 2022: $965,319
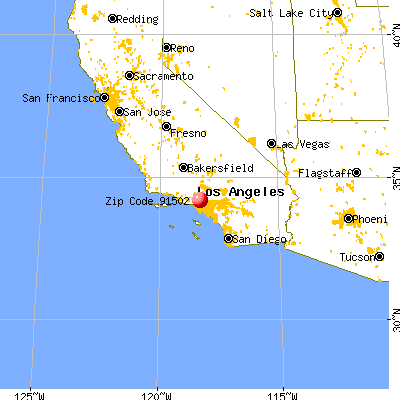
91502:
$965,319
California:
$715,900
According to our research of California and other state lists, there were 10 registered sex offenders living in 91502 zip code as of May 05, 2024. The ratio of all residents to sex offenders in zip code 91502 is 1,225 to 1. The ratio of registered sex offenders to all residents in this zip code is lower than the state average.
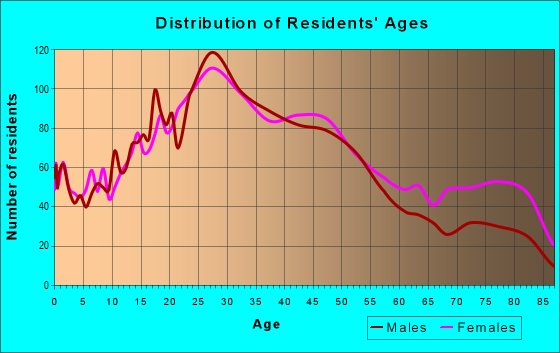
Median resident age:
This zip code:
35.3 years
California median age:
37.9 years
Average household size:
This zip code:
2.1 people
California:
2.8 people
Averages for the 2020 tax year for zip code 91502, filed in 2021:
Average Adjusted Gross Income (AGI) in 2020: $59,349 (Individual Income Tax Returns)
Here:
$59,349
State:
$95,910
Salary/wage: $52,665 (reported on 82.5% of returns)
Here:
$52,665
State:
$77,331
(% of AGI for various income ranges: 1180.4% for AGIs below $25k, 4109.8% for AGIs $25k-50k, 7780.5% for AGIs $50k-75k, 12193.2% for AGIs $75k-100k, 20542.6% for AGIs $100k-200k, 100423.3% for AGIs over 200k)
Taxable interest for individuals: $2,396 (reported on 21.6% of returns)
This zip code:
$2,396
California:
$2,294
(% of AGI for various income ranges: 5.0% for AGIs below $25k, 14.6% for AGIs $25k-50k, 27.2% for AGIs $50k-75k, 60.6% for AGIs $75k-100k, 158.3% for AGIs $100k-200k, 5890.0% for AGIs over 200k)
Ordinary dividends: $2,275 (reported on 13.5% of returns)
Here:
$2,275
State:
$10,949
(% of AGI for various income ranges: 11.4% for AGIs below $25k, 25.0% for AGIs $25k-50k, 18.6% for AGIs $50k-75k, 64.5% for AGIs $75k-100k, 167.4% for AGIs $100k-200k, 1413.3% for AGIs over 200k)
Net capital gain/loss in AGI: +$10,645 (reported on 13.9% of returns)
Here:
+$10,645
State:
+$49,306
(% of AGI for various income ranges: 3.7% for AGIs below $25k, 24.3% for AGIs $25k-50k, 41.6% for AGIs $50k-75k, 65.2% for AGIs $75k-100k, 372.0% for AGIs $100k-200k, 20520.0% for AGIs over 200k)
Profit/loss from business: +$10,524 (reported on 26.7% of returns)
Here:
+$10,524
State:
+$15,671
(% of AGI for various income ranges: 273.1% for AGIs below $25k, 309.7% for AGIs $25k-50k, 254.3% for AGIs $50k-75k, 365.5% for AGIs $75k-100k, 775.7% for AGIs $100k-200k, 13233.3% for AGIs over 200k)
Taxable individual retirement arrangement distribution: $11,339 (reported on 3.2% of returns)
91502:
$11,339
California:
$23,505
(% of AGI for various income ranges: 16.4% for AGIs below $25k, 33.0% for AGIs $25k-50k, 69.7% for AGIs $50k-75k, 79.0% for AGIs $75k-100k, 246.9% for AGIs $100k-200k)
Total itemized deductions: $35,037 (reported on 6.8% of returns)
Here:
$35,037
State:
$39,517
(% of AGI for various income ranges: 37.9% for AGIs below $25k, 126.8% for AGIs $25k-50k, 229.5% for AGIs $50k-75k, 506.5% for AGIs $75k-100k, 1085.4% for AGIs $100k-200k, 16206.7% for AGIs over 200k)
Charity contributions: $8,213 (reported on 5.6% of returns)
Here:
$8,213
State:
$12,598
(% of AGI for various income ranges: 18.1% for AGIs $25k-50k, 14.0% for AGIs $50k-75k, 76.8% for AGIs $75k-100k, 194.6% for AGIs $100k-200k, 4520.0% for AGIs over 200k)
Taxes paid: $7,729 (reported on 6.8% of returns)
91502:
$7,729
State:
$8,807
(% of AGI for various income ranges: 31.8% for AGIs $25k-50k, 53.6% for AGIs $50k-75k, 139.7% for AGIs $75k-100k, 353.1% for AGIs $100k-200k, 2076.7% for AGIs over 200k)
Earned income credit: $1,698 (reported on 16.0% of returns)
Here:
$1,698
State:
$2,074
(% of AGI for various income ranges: 81.0% for AGIs below $25k, 58.3% for AGIs $25k-50k)
Percentage of individuals using paid preparers for their 2020 taxes: 91.9%
Here:
92%
State:
92%
(% for various income ranges: 89.5% for AGIs below $25k, 91.7% for AGIs $25k-50k, 94.3% for AGIs $50k-75k, 94.1% for AGIs $75k-100k, 93.8% for AGIs $100k-200k, 93.3% for AGIs over 200k)
Averages for the 2012 tax year for zip code 91502, filed in 2013:
Average Adjusted Gross Income (AGI) in 2012: $47,536 (Individual Income Tax Returns)
Here:
$47,536
State:
$72,726
Salary/wage: $43,765 (reported on 85.6% of returns)
Here:
$43,765
State:
$59,079
(% of AGI for various income ranges: 72.9% for AGIs below $25k, 87.5% for AGIs $25k-50k, 88.7% for AGIs $50k-75k, 88.7% for AGIs $75k-100k, 84.0% for AGIs $100k-200k, 44.2% for AGIs over 200k)
Taxable interest for individuals: $937 (reported on 22.7% of returns)
This zip code:
$937
California:
$2,146
(% of AGI for various income ranges: 0.5% for AGIs below $25k, 0.4% for AGIs $25k-50k, 0.3% for AGIs $50k-75k, 0.3% for AGIs $75k-100k, 0.6% for AGIs $100k-200k, 0.6% for AGIs over 200k)
Ordinary dividends: $2,822 (reported on 9.3% of returns)
Here:
$2,822
State:
$9,308
(% of AGI for various income ranges: 0.6% for AGIs below $25k, 0.5% for AGIs $25k-50k, 0.3% for AGIs $50k-75k, 0.2% for AGIs $75k-100k, 0.8% for AGIs $100k-200k, 0.9% for AGIs over 200k)
Net capital gain/loss in AGI: +$4,563 (reported on 8.1% of returns)
Here:
+$4,563
State:
+$30,460
(% of AGI for various income ranges: 0.4% for AGIs $100k-200k, 4.9% for AGIs over 200k)
Profit/loss from business: +$10,439 (reported on 25.0% of returns)
Here:
+$10,439
State:
+$17,064
(% of AGI for various income ranges: 17.4% for AGIs below $25k, 6.4% for AGIs $25k-50k, 2.3% for AGIs $50k-75k, 3.6% for AGIs $75k-100k, 1.5% for AGIs $100k-200k, 6.2% for AGIs over 200k)
Taxable individual retirement arrangement distribution: $10,832 (reported on 3.6% of returns)
91502:
$10,832
California:
$19,557
(% of AGI for various income ranges: 1.1% for AGIs below $25k, 0.7% for AGIs $25k-50k, 1.8% for AGIs $50k-75k, 1.1% for AGIs $100k-200k)
Total itemized deductions: $24,457 (24% of AGI, reported on 23.4% of returns)
Here:
$24,457
State:
$34,004
Here:
23.9% of AGI
State:
22.7% of AGI
(% of AGI for various income ranges: 5.8% for AGIs below $25k, 7.8% for AGIs $25k-50k, 11.7% for AGIs $50k-75k, 13.5% for AGIs $75k-100k, 16.4% for AGIs $100k-200k, 15.6% for AGIs over 200k)
Charity contributions: $3,374 (reported on 17.6% of returns)
Here:
$3,374
State:
$4,659
(% of AGI for various income ranges: 0.4% for AGIs below $25k, 0.8% for AGIs $25k-50k, 1.3% for AGIs $50k-75k, 1.3% for AGIs $75k-100k, 1.9% for AGIs $100k-200k, 1.5% for AGIs over 200k)
Taxes paid: $9,179 (reported on 23.1% of returns)
91502:
$9,179
State:
$14,448
(% of AGI for various income ranges: 1.0% for AGIs below $25k, 1.4% for AGIs $25k-50k, 2.9% for AGIs $50k-75k, 4.7% for AGIs $75k-100k, 6.3% for AGIs $100k-200k, 10.3% for AGIs over 200k)
Earned income credit: $1,971 (reported on 22.1% of returns)
Here:
$1,971
State:
$2,286
(% of AGI for various income ranges: 6.4% for AGIs below $25k, 0.9% for AGIs $25k-50k)
Percentage of individuals using paid preparers for their 2012 taxes: 67.1%
Here:
67%
State:
64%
(% for various income ranges: 69.6% for AGIs below $25k, 64.8% for AGIs $25k-50k, 62.2% for AGIs $50k-75k, 65.0% for AGIs $75k-100k, 69.2% for AGIs $100k-200k, 85.7% for AGIs over 200k)
Averages for the 2004 tax year for zip code 91502, filed in 2005:
Average Adjusted Gross Income (AGI) in 2004: $35,726 (Individual Income Tax Returns)
Here:
$35,726
State:
$58,600
Salary/wage: $32,333 (reported on 86.1% of returns)
Here:
$32,333
State:
$49,455
(% of AGI for various income ranges: 115.2% for AGIs below $10k, 82.3% for AGIs $10k-25k, 90.8% for AGIs $25k-50k, 92.0% for AGIs $50k-75k, 89.3% for AGIs $75k-100k, 42.5% for AGIs over 100k)
Taxable interest for individuals: $1,010 (reported on 26.3% of returns)
This zip code:
$1,010
California:
$2,365
(% of AGI for various income ranges: 3.4% for AGIs below $10k, 0.7% for AGIs $10k-25k, 0.4% for AGIs $25k-50k, 0.5% for AGIs $50k-75k, 0.3% for AGIs $75k-100k, 1.3% for AGIs over 100k)
Taxable dividends: $2,034 (reported on 10.1% of returns)
Here:
$2,034
State:
$4,746
(% of AGI for various income ranges: 1.9% for AGIs below $10k, 0.5% for AGIs $10k-25k, 0.5% for AGIs $25k-50k, 0.1% for AGIs $50k-75k, 0.2% for AGIs $75k-100k, 1.1% for AGIs over 100k)
Net capital gain/loss: +$12,181 (reported on 8.8% of returns)
Here:
+$12,181
State:
+$23,418
(% of AGI for various income ranges: -2.4% for AGIs below $10k, -0.0% for AGIs $10k-25k, 0.4% for AGIs $25k-50k, 0.2% for AGIs $50k-75k, -0.1% for AGIs $75k-100k, 11.6% for AGIs over 100k)
Profit/loss from business: +$9,160 (reported on 22.4% of returns)
Here:
+$9,160
State:
+$16,826
(% of AGI for various income ranges: 29.6% for AGIs below $10k, 11.2% for AGIs $10k-25k, 4.4% for AGIs $25k-50k, 3.6% for AGIs $50k-75k, 3.6% for AGIs $75k-100k, 4.7% for AGIs over 100k)
IRA payment deduction: $2,462 (reported on 1.7% of returns)
91502:
$2,462
California:
$3,192
(% of AGI for various income ranges: 0.2% for AGIs $10k-25k, 0.1% for AGIs $25k-50k, 0.2% for AGIs $50k-75k, 0.2% for AGIs $75k-100k)
Self-employed pension: $13,200 (reported on 0.4% of returns)
Here:
$13,200
California:
$17,688
Total itemized deductions: $22,125 (27% of AGI, reported on 20.3% of returns)
Here:
$22,125
State:
$28,113
Here:
27.4% of AGI
State:
25.3% of AGI
(% of AGI for various income ranges: 10.5% for AGIs below $10k, 8.2% for AGIs $10k-25k, 9.5% for AGIs $25k-50k, 13.9% for AGIs $50k-75k, 14.4% for AGIs $75k-100k, 17.5% for AGIs over 100k)
Charity contributions deductions: $2,545 (3% of AGI, reported on 16.8% of returns)
Here:
$2,545
State:
$3,923
Here:
3.0% of AGI
State:
3.3% of AGI
(% of AGI for various income ranges: 0.4% for AGIs below $10k, 0.5% for AGIs $10k-25k, 1.0% for AGIs $25k-50k, 1.5% for AGIs $50k-75k, 1.8% for AGIs $75k-100k, 1.4% for AGIs over 100k)
Total tax: $5,171 (reported on 74.6% of returns)
91502:
$5,171
State:
$10,761
(% of AGI for various income ranges: 6.6% for AGIs below $10k, 4.9% for AGIs $10k-25k, 7.4% for AGIs $25k-50k, 10.4% for AGIs $50k-75k, 12.5% for AGIs $75k-100k, 18.3% for AGIs over 100k)
Earned income credit: $1,735 (reported on 22.7% of returns)
Here:
$1,735
State:
$1,763
Percentage of individuals using paid preparers for their 2004 taxes: 68.6%
Here:
69%
State:
66%
(% for various income ranges: 65.1% for AGIs below $10k, 71.3% for AGIs $10k-25k, 67.9% for AGIs $25k-50k, 66.6% for AGIs $50k-75k, 64.6% for AGIs $75k-100k, 81.9% for AGIs over 100k)
Likely homosexual households (counted as self-reported same-sex unmarried-partner households)
Lesbian couples: 0.5% of all households
Gay men: 0.0% of all households
Household received Food Stamps/SNAP in the past 12 months: 1,012 Household did not receive Food Stamps/SNAP in the past 12 months: 4,732
Women who had a birth in the past 12 months: 222 (196 now married, 25 unmarried) Women who did not have a birth in the past 12 months: 3,588 (1,009 now married, 2,595 unmarried)
Housing units in zip code 91502 with a mortgage: 457 (6 second mortgage, 6 both second mortgage and home equity loan) Median monthly owner costs for units with a mortgage: $2,900 Median monthly owner costs for units without a mortgage: $466
Residents with income below the poverty level in 2022:
This zip code:
13.1%
Whole state:
12.2%
Residents with income below 50% of the poverty level in 2022:
This zip code:
9.6%
Whole state:
6.2%
Median number of rooms in houses and condos:
Here:
5.2
State:
6.0
Median number of rooms in apartments:
Here:
3.0
State:
3.9
Notable locations in this zip code not listed on our city pages
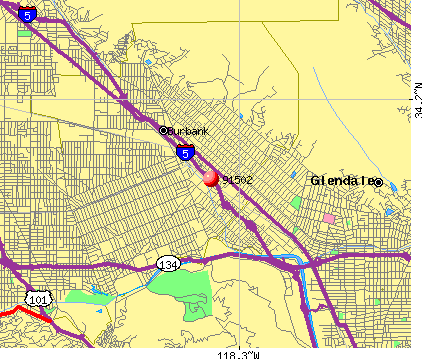
Notable locations in zip code 91502: Southern California Genealogical Society Library (A), Burbank City Hall (B), City of Burbank Fire Department Station 11 Headquarters (C), Burbank Municipal Services Building (D), Burbank County Courts Building (E), Burbank City Hall Annex (F). Display/hide their locations on the map
Churches in zip code 91502 include: Central Baptist Church (A), First Assembly of God Church (B), First Lutheran Church (C), Burbank Foursquare Church (D). Display/hide their locations on the map
1,305 married couples with children.
489 single-parent households (37 men, 452 women).
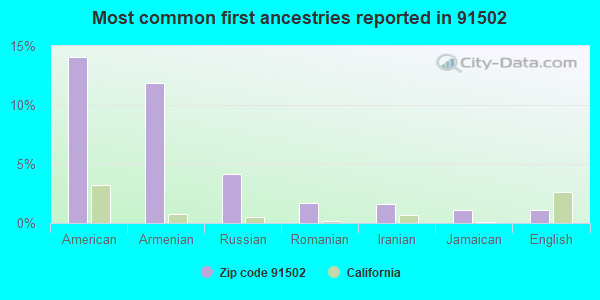
44.7% of residents of 91502 zip code speak English at home.
20.1% of residents speak Spanish at home (70% very well, 13% well, 15% not well, 2% not at all).
29.1% of residents speak other Indo-European language at home (50% very well, 15% well, 23% not well, 13% not at all).
6.0% of residents speak Asian or Pacific Island language at home (78% very well, 18% well, 4% not well).
0.6% of residents speak other language at home (30% very well, 57% not well, 13% not at all).
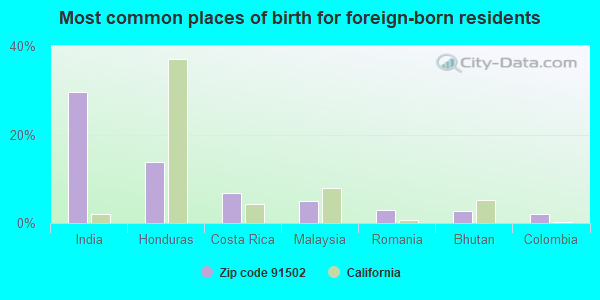
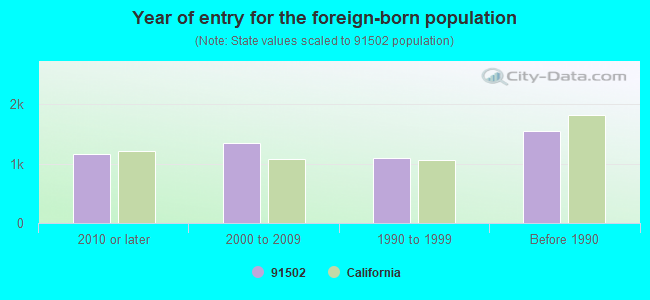
Foreign born population: 4,959 (40.6%) (72.0% of them are naturalized citizens)
Major facilities with environmental interests located in this zip code:
4MC BURBANK INCORPORATED (3611 NORTH SAN FERNANDO ROAD in BURBANK, CA)
STATE MASTER (California - Hazardous Waste Tracking) - HAZARDOU WASTE PROGRAM CRITERIA AND HAZARDOUS AIR POLLUTANT INVENTORY (Inventory of air pollution sources) HAZARDOUS WASTE BIENNIAL REPORTER (Resource Conservation and Recovery Act (tracking hazardous waste)) Large Quantity Generators, more that 1000 kg of hazardous waste/month (Resource Conservation and Recovery Act (tracking hazardous waste)) TRI REPORTER (Tracking of toxic chemicals releasing facilities) Business SIC classification: PHOTOFINISHING LABORATORIES; MOTION PICTURE AND VIDEO TAPE PRODUCTION; SERVICES ALLIED TO MOTION PICTURE PRODUCTION Business NAICS classification: OTHER MOTION PICTURE AND VIDEO INDUSTRIES. Organizations: DBA ASCENT MEDIA LABORATORIES (CONTACT/OPERATOR)
, ASCENT MEDIA MANAGEMENT SERVICES INC (CONTACT/OWNER)
Alternative names: FOUR MEDIA LABORATORY, 4MC BURBANK INC 4MC LAB, IMAGE TRANSFORM LABS.
J&M ANDOZING (525 SOUTH FLOWER in BURBANK, CA)
STATE MASTER (California - Hazardous Waste Tracking) - HAZARDOU WASTE PROGRAM HAZARDOUS WASTE BIENNIAL REPORTER (Resource Conservation and Recovery Act (tracking hazardous waste)) Large Quantity Generators, more that 1000 kg of hazardous waste/month (Resource Conservation and Recovery Act (tracking hazardous waste)) TRI REPORTER (Tracking of toxic chemicals releasing facilities) Business SIC and NAICS classification: ELECTROPLATING, PLATING, POLISHING, ANODIZING, AND COLORING Organizations: ROBERT KUKLENSKI (CONTACT/OPERATOR)
, J & M ANODIZING INC (CONTACT/OWNER)
Alternative names: J & M ANODIZING INC, J & M ANODIZING#
CHEVRON STATION NO 93049 (100 S GLENOAKS BLVD in BURBANK, CA)
STATE MASTER (California - Hazardous Waste Tracking) - HAZARDOU WASTE PROGRAM HAZARDOUS WASTE BIENNIAL REPORTER (Resource Conservation and Recovery Act (tracking hazardous waste)) Large Quantity Generators, more that 1000 kg of hazardous waste/month (Resource Conservation and Recovery Act (tracking hazardous waste)) Small Quantity Generators, between 100 kg and 1000 kg of hazardous waste/month (Resource Conservation and Recovery Act (tracking hazardous waste)) - notification Organizations: CHEVRON PRODUCTS CO (CONTACT/OWNER)
Alternative names: CHEVRON 93049
K & L ANODIZING CORPORATION (1200 S. VICTORY BLVD in BURBANK, CA)
SUPERFUND (Superfund database) STATE MASTER (California - Hazardous Waste Tracking) - HAZARDOU WASTE PROGRAM HAZARDOUS WASTE BIENNIAL REPORTER (Resource Conservation and Recovery Act (tracking hazardous waste)) Small Quantity Generators, between 100 kg and 1000 kg of hazardous waste/month (Resource Conservation and Recovery Act (tracking hazardous waste)) TRI REPORTER (Tracking of toxic chemicals releasing facilities) Business SIC and NAICS classification: ELECTROPLATING, PLATING, POLISHING, ANODIZING, AND COLORING Organizations: K & L ANODIZING CORP. (CONTACT/OPERATOR)
, DON LEIKER (CONTACT/OWNER)
L & M BLACK OXIDE CO INC (1019 VICTORY PL in BURBANK, CA)
STATE MASTER (California - Hazardous Waste Tracking) - HAZARDOU WASTE PROGRAM (Resource Conservation and Recovery Act (tracking hazardous waste))
ITT AEROSPACE CONTROLS (1200 FLOWER STREET in BURBANK, CA)
COMPLIANCE ACTIVITY (Tracking inspections of insecticide, fungicide, and rodenticide, and toxic substances) National Pollutant Discharge Elimination System NON-MAJOR (Tracking pollutant discharge elimination systems) - permit Large Quantity Generators, more that 1000 kg of hazardous waste/month (Resource Conservation and Recovery Act (tracking hazardous waste)) TRI REPORTER (Tracking of toxic chemicals releasing facilities) Business SIC classification: MINERALS AND EARTHS, GROUND OR OTHERWISE TREATED; INDUSTRIAL VALVES; SPACE RESEARCH AND TECHNOLOGY Organizations: HOME DEPOT, USA, INC. (CONTACT/OWNER)
Alternative names: FORMER ITT AEROSPACE CONTROLS, HOME DEPOT, USA, INC.
ALLENS CLEANERS (321 EAST ALAMEDA in BURBANK, CA)
STATE MASTER (California - Hazardous Waste Tracking) - HAZARDOU WASTE PROGRAM CRITERIA AND HAZARDOUS AIR POLLUTANT INVENTORY (Inventory of air pollution sources) Small Quantity Generators, between 100 kg and 1000 kg of hazardous waste/month (Resource Conservation and Recovery Act (tracking hazardous waste)) - notification Business SIC classification: DRYCLEANING PLANTS, EXCEPT RUG CLEANING Organizations: MALEKIAN RAFIC (CONTACT/OWNER)
CALTRANS DISTRICT 7/BURBANK ELEC. (524 S FLOWER STREET in BURBANK, CA) . Federal Facility
STATE MASTER (California - Hazardous Waste Tracking) - HAZARDOU WASTE PROGRAM TRANSPORTER (Resource Conservation and Recovery Act (tracking hazardous waste)) Alternative names: BURKANK ELECTRICAL
HASKEL INC (100 E GRAHAM PL in BURBANK, CA)
STATE MASTER (California - Hazardous Waste Tracking) - HAZARDOU WASTE PROGRAM Small Quantity Generators, between 100 kg and 1000 kg of hazardous waste/month (Resource Conservation and Recovery Act (tracking hazardous waste))
AMERICAN BINDERY SERVICE SUPPLY (150 W PROVIDENCIA AVE in BURBANK, CA)
STATE MASTER (California - Hazardous Waste Tracking) - HAZARDOU WASTE PROGRAM Small Quantity Generators, between 100 kg and 1000 kg of hazardous waste/month (Resource Conservation and Recovery Act (tracking hazardous waste)) - notification Organizations: RAYMOND D AGUIAR (CONTACT/OWNER)
Alternative names: AMERICAN BINDERY SERVICE & SUPPLY INC
L A GRINDING (305 N VICTORY BLVD in BURBANK, CA)
STATE MASTER (California - Hazardous Waste Tracking) - HAZARDOU WASTE PROGRAM Small Quantity Generators, between 100 kg and 1000 kg of hazardous waste/month (Resource Conservation and Recovery Act (tracking hazardous waste)) - notification
INTL ELECTRONIC RESEARCH CORP (413 N MOSS ST in BURBANK, CA)
STATE MASTER (California - Hazardous Waste Tracking) - HAZARDOU WASTE PROGRAM Small Quantity Generators, between 100 kg and 1000 kg of hazardous waste/month (Resource Conservation and Recovery Act (tracking hazardous waste)) - notification Organizations: DYNAMICS CORP OF AMERICA (CONTACT/OWNER)
GENERAL TAPPING (1100 S VICTORY in BURBANK, CA)
STATE MASTER (California - Hazardous Waste Tracking) - HAZARDOU WASTE PROGRAM Small Quantity Generators, between 100 kg and 1000 kg of hazardous waste/month (Resource Conservation and Recovery Act (tracking hazardous waste)) - notification
Housing units lacking complete plumbing facilities: 1.6% Housing units lacking complete kitchen facilities: 2.6%
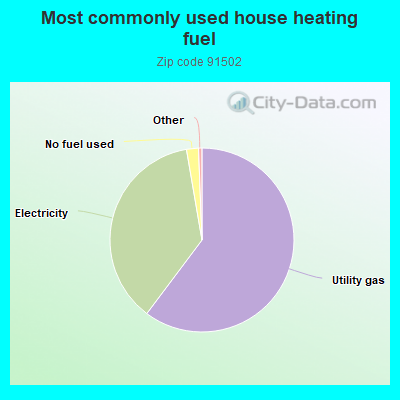
60.2%Utility gas
37.0%Electricity
2.1%No fuel used
Population in 1990: 9,833. Population change in the 1990s: +1,667 (+17.0%).
Place of birth for U.S.-born residents:
This state: 4,815
Northeast: 576
Midwest: 663
South: 612
West: 368
46% of the 91502 zip code residents lived in the same house 5 years ago. Out of people who lived in different houses, 81% lived in this county. Out of people who lived in different counties, 50% lived in California.
87% of the 91502 zip code residents lived in the same house 1 year ago. Out of people who lived in different houses, 75% moved from this county. Out of people who lived in different houses, 5% moved from different county within same state. Out of people who lived in different houses, 14% moved from different state. Out of people who lived in different houses, 3% moved from abroad.
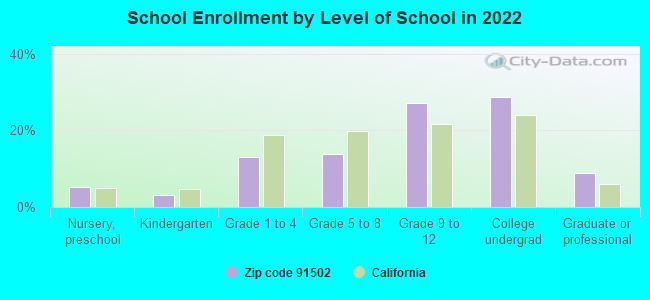
Private vs. public school enrollment:
Students in private schools in grades 1 to 8 (elementary and middle school): 34
Here:
5.0%
California:
10.5%
Students in private schools in grades 9 to 12 (high school):
Here:
0.0%
California:
8.5%
Students in private undergraduate colleges: 223
Here:
29.8%
California:
15.9%
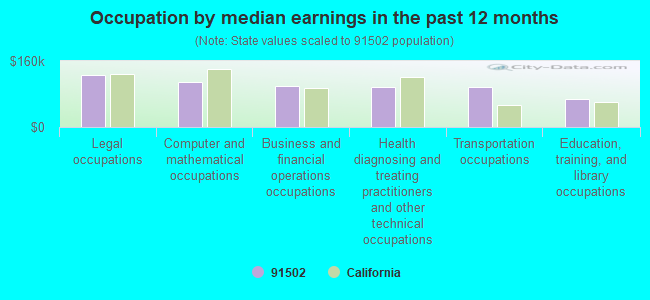
Occupation by median earnings in the past 12 months ($)
125,202Legal occupations
109,971Computer and mathematical occupations
100,330Business and financial operations occupations
97,042Health diagnosing and treating practitioners and other technical occupations
96,703Transportation occupations
68,610Education, training, and library occupations
Companies with biggest federal contracts located in this zip code (BURBANK, CA):
HASKEL INTERNATIONAL, INC (100 E GRAHAM PLACE; small business) : $4,027,275 in 83 contractsfrom 1999 to 2006
Contracts for Packing and Gasket Materials, Power and Hand Pumps, Engine Fuel System Components, Aircraft and Missile Prime Movers, Pressure, Temperature, and Humidity Measuring and Controlling Instruments, and moreby Defense Logistics Agency, Navy, Air Force, Army, and others Signed by year:2000: $764,390; 2001: $333,508; 2002: $657,824; 2003: $268,510; 2004: $960,725; 2005: $301,384; 2006: $664,034.
Biggest contracts:
$641,280 with Defense Logistics Agency for Packing and Gasket Materials. Signed on 2006-03-03. Completion date: 2006-07-02.
$616,000, same as above.Signed on 2004-03-16. Completion date: 2004-07-14.
$487,640, same as above.Signed on 2000-12-06. Completion date: 2001-12-06.
$99,700 with Navy for Power and Hand Pumps. Signed on 2005-05-03. Completion date: 2006-05-03.
GERHARDT GEAR CO INC (133 E SANTA ANITA AVE; small business) : $808,180 in 39 contractsfrom 2000 to 2006
Contracts for Gears, Pulleys, Sprockets, and Transmission Chain, Miscellaneous Power Transmission Equipment, Airframe Structural Components by Defense Logistics Agency Signed by year:2000: $80,772; 2001: $126,391; 2002: $145,308; 2003: $0; 2004: $173,697; 2005: $223,995; 2006: $58,017.
Biggest contracts:
$95,800 with Defense Logistics Agency for Gears, Pulleys, Sprockets, and Transmission Chain. Signed on 2001-07-17. Completion date: 2002-02-16.
$56,682 with Defense Logistics Agency for Miscellaneous Power Transmission Equipment. Signed on 2004-01-28. Completion date: 2004-07-26.
$55,770 with Defense Logistics Agency for Airframe Structural Components. Signed on 2002-08-29. Completion date: 2003-05-30.
$49,950 with Defense Logistics Agency for Gears, Pulleys, Sprockets, and Transmission Chain. Signed on 2000-02-24. Completion date: 2000-08-27.
COMMODITY RESOURCE & ENVIRONME (116 E PROSPECT AVE; small business) : $584,581 in 11 contractsfrom 2001 to 2005
Contracts for Miscellaneous Items, Surface Mining Reclamation Services (non-construction) by Defense Logistics Agency Signed by year:2000: $0; 2001: $136,233; 2002: $184,939; 2003: $52,000; 2004: $146,300; 2005: $65,109; 2006: $0.
Biggest contracts:
$136,233 with Defense Logistics Agency for Miscellaneous Items. Signed on 2001-10-16. Completion date: 2001-12-28.
$75,809 with Defense Logistics Agency for Surface Mining Reclamation Services (non-construction). Signed on 2002-09-27. Completion date: 2002-10-14.
$74,000, same as above.Signed on 2004-06-21. Completion date: 2004-08-31.
$73,167, same as above.Signed on 2002-07-30. Completion date: 2002-10-14.
THE LUCKMAN PARTNERSHIP INC (333 NO GLENOAKS BLVD , #5) : $497,239 in 10 contractsfrom 2000 to 2005
Contracts for Other Architect and Engineering Services by Air Force Signed by year:2000: $76,590; 2001: $10,998; 2002: $0; 2003: $360,061; 2004: $4,013; 2005: $45,577; 2006: $0.
Biggest contracts:
$238,638 with Air Force for Other Architect and Engineering Services. Signed on 2003-07-31. Completion date: 2003-12-08.
$69,732, same as above.Signed on 2003-07-21. Completion date: 2003-11-28.
$56,896, same as above.Signed on 2000-09-25. Completion date: 2001-03-13.
$45,577, same as above.Signed on 2005-03-15. Completion date: 2005-07-28.
HONEYWELL INTERNATIONAL INC (BURBANK WEST CST SUPPORT) : $75,251 in 4 contractsfrom 2000 to 2001
$64,133 with Air Force for Automatic Pilot Mechanisms and Airborne Gyro Components. Signed on 2000-07-31. Completion date: 2001-12-22.
$57,141, same as above.Signed on 2000-12-11. Completion date: 2001-03-23.
$39,211, same as above.Signed on 2000-03-03. Completion date: 2001-12-22.
-$85,234 with Army for Engine Fuel System Components, Aircraft and Missile Prime Movers. Signed on 2001-03-27. Completion date: 2001-05-30.
EMANON AIRCRAFT FASTENERS (404 S LAKE ST; small business) : $41,212 in 4 contractsfrom 2001 to 2004
$26,275 with Navy for Fastening Device. Signed on 2001-08-07. Completion date: 2001-08-27.
$7,814 with Navy for Nuts and Washers. Signed on 2003-11-03. Completion date: 2004-01-16.
$4,819 with Navy for Fastening Device. Signed on 2003-01-10. Completion date: 2003-01-30.
$2,304 with Navy for Nuts and Washers. Signed on 2004-03-10. Completion date: 2004-08-04.
LITEBEAMS, INC (223 W PALM AVE; small business) : $39,945 in 3 contractsfrom 2004 to 2006
$25,807 with Navy for Aircraft Landing Equipment. Signed on 2004-05-18. Completion date: 2004-05-26.
$7,792 with Army for Maintenance, Repair and Rebuilding of Equipment -- Electrical and Electronic Equipment Components. Signed on 2006-06-09. Completion date: 2006-07-09.
$6,346 with Army for Indoor and Outdoor Electric Lighting Fixtures. Signed on 2005-09-13. Completion date: 2005-10-10.
HASKEL INC (100 E GRAHAM PL)
$38,900 with Defense Logistics Agency for Power and Hand Pumps. Signed on 1999-10-12. Completion date: 2000-03-10.
BORRMANN METAL CENTER (110 W OLIVE AVE; small business) : $8,732 in 2 contractsin 2006
$4,504 with Navy for Plate, Sheet, Strip, Foil; and Leaf. Signed on 2006-02-03. Completion date: 2006-02-15.
$4,228 with Army for Bars and Rods. Signed on 2006-04-03. Completion date: 2006-04-07.
GLOBAL SERVICE RESOURCES INC (711 SOUTH VICTORY BLVD; small business)
$3,589 with Army for Miscellaneous Electrical and Electronic Components. Taking place in AZ. Signed on 2006-04-13. Completion date: 2006-05-01.
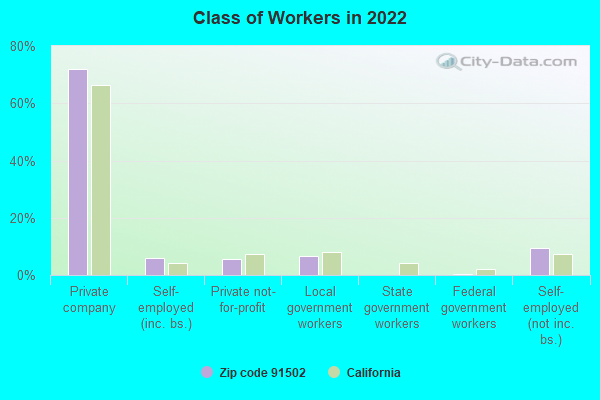
Top industries in this zip code by the number of employees in 2005:
Administrative and Support and Waste Management and Remediation Services: Security Guards and Patrol Services (100-249: 2)
Information: Motion Picture and Video Production (50-99: 2, 20-49: 2, 10-19: 1, 5-9: 2, 1-4: 14)
Arts, Entertainment, and Recreation: Independent Artists, Writers, and Performers (100-249: 1, 20-49: 1, 10-19: 2, 5-9: 2, 1-4: 9)
Accommodation and Food Services: Snack and Nonalcoholic Beverage Bars (50-99: 1, 20-49: 3, 10-19: 3, 5-9: 4, 1-4: 5)
Real Estate and Rental and Leasing: Other Commercial and Industrial Machinery and Equipment Rental and Leasing (100-249: 1, 20-49: 1, 10-19: 1, 5-9: 1, 1-4: 3)
People in group quarters in 2010:
57 people in other noninstitutional facilities
4 people in workers' group living quarters and job corps centers
People in group quarters in 2000:
35 people in other noninstitutional group quarters
17 people in other nonhousehold living situations
12 people in homes or halfway houses for drug/alcohol abuse
2 people in local jails and other confinement facilities (including police lockups)
Fatal accident statistics in 2011:
Fatal accident count: 2
Vehicles involved in fatal accidents: 4
Fatal accidents caused by drunken drivers: 0
Fatalities: 2
Persons involved in fatal accidents: 4
Pedestrians involved in fatal accidents: 0
Home Mortgage Disclosure Act Aggregated Statistics For Year 2009 (Based on 10 partial tracts)
A) FHA, FSA/RHS & VA Home Purchase Loans
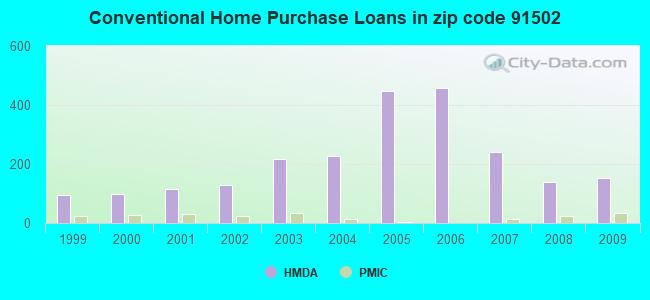
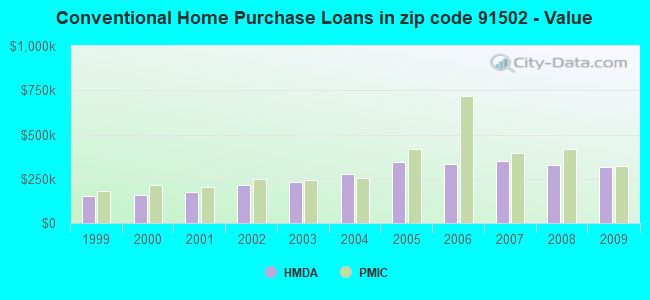
B) Conventional Home Purchase Loans
C) Refinancings
D) Home Improvement Loans
E) Loans on Dwellings For 5+ Families
F) Non-occupant Loans on < 5 Family Dwellings (A B C & D)
Number
Average Value
Number
Average Value
Number
Average Value
Number
Average Value
Number
Average Value
Number
Average Value
LOANS ORIGINATED
36
$421,201
153
$316,065
195
$293,470
10
$199,593
6
$1,516,205
43
$312,770
APPLICATIONS APPROVED, NOT ACCEPTED
5
$481,084
26
$265,371
21
$324,954
5
$230,854
0
$0
8
$309,896
APPLICATIONS DENIED
10
$440,011
47
$297,206
84
$342,459
4
$75,005
5
$1,637,542
24
$345,964
APPLICATIONS WITHDRAWN
11
$415,805
35
$337,476
43
$349,906
4
$191,080
3
$2,110,193
15
$321,226
FILES CLOSED FOR INCOMPLETENESS
4
$399,888
6
$238,893
16
$366,699
0
$0
1
$1,031,840
4
$275,272
Aggregated Statistics For Year 2008 (Based on 10 partial tracts)
A) FHA, FSA/RHS & VA Home Purchase Loans
B) Conventional Home Purchase Loans
C) Refinancings
D) Home Improvement Loans
E) Loans on Dwellings For 5+ Families
F) Non-occupant Loans on < 5 Family Dwellings (A B C & D)
G) Loans On Manufactured Home Dwelling (A B C & D)
Number
Average Value
Number
Average Value
Number
Average Value
Number
Average Value
Number
Average Value
Number
Average Value
Number
Average Value
LOANS ORIGINATED
13
$430,472
138
$326,268
137
$296,317
10
$205,108
16
$989,621
53
$344,397
1
$86,420
APPLICATIONS APPROVED, NOT ACCEPTED
0
$0
33
$370,332
29
$361,219
4
$64,293
0
$0
5
$458,440
3
$76,703
APPLICATIONS DENIED
9
$343,546
78
$473,644
75
$392,740
10
$149,959
3
$461,557
12
$475,439
0
$0
APPLICATIONS WITHDRAWN
3
$310,047
55
$419,692
48
$339,364
3
$369,257
0
$0
18
$427,561
0
$0
FILES CLOSED FOR INCOMPLETENESS
1
$481,100
10
$341,360
8
$376,351
1
$1,034,640
0
$0
1
$1,034,640
0
$0
Aggregated Statistics For Year 2007 (Based on 10 partial tracts)
B) Conventional Home Purchase Loans
C) Refinancings
D) Home Improvement Loans
E) Loans on Dwellings For 5+ Families
F) Non-occupant Loans on < 5 Family Dwellings (A B C & D)
G) Loans On Manufactured Home Dwelling (A B C & D)
Number
Average Value
Number
Average Value
Number
Average Value
Number
Average Value
Number
Average Value
Number
Average Value
LOANS ORIGINATED
241
$352,145
274
$361,489
29
$240,955
39
$1,384,765
61
$399,317
0
$0
APPLICATIONS APPROVED, NOT ACCEPTED
56
$336,664
70
$363,035
8
$338,590
3
$1,058,820
18
$415,822
2
$159,080
APPLICATIONS DENIED
70
$373,144
167
$376,683
22
$110,476
0
$0
33
$416,278
1
$40,520
APPLICATIONS WITHDRAWN
31
$385,194
61
$377,304
8
$117,564
0
$0
19
$397,323
0
$0
FILES CLOSED FOR INCOMPLETENESS
11
$392,443
35
$382,868
3
$311,137
0
$0
5
$376,376
0
$0
Aggregated Statistics For Year 2006 (Based on 10 partial tracts)
B) Conventional Home Purchase Loans
C) Refinancings
D) Home Improvement Loans
E) Loans on Dwellings For 5+ Families
F) Non-occupant Loans on < 5 Family Dwellings (A B C & D)
G) Loans On Manufactured Home Dwelling (A B C & D)
Number
Average Value
Number
Average Value
Number
Average Value
Number
Average Value
Number
Average Value
Number
Average Value
LOANS ORIGINATED
457
$333,906
298
$350,722
30
$260,072
45
$1,070,236
95
$411,173
0
$0
APPLICATIONS APPROVED, NOT ACCEPTED
83
$359,457
61
$312,390
9
$275,773
1
$3,776,290
19
$418,651
0
$0
APPLICATIONS DENIED
156
$348,862
208
$421,378
15
$319,145
3
$898,560
20
$417,657
1
$190,890
APPLICATIONS WITHDRAWN
112
$348,521
137
$365,742
12
$367,627
3
$913,390
38
$353,033
0
$0
FILES CLOSED FOR INCOMPLETENESS
7
$390,403
25
$319,021
3
$155,650
1
$790,920
3
$475,260
0
$0
Aggregated Statistics For Year 2005 (Based on 10 partial tracts)
B) Conventional Home Purchase Loans
C) Refinancings
D) Home Improvement Loans
E) Loans on Dwellings For 5+ Families
F) Non-occupant Loans on < 5 Family Dwellings (A B C & D)
G) Loans On Manufactured Home Dwelling (A B C & D)
Number
Average Value
Number
Average Value
Number
Average Value
Number
Average Value
Number
Average Value
Number
Average Value
LOANS ORIGINATED
448
$346,293
336
$308,760
58
$249,679
57
$1,324,948
99
$380,392
0
$0
APPLICATIONS APPROVED, NOT ACCEPTED
106
$323,037
55
$269,395
7
$234,154
0
$0
14
$352,266
1
$89,190
APPLICATIONS DENIED
100
$363,813
149
$339,216
23
$180,200
3
$457,393
34
$350,983
1
$111,150
APPLICATIONS WITHDRAWN
73
$335,007
120
$311,219
14
$240,905
3
$758,330
15
$351,991
0
$0
FILES CLOSED FOR INCOMPLETENESS
26
$347,739
36
$281,428
3
$34,360
0
$0
5
$476,168
0
$0
Aggregated Statistics For Year 2004 (Based on 10 partial tracts)
A) FHA, FSA/RHS & VA Home Purchase Loans
B) Conventional Home Purchase Loans
C) Refinancings
D) Home Improvement Loans
E) Loans on Dwellings For 5+ Families
F) Non-occupant Loans on < 5 Family Dwellings (A B C & D)
Number
Average Value
Number
Average Value
Number
Average Value
Number
Average Value
Number
Average Value
Number
Average Value
LOANS ORIGINATED
0
$0
228
$275,298
439
$268,646
30
$192,642
55
$946,620
79
$278,586
APPLICATIONS APPROVED, NOT ACCEPTED
1
$137,220
35
$321,924
74
$267,925
5
$172,024
1
$428,730
21
$254,910
APPLICATIONS DENIED
0
$0
46
$270,443
174
$284,843
21
$190,019
3
$454,150
26
$257,581
APPLICATIONS WITHDRAWN
0
$0
60
$318,752
115
$242,125
17
$128,839
3
$564,830
13
$276,782
FILES CLOSED FOR INCOMPLETENESS
0
$0
12
$350,856
43
$309,759
3
$142,130
0
$0
3
$316,977
Aggregated Statistics For Year 2003 (Based on 10 partial tracts)
A) FHA, FSA/RHS & VA Home Purchase Loans
B) Conventional Home Purchase Loans
C) Refinancings
D) Home Improvement Loans
E) Loans on Dwellings For 5+ Families
F) Non-occupant Loans on < 5 Family Dwellings (A B C & D)
Number
Average Value
Number
Average Value
Number
Average Value
Number
Average Value
Number
Average Value
Number
Average Value
LOANS ORIGINATED
0
$0
216
$231,971
809
$203,360
27
$107,815
61
$1,416,080
111
$230,445
APPLICATIONS APPROVED, NOT ACCEPTED
1
$329,330
42
$219,286
135
$210,735
1
$194,850
0
$0
28
$224,228
APPLICATIONS DENIED
0
$0
45
$203,805
170
$229,137
16
$57,672
3
$1,111,293
18
$261,960
APPLICATIONS WITHDRAWN
1
$307,370
39
$217,081
209
$245,395
11
$26,002
3
$767,880
23
$433,753
FILES CLOSED FOR INCOMPLETENESS
1
$278,560
15
$257,833
32
$177,033
1
$38,390
1
$1,343,790
3
$174,040
Aggregated Statistics For Year 2002 (Based on 4 partial tracts)
A) FHA, FSA/RHS & VA Home Purchase Loans
B) Conventional Home Purchase Loans
C) Refinancings
D) Home Improvement Loans
E) Loans on Dwellings For 5+ Families
F) Non-occupant Loans on < 5 Family Dwellings (A B C & D)
Number
Average Value
Number
Average Value
Number
Average Value
Number
Average Value
Number
Average Value
Number
Average Value
LOANS ORIGINATED
5
$228,370
128
$213,031
282
$194,046
6
$77,765
24
$1,288,181
39
$223,114
APPLICATIONS APPROVED, NOT ACCEPTED
0
$0
21
$171,476
40
$193,900
1
$42,090
0
$0
0
$0
APPLICATIONS DENIED
0
$0
33
$165,904
54
$205,570
7
$60,563
7
$1,856,979
2
$122,985
APPLICATIONS WITHDRAWN
1
$306,000
21
$156,928
66
$197,996
2
$33,655
3
$1,224,003
5
$167,014
FILES CLOSED FOR INCOMPLETENESS
0
$0
8
$202,404
15
$230,485
0
$0
0
$0
0
$0
Aggregated Statistics For Year 2001 (Based on 4 partial tracts)
A) FHA, FSA/RHS & VA Home Purchase Loans
B) Conventional Home Purchase Loans
C) Refinancings
D) Home Improvement Loans
E) Loans on Dwellings For 5+ Families
F) Non-occupant Loans on < 5 Family Dwellings (A B C & D)
Number
Average Value
Number
Average Value
Number
Average Value
Number
Average Value
Number
Average Value
Number
Average Value
LOANS ORIGINATED
4
$220,238
114
$175,298
208
$181,715
10
$45,331
13
$893,843
26
$173,267
APPLICATIONS APPROVED, NOT ACCEPTED
1
$153,690
15
$226,984
36
$156,958
5
$81,424
0
$0
4
$181,310
APPLICATIONS DENIED
3
$184,790
26
$161,442
67
$170,550
13
$60,319
0
$0
10
$191,675
APPLICATIONS WITHDRAWN
0
$0
22
$151,232
51
$192,060
5
$47,682
1
$1,646,640
4
$143,232
FILES CLOSED FOR INCOMPLETENESS
0
$0
5
$96,514
12
$178,561
0
$0
5
$1,578,578
2
$132,485
Aggregated Statistics For Year 2000 (Based on 4 partial tracts)
A) FHA, FSA/RHS & VA Home Purchase Loans
B) Conventional Home Purchase Loans
C) Refinancings
D) Home Improvement Loans
E) Loans on Dwellings For 5+ Families
F) Non-occupant Loans on < 5 Family Dwellings (A B C & D)
Number
Average Value
Number
Average Value
Number
Average Value
Number
Average Value
Number
Average Value
Number
Average Value
LOANS ORIGINATED
9
$176,130
99
$158,537
59
$156,835
10
$43,058
13
$588,365
10
$182,026
APPLICATIONS APPROVED, NOT ACCEPTED
1
$253,860
14
$197,088
9
$145,903
6
$45,597
0
$0
1
$150,940
APPLICATIONS DENIED
1
$408,920
19
$149,166
35
$132,647
6
$26,833
1
$1,886,780
1
$165,240
APPLICATIONS WITHDRAWN
0
$0
17
$125,689
25
$138,758
2
$25,675
0
$0
0
$0
FILES CLOSED FOR INCOMPLETENESS
0
$0
12
$146,880
13
$164,796
1
$13,720
4
$1,430,175
3
$217,723
Aggregated Statistics For Year 1999 (Based on 3 partial tracts)
A) FHA, FSA/RHS & VA Home Purchase Loans
B) Conventional Home Purchase Loans
C) Refinancings
D) Home Improvement Loans
E) Loans on Dwellings For 5+ Families
F) Non-occupant Loans on < 5 Family Dwellings (A B C & D)
2005 - 2018 National Fire Incident Reporting System (NFIRS) incidents
Based on the data from the years 2005 - 2018 the average number of fire incidents per year is 40. The highest number of reported fires - 54 took place in 2016, and the least - 25 in 2010. The data has a declining trend.
When looking into fire subcategories, the most reports belonged to: Structure Fires (44.7%), and Mobile Property/Vehicle Fires (26.8%).
Fire incident types reported to NFIRS in Zip Code 91502


 Nearest zip codes: 91506, 91201, 91501, 91504, 91505, 91202.


 Based on the data from the years 2005 - 2018 the average number of fire incidents per year is 40. The highest number of reported fires - 54 took place in 2016, and the least - 25 in 2010. The data has a declining trend.
 When looking into fire subcategories, the most reports belonged to: Structure Fires (44.7%), and Mobile Property/Vehicle Fires (26.8%).