Downtown Burbank (Downtown) neighborhood in Burbank, California (CA), 91501, 91502 detailed profile
Settings
X

Business Search - 14 Million verified businesses
Area: 0.281 square miles
Population: 4,304
Population density:
| Downtown Burbank (Downtown): | 15,307 people per square mile |
| Burbank: | 5,990 people per square mile |

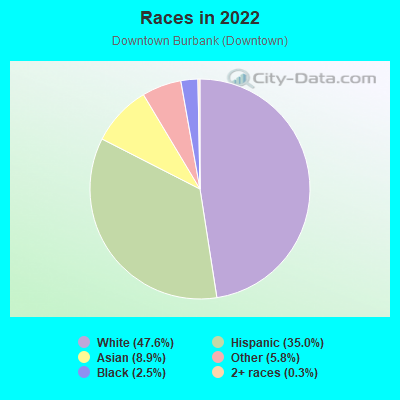
- 2,74847.6%White
- 2,02535.0%Hispanic or Latino
- 5128.9%Asian
- 3335.8%Some other race
- 1442.5%Black
- 170.3%Two or more races
Distribution of median household income
![Distribution of median household income]()
- 217Less than $10,000
- 1,115$10,000 to $19,999
- 547$20,000 to $29,999
- 388$30,000 to $39,999
- 200$40,000 to $49,999
- 108$50,000 to $59,999
- 223$60,000 to $74,999
- 31$75,000 to $99,999
- 145$100,000 to $124,999
- 117$125,000 to $149,999
- 100$150,000 to $199,999
- 252$200,000 or more

Distribution of owner-occupied house/condo value
![Distribution of owner-occupied house/condo value]()
- 13$300,000 to $399,999
- 4$400,000 to $499,999
- 263$500,000 to $749,999
- 138$750,000 to $999,999
- 288$1,000,000 or more

Distribution of rent paid by renters
![Distribution of rent paid by renters]()
- 147$100 to $199
- 280$200 to $299
- 1,073$300 to $399
- 397$400 to $499
- 321$500 to $599
- 4$700 to $799
- 4$900 to $999
- 168$1,000 to $1,249
- 761$1,250 to $1,499
- 269$1,500 to $1,999
- 375$2,000 or more

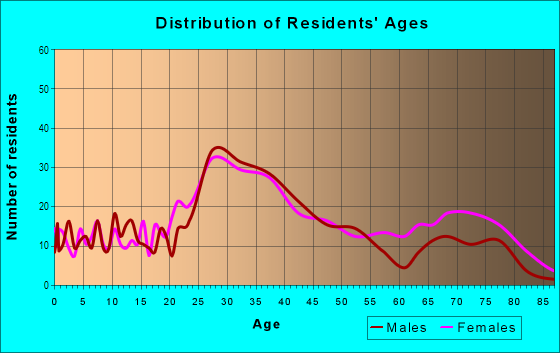
| Males: | 2,127 |
| Females: | 2,176 |
Males:
| This neighborhood: | 38.4 years |
| Whole city: | 36.7 years |
| This neighborhood: | 52.0 years |
| Whole city: | 42.1 years |
Average household size:
| Downtown Burbank (Downtown): | 2.0 people |
| Burbank: | 2.4 people |
Percentage of family households:
| Downtown Burbank (Downtown): | 36.6% |
| Burbank: | 43.5% |
| Here: | 33.2% |
| Burbank: | 40.3% |
Percentage of married-couple families with children (among all households):
| Downtown Burbank (Downtown): | 26.5% |
| Burbank: | 32.8% |
Percentage of single-mother households (among all households):
| Downtown Burbank (Downtown): | 34.1% |
| Burbank: | 7.0% |
Percentage of never married males 15 years old and over:
Percentage of never married females 15 years old and over:
| Downtown Burbank (Downtown): | 20.5% |
| Burbank: | 20.3% |
Percentage of never married females 15 years old and over:
| Downtown Burbank (Downtown): | 11.4% |
| city: | 18.6% |
Percentage of people that speak English not well or not at all:
| Downtown Burbank (Downtown): | 17.4% |
| Burbank: | 5.9% |
Percentage of people born in this state:
Percentage of people born in another U.S. state:
Percentage of native residents but born outside the U.S.:
Percentage of foreign born residents:
| Here: | 36.8% |
| Burbank: | 50.1% |
Percentage of people born in another U.S. state:
| Downtown Burbank (Downtown): | 15.8% |
| Burbank: | 21.2% |
Percentage of native residents but born outside the U.S.:
| Here: | 1.0% |
| city: | 1.2% |
Percentage of foreign born residents:
| Here: | 46.3% |
| Burbank: | 27.4% |
Owner-occupied
Renter-occupied

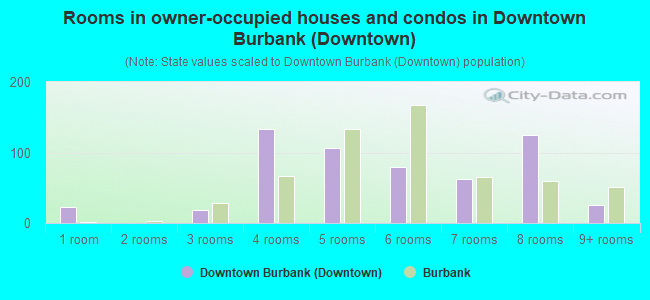
- Rooms in owner-occupied houses and condos in Downtown Burbank <
> - 221 room
- 02 rooms
- 193 rooms
- 1334 rooms
- 1075 rooms
- 806 rooms
- 637 rooms
- 1258 rooms
- 269+ rooms
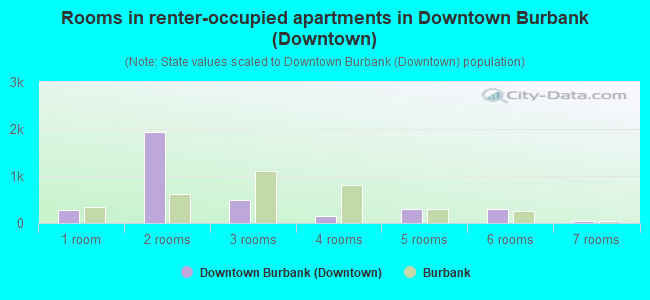
- Rooms in renter-occupied apartments in Downtown Burbank <
> - 2671 room
- 1,9442 rooms
- 4853 rooms
- 1454 rooms
- 3075 rooms
- 3066 rooms
- 337 rooms
- 08 rooms
- 09+ rooms
Owner-occupied
Renter-occupied
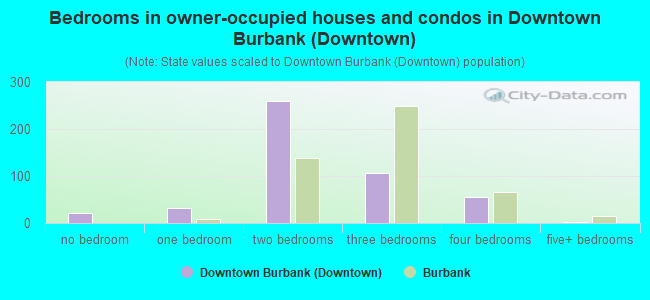
- Bedrooms in owner-occupied houses and condos in Downtown Burbank <
> - 22no bedroom
- 311 bedroom
- 2592 bedrooms
- 1063 bedrooms
- 554 bedrooms
- 35+ bedrooms
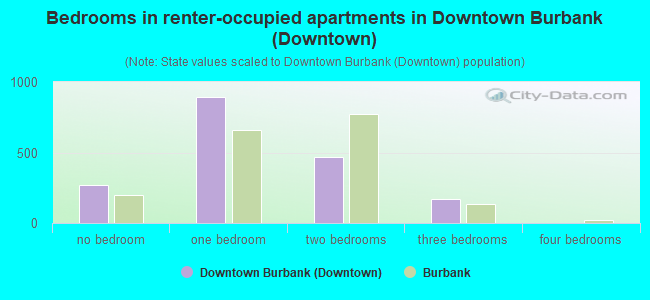
- Bedrooms in renter-occupied apartments in Downtown Burbank <
> - 267no bedroom
- 8931 bedroom
- 4712 bedrooms
- 1703 bedrooms
- 04 bedrooms
- 05+ bedrooms
Average number of cars or other vehicles available in houses/condos:
Average number of cars or other vehicles available in apartments:
| This neighborhood: | 2.3 |
| Burbank: | 2.1 |
Average number of cars or other vehicles available in apartments:
| Here: | 2.6 |
| city: | 1.3 |
Percentage of units with a mortgage:
| Downtown Burbank (Downtown): | 54.4% |
| Burbank: | 73.7% |
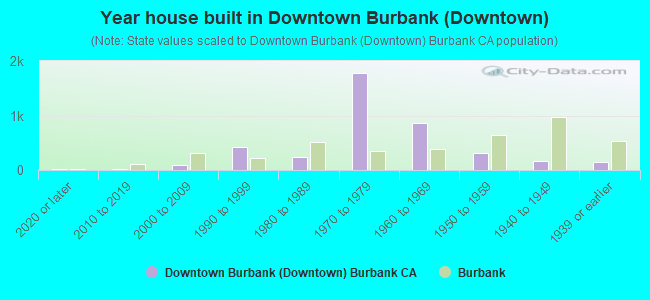
- Year house built in Downtown Burbank <
> - 192020 or later
- 262010 to 2019
- 852000 to 2009
- 4311990 to 1999
- 2461980 to 1989
- 1,7741970 to 1979
- 8591960 to 1969
- 3081950 to 1959
- 1641940 to 1949
- 1551939 or earlier
City-data.com crime index for city in 2020 (higher means more crime):
| City: | 164.4 |
| U.S. average: | 219.5 |
Travel time to work (commute)
![Travel time to work (commute)]()
- 42Less than 5 minutes
- 275 to 9 minutes
- 6310 to 14 minutes
- 6515 to 19 minutes
- 7620 to 24 minutes
- 3625 to 29 minutes
- 5630 to 34 minutes
- 4535 to 39 minutes
- 3340 to 44 minutes
- 12745 to 59 minutes
- 2560 to 89 minutes
- 590 or more minutes

Means of transportation to work
![Means of transportation to work]()
- 50.0%744Drove a car alone
- 8.5%127Carpooled
- 0.2%3Subway or elevated rail
- 7.1%106Motorcycle
- 0.5%8Bicycle
- 8.8%131Walked
- 3.2%48Other means
- 30.2%449Worked at home

Time leaving home to go to work
![Time leaving home to go to work]()
- 1912:00 a.m. to 4:59 a.m.
- 265:00 a.m. to 5:29 a.m.
- 85:30 a.m. to 5:59 a.m.
- 306:00 a.m. to 6:29 a.m.
- 316:30 a.m. to 6:59 a.m.
- 437:00 a.m. to 7:29 a.m.
- 317:30 a.m. to 7:59 a.m.
- 948:00 a.m. to 8:29 a.m.
- 768:30 a.m. to 8:59 a.m.
- 899:00 a.m. to 9:59 a.m.
- 3110:00 a.m. to 10:59 a.m.
- 1411:00 a.m. to 11:59 a.m.
- 2812:00 p.m. to 3:59 p.m.
- 244:00 p.m. to 11:59 p.m.

Occupations of males:
- Percentage of males in management occupations (except farmers):
Here: 7.4% city: 12.9%
- Percentage of males in business and financial operations occupations:
Here: 10.2% city: 6.1%
- Percentage of males in arts, design, entertainment, sports, and media occupations:
Here: 22.3% city: 18.9%
- Percentage of males in healthcare practitioners and technical occupations:
Here: 7.4% city: 3.0%
- Percentage of males in service occupations:
Here: 7.4% city: 11.2%
- Percentage of males in sales and office occupations:
Here: 20.1% city: 14.1%
- Percentage of males in production occupations:
Here: 2.6% city: 4.8%
- Percentage of males in transportation occupations:
Here: 1.6% city: 4.5%
- Percentage of males in material moving occupations:
Here: 12.6% city: 1.8%
Occupations of females:
- Percentage of females in management occupations (except farmers):
Here: 4.8% city: 13.3%
- Percentage of females in business and financial operations occupations:
Here: 2.4% city: 8.3%
- Percentage of females in computer and mathematical occupations:
Here: 4.6% city: 1.8%
- Percentage of females in architecture and engineering occupations:
Here: 1.1% city: 0.6%
- Percentage of females in life, physical, and social science occupations:
Here: 4.2% city: 1.1%
- Percentage of females in education, training, and library occupations:
Here: 8.8% city: 7.5%
- Percentage of females in arts, design, entertainment, sports, and media occupations:
Here: 19.7% city: 11.3%
- Percentage of females in healthcare practitioners and technical occupations:
Here: 2.9% city: 7.1%
- Percentage of females in service occupations:
Here: 14.1% city: 17.4%
- Percentage of females in sales and office occupations:
Here: 34.4% city: 24.6%
- Percentage of females in material moving occupations:
Here: 2.7% city: 1.3%
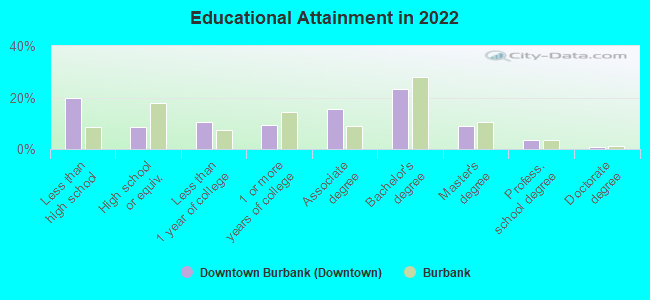
Education in this neighborhood (subdivision or community):
- Percentage of people 3 years and older in K-12 schools:
Downtown Burbank (Downtown): 10.7% Burbank: 13.3%
- Percentage of people 3 years and older in undergraduate colleges:
Downtown Burbank (Downtown): 17.1% Burbank: 5.8%
- Percentage of people 3 years and older in grad. or professional schools:
Downtown Burbank (Downtown): 5.2% Burbank: 2.1%
- Percentage of students K-12 enrolled in private schools:
Downtown Burbank (Downtown): 2.0% Burbank: 10.0%
Percentage of population below poverty level:
| Downtown Burbank (Downtown): | 30.8% |
| Burbank: | 9.5% |
Median year owner moved in (as recorded in 2022):
Median year renter moved in (as recorded in 2022):
| Downtown Burbank (Downtown): | 2011 |
| Burbank: | 2005 |
Median year renter moved in (as recorded in 2022):
| Downtown Burbank (Downtown): | 2014 |
| Burbank: | 2019 |
Percentage of married-couple families with both working:
| Downtown Burbank (Downtown): | 53.8% |
| Burbank: | 68.2% |
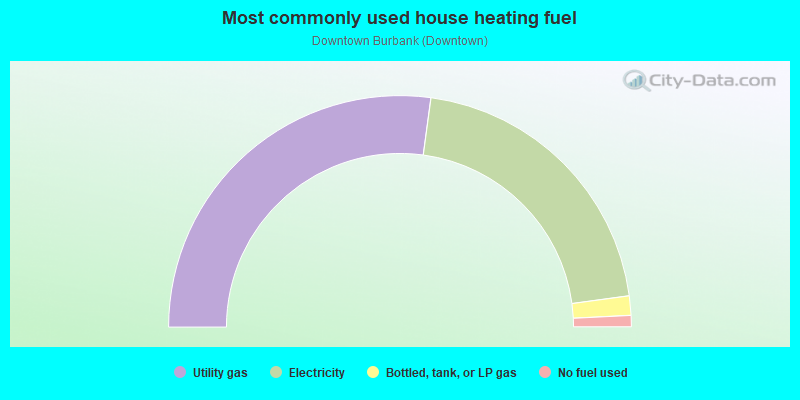
- 54.3%Utility gas
- 41.4%Electricity
- 2.7%Bottled, tank, or LP gas
- 1.6%No fuel used
Limited-access highways (interstate or state) in this neighborhood:
I- 5 (Golden State Fwy)
Length: 0.68 miles
Direction: SE-NW
Direction: SE-NW
Highways in this neighborhood:
San Fernando Rd (N San Fernando Blvd)
Length: 0.42 miles
Direction: SE-NW
Address range: 100 to 399
Direction: SE-NW
Address range: 100 to 399
N 1st St
Length: 0.26 miles
Direction: SE-NW
Address range: 100 to 417
Direction: SE-NW
Address range: 100 to 417
Roads and streets:
E Olive Ave
Length: 0.58 miles
Direction: SW-NE
Address range: 1 to 499
Direction: SW-NE
Address range: 1 to 499
E Angeleno Ave
Length: 0.55 miles
Directions: N-S, SE-NW, SW-NE
Address range: 1 to 498
Directions: N-S, SE-NW, SW-NE
Address range: 1 to 498
E Magnolia Blvd
Length: 0.54 miles
Direction: SW-NE
Address range: 1 to 499
Direction: SW-NE
Address range: 1 to 499
E Palm Ave
Length: 0.54 miles
Direction: SW-NE
Address range: 1 to 499
Direction: SW-NE
Address range: 1 to 499
E Orange Grove Ave
Length: 0.54 miles
Direction: SW-NE
Address range: 1 to 499
Direction: SW-NE
Address range: 1 to 499
E Tujunga Ave
Length: 0.51 miles
Direction: SW-NE
Address range: 1 to 499
Direction: SW-NE
Address range: 1 to 499
N Bonnywood Pl
Length: 0.30 miles
Directions: SE-NW, SW-NE
Address range: 126 to 399
Directions: SE-NW, SW-NE
Address range: 126 to 399
N Front St
Length: 0.26 miles
Direction: SE-NW
Address range: 100 to 399
Direction: SE-NW
Address range: 100 to 399
N Glenoaks Blvd
Length: 0.26 miles
Direction: SE-NW
Address range: 100 to 399
Direction: SE-NW
Address range: 100 to 399
N 5th St
Length: 0.26 miles
Direction: SE-NW
Address range: 100 to 399
Direction: SE-NW
Address range: 100 to 399
N 3rd St
Length: 0.25 miles
Direction: SE-NW
Address range: 100 to 399
Direction: SE-NW
Address range: 100 to 399
S 5th St
Length: 0.21 miles
Direction: SE-NW
Address range: 100 to 349
Direction: SE-NW
Address range: 100 to 349
S 3rd St
Length: 0.21 miles
Direction: SE-NW
Address range: 100 to 349
Direction: SE-NW
Address range: 100 to 349
S Glenoaks Blvd
Length: 0.21 miles
Direction: SE-NW
Address range: 100 to 349
Direction: SE-NW
Address range: 100 to 349
S 1st St
Length: 0.17 miles
Direction: SE-NW
Address range: 100 to 299
Direction: SE-NW
Address range: 100 to 299
S Front St
Length: 0.13 miles
Direction: SE-NW
Address range: 100 to 251
Direction: SE-NW
Address range: 100 to 251
S Bonnywood Pl
Length: 0.08 miles
Direction: SE-NW
Address range: 126 to 299
Direction: SE-NW
Address range: 126 to 299
W Magnolia Blvd (Magnolia Blvd)
Length: 0.07 miles
Direction: SW-NE
Address range: 1 to 99
Direction: SW-NE
Address range: 1 to 99
W Olive Ave
Length: 0.04 miles
Direction: SW-NE
Address range: 1 to 33
Direction: SW-NE
Address range: 1 to 33
Railroad features:
Southern Pacific RR
Length: 0.26 miles
Direction: SE-NW
Direction: SE-NW