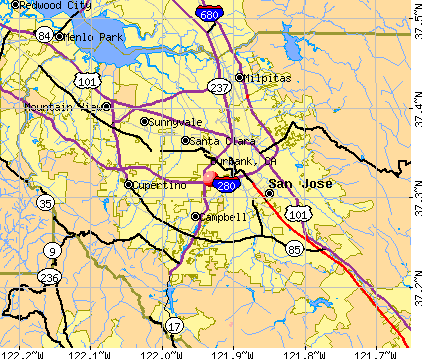
Burbank, California
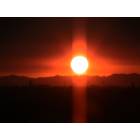
Burbank: sunset over Burbank
Burbank: Burbank
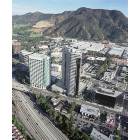
Burbank: Burbank Media Center Looking Southeast
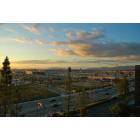
Burbank: A shot of the airport from our room at the Hilton.
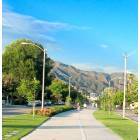
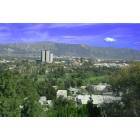
Burbank: View of the Verdugo Mountains from the Chandler Boulevard Bikeway in Burbank, CA
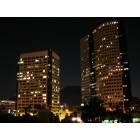
Burbank: The 2 buildings next to the 134
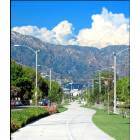
Burbank: Chandler Boulevard Bikeway in Chandler Park, Burbank
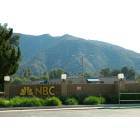
Burbank: NBC Studios in Burbank, CA.
Burbank: Warner Brothers Studio
Burbank
Burbank: The Motion Picture and Television Fund Building
- see
17
more - add
your
Submit your own pictures of this city and show them to the world
- OSM Map
- General Map
- Google Map
- MSN Map
Population change since 2000: +3.6%
 |
| Males: 52,616 | |
| Females: 51,304 |
| Median resident age: | 39.1 years |
| California median age: | 37.9 years |
Zip codes: 91501, 91502, 91504, 91505, 91506, 91605.
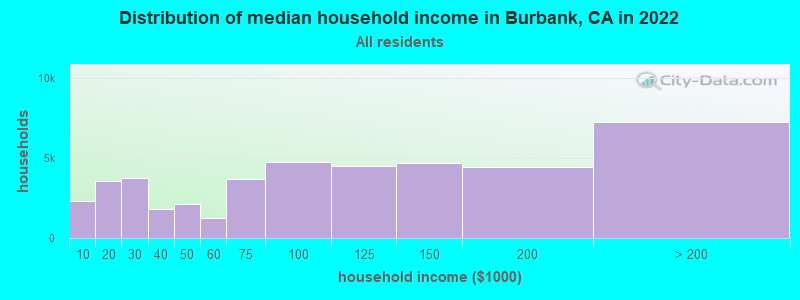
Burbank Zip Code Map| Burbank: | $92,581 |
| CA: | $91,551 |
Estimated per capita income in 2022: $52,368 (it was $25,713 in 2000)
Burbank city income, earnings, and wages data
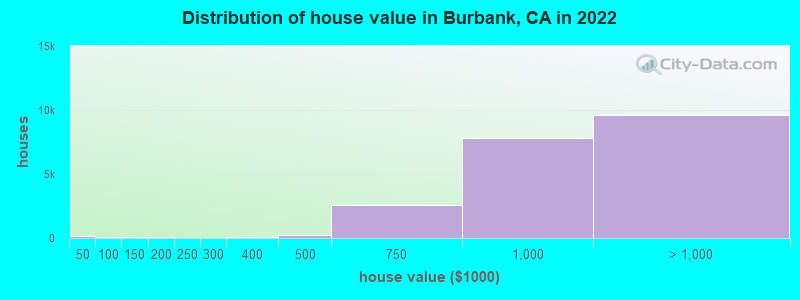
Estimated median house or condo value in 2022: over $1,000,000 (it was $249,200 in 2000)
| Burbank: | over $1,000,000 |
| CA: | $715,900 |
Mean prices in 2022: all housing units: over $1,000,000; detached houses: over $1,000,000; townhouses or other attached units: $854,862; in 2-unit structures: $802,678; in 3-to-4-unit structures: over $1,000,000; in 5-or-more-unit structures: $654,703; mobile homes: $775,038
Median gross rent in 2022: $1,973.
(11.4% for White Non-Hispanic residents, 29.7% for Black residents, 7.6% for Hispanic or Latino residents, 19.4% for American Indian residents, 5.1% for other race residents, 8.0% for two or more races residents)
Detailed information about poverty and poor residents in Burbank, CA


Compare current foreclosures in Burbank, CA:
| Photo | Address | Area | Beds / Baths | Price | Details |
|---|---|---|---|---|---|

|
#1
Via Salerno # 33
Burbank, CA 91504
|
1,602 sq. feet
|
2 baths 4 beds |
show details | |

|
#2
W Monterey Ave
Burbank, CA 91506
|
2,349 sq. feet
|
3 baths 4 beds |
show details | |

|
#3
N Kenneth Rd
Burbank, CA 91504
|
1,819 sq. feet
|
2 baths 3 beds |
show details | |

|
#4
E Olive Ave Apt 101
Burbank, CA 91501
|
1,753 sq. feet
|
3 baths 3 beds |
show details | |

|
#5
N Parish Pl
Burbank, CA 91504
|
2,273 sq. feet
|
2 baths 3 beds |
show details | |

|
#6
Mesa Verde Dr
Burbank, CA 91504
|
2,523 sq. feet
|
3 baths 5 beds |
show details | |

|
#7
N Mariposa St
Burbank, CA 91506
|
1,030 sq. feet
|
1 baths 2 beds |
show details | |

|
#8
N Mariposa St
Burbank, CA 91506
|
1,808 sq. feet
|
2 baths 2 beds |
show details | |

|
#9
N Pepper St
Burbank, CA 91505
|
988 sq. feet
|
2 baths 2 beds |
show details | |

|
#10
E Cedar Ave
Burbank, CA 91501
|
903 sq. feet
|
1 baths 2 beds |
show details |
| Photo | Address | Area | Beds / Baths | Price | Details |
|---|---|---|---|---|---|

|
#11
N Lamer St
Burbank, CA 91506
|
1,408 sq. feet
|
2 baths 2 beds |
show details | |

|
#12
E Cedar Ave Unit 101
Burbank, CA 91501
|
2,160 sq. feet
|
3 baths 4 beds |
show details | |

|
#13
S Sunset Canyon Dr
Burbank, CA 91501
|
2,726 sq. feet
|
3 baths 3 beds |
show details | |

|
#14
N Ford St
Burbank, CA 91505
|
1,384 sq. feet
|
2 baths 2 beds |
show details | |

|
#15
E Walnut Ave
Burbank, CA 91501
|
1,383 sq. feet
|
2 baths 2 beds |
show details | |

|
#16
Wedgewood Ln
Burbank, CA 91504
|
3,951 sq. feet
|
4 baths 5 beds |
show details | |

|
#17
N Maple St
Burbank, CA 91505
|
1,461 sq. feet
|
2 baths 3 beds |
show details | |

|
#18
W Clark Ave
Burbank, CA 91505
|
1,370 sq. feet
|
2 baths 2 beds |
show details | |

|
#19
N Glenoaks Blvd
Burbank, CA 91504
|
1,083 sq. feet
|
1 baths 3 beds |
show details | |

|
#20
S Sunset Canyon Dr
Burbank, CA 91501
|
2,726 sq. feet
|
3 baths 3 beds |
show details |
| Photo | Address | Area | Beds / Baths | Price | Details |
|---|---|---|---|---|---|

|
#21
Via Milano
Burbank, CA 91504
|
1,602 sq. feet
|
3 baths 4 beds |
show details | |

|
#22
E Angeleno Ave # B
Burbank, CA 91501
|
2,124 sq. feet
|
3 baths 4 beds |
show details | |

|
#23
N Buena Vista St # B
Burbank, CA 91504
|
804 sq. feet
|
2 baths 2 beds |
show details | |

|
#24
N Rose St Unit 407
Burbank, CA 91505
|
914 sq. feet
|
2 baths 1 beds |
show details | |

|
#25
N Parish Pl
Burbank, CA 91504
|
729 sq. feet
|
2 baths 3 beds |
show details | |

|
#26
S Orchard Dr
Burbank, CA 91506
|
555 sq. feet
|
3 baths 5 beds |
show details | |

|
#27
Bloomington Ave
Burbank, CA 91504
|
1,288 sq. feet
|
2 baths 3 beds |
show details | |

|
#28
E Santa Anita Ave Unit 106
Burbank, CA 91501
|
1,865 sq. feet
|
3 baths 4 beds |
show details | |

|
#29
N Kenwood St
Burbank, CA 91505
|
1,250 sq. feet
|
2 baths 2 beds |
show details | |

|
#30
Shadyspring Pl
Burbank, CA 91504
|
1,376 sq. feet
|
1 baths 3 beds |
show details |
| Photo | Address | Area | Beds / Baths | Price | Details |
|---|---|---|---|---|---|

|
#31
W Elmwood Ave Apt C
Burbank, CA 91502
|
- sq. feet
|
- baths - beds |
show details | |

|
#32
N Pass Ave # 186
Burbank, CA 91505
|
- sq. feet
|
- baths - beds |
show details | |

|
#33
N Florence St
Burbank, CA 91505
|
- sq. feet
|
- baths - beds |
show details | |

|
#34
Scott Rd Apt 133
Burbank, CA 91504
|
- sq. feet
|
- baths - beds |
show details | |

|
#35
W Alameda Ave Apt 201
Burbank, CA 91506
|
- sq. feet
|
- baths - beds |
show details | |

|
#36
S 6th St Apt L
Burbank, CA 91501
|
- sq. feet
|
- baths - beds |
show details | |

|
#37
W Clark Ave
Burbank, CA 91506
|
- sq. feet
|
- baths - beds |
show details | |

|
#38
E Elmwood Ave Apt 209
Burbank, CA 91501
|
- sq. feet
|
- baths - beds |
show details | |

|
#39
1/2 Delaware Rd
Burbank, CA 91504
|
- sq. feet
|
- baths - beds |
show details | |

|
#40
S Mariposa St
Burbank, CA 91506
|
- sq. feet
|
- baths - beds |
show details |
| Photo | Address | Area | Beds / Baths | Price | Details |
|---|---|---|---|---|---|

|
#41
E Palm Ave Apt F
Burbank, CA 91501
|
- sq. feet
|
- baths - beds |
show details | |

|
#42
W Magnolia Blvd # 446
Burbank, CA 91505
|
- sq. feet
|
- baths - beds |
show details | |

|
#43
E Cedar Ave Apt 105
Burbank, CA 91501
|
- sq. feet
|
- baths - beds |
show details | |

|
#44
W Elmwood Ave
Burbank, CA 91506
|
- sq. feet
|
- baths - beds |
show details | |

|
#45
E Angeleno Ave Apt A
Burbank, CA 91501
|
- sq. feet
|
- baths - beds |
show details | |

|
#46
N Valley St Apt 101
Burbank, CA 91505
|
- sq. feet
|
- baths - beds |
show details | |

|
#47
N Keystone St
Burbank, CA 91506
|
- sq. feet
|
- baths - beds |
show details | |

|
#48
N Glenoaks Blvd Ste 200
Burbank, CA 91502
|
- sq. feet
|
- baths - beds |
show details | |

|
#49
N 3rd St
Burbank, CA 91502
|
- sq. feet
|
- baths - beds |
show details | |

|
Check over 1 million property listings on Foreclosure.com!
|
browse all offers | |||


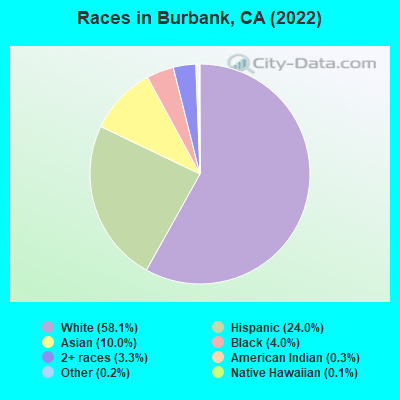
- 60,37958.1%White alone
- 24,91524.0%Hispanic
- 10,38910.0%Asian alone
- 4,1854.0%Black alone
- 3,4363.3%Two or more races
- 3150.3%American Indian alone
- 1810.2%Other race alone
- 1190.1%Native Hawaiian and Other
Pacific Islander alone
According to our research of California and other state lists, there were 58 registered sex offenders living in Burbank, California as of April 25, 2024.
The ratio of all residents to sex offenders in Burbank is 1,818 to 1.
The ratio of registered sex offenders to all residents in this city is lower than the state average.
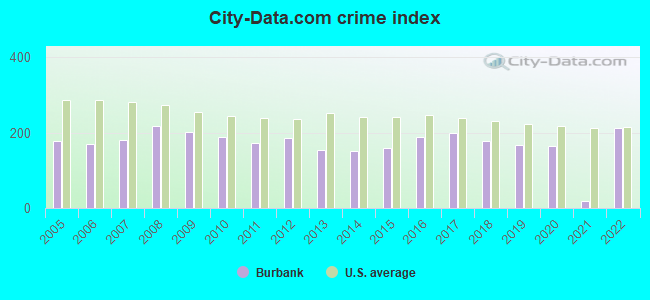
The City-Data.com crime index weighs serious crimes and violent crimes more heavily. Higher means more crime, U.S. average is 246.1. It adjusts for the number of visitors and daily workers commuting into cities.
- means the value is smaller than the state average.- means the value is about the same as the state average.
- means the value is bigger than the state average.
- means the value is much bigger than the state average.
Crime rate in Burbank detailed stats: murders, rapes, robberies, assaults, burglaries, thefts, arson
Full-time law enforcement employees in 2021, including police officers: 230 (152 officers - 134 male; 18 female).
| Officers per 1,000 residents here: | 1.49 |
| California average: | 2.30 |
 Recent articles from our blog. Our writers, many of them Ph.D. graduates or candidates, create easy-to-read articles on a wide variety of topics.


Latest news from Burbank, CA collected exclusively by city-data.com from local newspapers, TV, and radio stations
Ancestries: Armenian (12.7%), American (11.2%), English (3.6%), German (2.6%), Italian (2.5%), Irish (2.1%).
Current Local Time: PST time zone
Elevation: 598 feet
Land area: 17.3 square miles.
Population density: 5,990 people per square mile (average).
30,226 residents are foreign born (18.0% Asia, 7.8% Latin America).
| This city: | 29.0% |
| California: | 26.5% |
Median real estate property taxes paid for housing units with mortgages in 2022: $6,593 (0.6%)
Median real estate property taxes paid for housing units with no mortgage in 2022: $3,291 (0.4%)
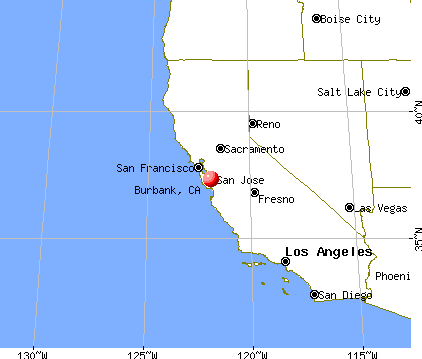
Nearest city with pop. 200,000+: Los Angeles, CA  (7.1 miles , pop. 3,694,820).
Nearest cities:
Latitude: 34.18 N, Longitude: 118.33 W
Daytime population change due to commuting: +41,773 (+40.2%)
Workers who live and work in this city: 27,794 (51.8%)
Property values in Burbank, CA
Burbank, California accommodation & food services, waste management - Economy and Business Data
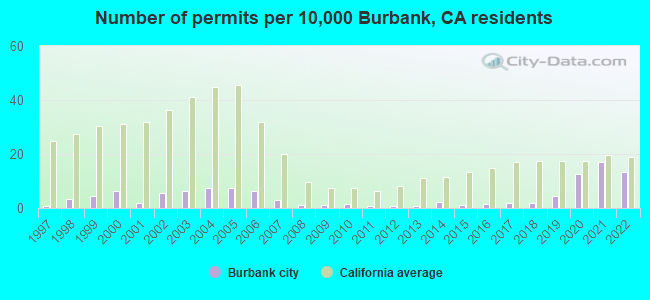
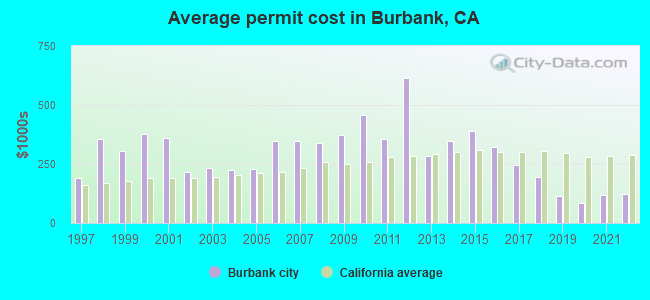
Single-family new house construction building permits:
- 2022: 135 buildings, average cost: $122,100
- 2021: 172 buildings, average cost: $118,300
- 2020: 127 buildings, average cost: $84,200
- 2019: 43 buildings, average cost: $115,700
- 2018: 17 buildings, average cost: $195,300
- 2017: 17 buildings, average cost: $247,400
- 2016: 16 buildings, average cost: $320,800
- 2015: 12 buildings, average cost: $389,900
- 2014: 22 buildings, average cost: $347,200
- 2013: 9 buildings, average cost: $284,900
- 2012: 6 buildings, average cost: $615,600
- 2011: 6 buildings, average cost: $356,600
- 2010: 15 buildings, average cost: $457,000
- 2009: 10 buildings, average cost: $372,400
- 2008: 11 buildings, average cost: $341,400
- 2007: 31 buildings, average cost: $348,500
- 2006: 62 buildings, average cost: $349,200
- 2005: 73 buildings, average cost: $227,600
- 2004: 73 buildings, average cost: $226,300
- 2003: 62 buildings, average cost: $232,100
- 2002: 55 buildings, average cost: $213,500
- 2001: 19 buildings, average cost: $360,400
- 2000: 64 buildings, average cost: $376,800
- 1999: 44 buildings, average cost: $306,600
- 1998: 34 buildings, average cost: $356,700
- 1997: 6 buildings, average cost: $190,300
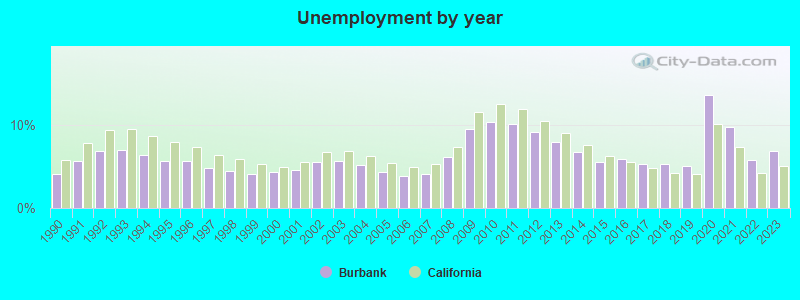
| Here: | 6.9% |
| California: | 5.1% |
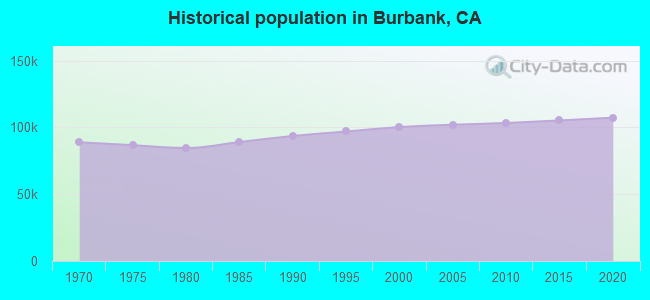
Population change in the 1990s: +6,559 (+7.0%).
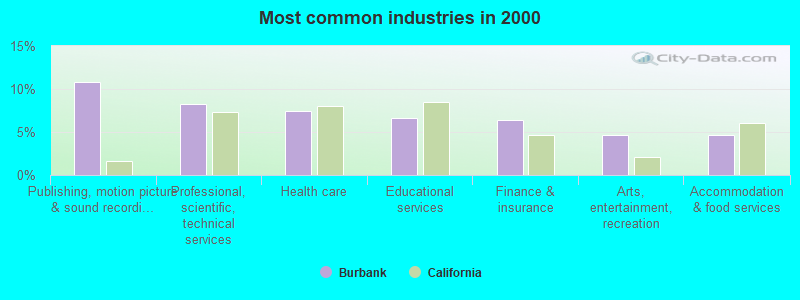
- Publishing, motion picture & sound recording industries (10.8%)
- Professional, scientific, technical services (8.3%)
- Health care (7.5%)
- Educational services (6.6%)
- Finance & insurance (6.3%)
- Arts, entertainment, recreation (4.6%)
- Accommodation & food services (4.6%)
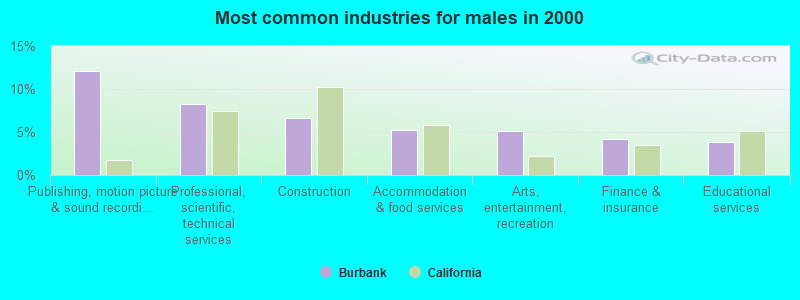
- Publishing, motion picture & sound recording industries (12.1%)
- Professional, scientific, technical services (8.3%)
- Construction (6.7%)
- Accommodation & food services (5.2%)
- Arts, entertainment, recreation (5.1%)
- Finance & insurance (4.2%)
- Educational services (3.8%)
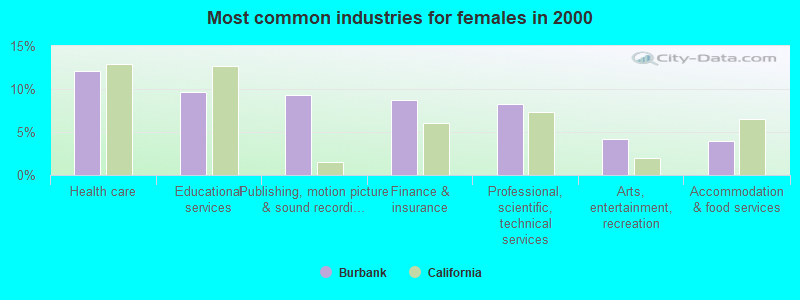
- Health care (12.0%)
- Educational services (9.7%)
- Publishing, motion picture & sound recording industries (9.3%)
- Finance & insurance (8.8%)
- Professional, scientific, technical services (8.3%)
- Arts, entertainment, recreation (4.1%)
- Accommodation & food services (4.0%)
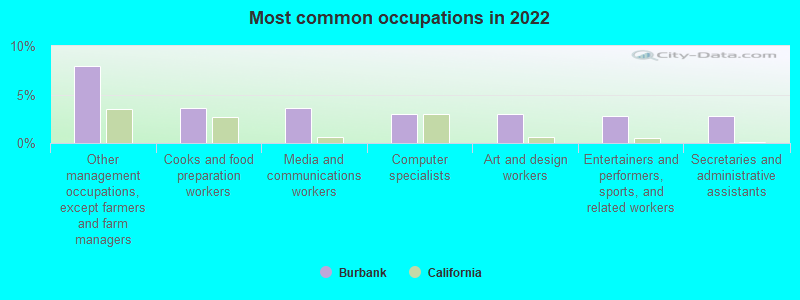
- Other management occupations, except farmers and farm managers (7.9%)
- Cooks and food preparation workers (3.6%)
- Media and communications workers (3.6%)
- Computer specialists (3.0%)
- Art and design workers (3.0%)
- Entertainers and performers, sports, and related workers (2.8%)
- Secretaries and administrative assistants (2.8%)
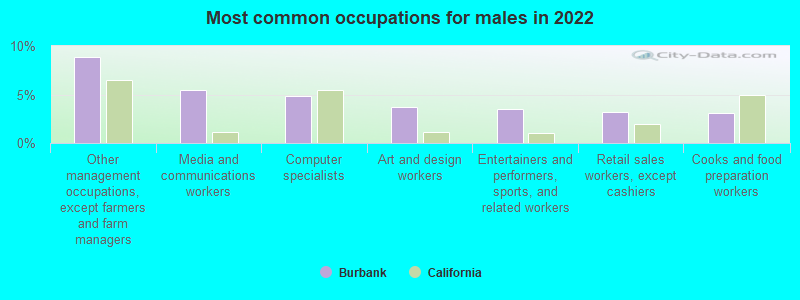
- Other management occupations, except farmers and farm managers (8.9%)
- Media and communications workers (5.5%)
- Computer specialists (4.8%)
- Art and design workers (3.7%)
- Entertainers and performers, sports, and related workers (3.5%)
- Retail sales workers, except cashiers (3.2%)
- Cooks and food preparation workers (3.1%)
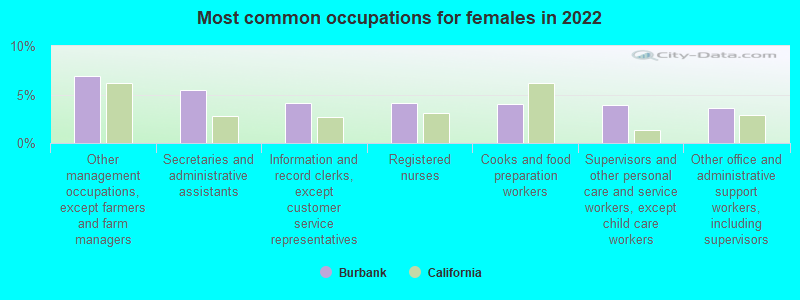
- Other management occupations, except farmers and farm managers (6.9%)
- Secretaries and administrative assistants (5.5%)
- Information and record clerks, except customer service representatives (4.1%)
- Registered nurses (4.1%)
- Cooks and food preparation workers (4.0%)
- Supervisors and other personal care and service workers, except child care workers (3.9%)
- Other office and administrative support workers, including supervisors (3.6%)
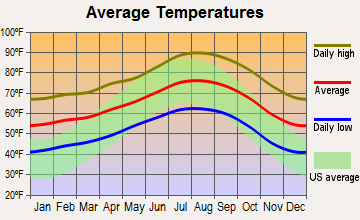
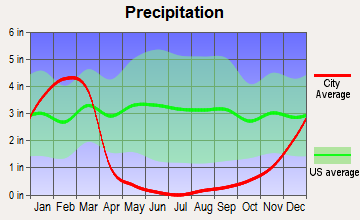
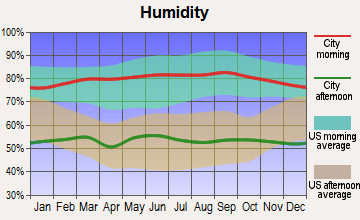
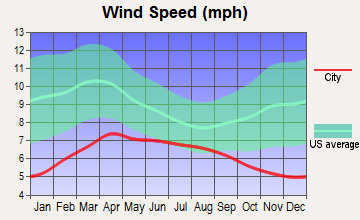
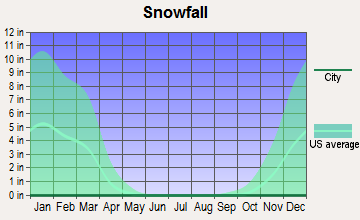
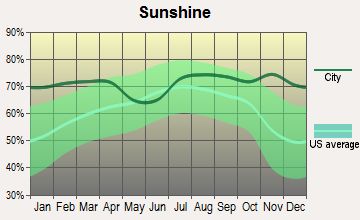
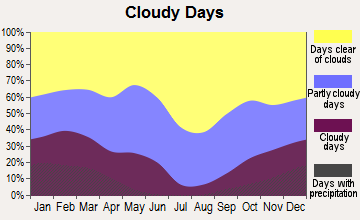
Average climate in Burbank, California
Based on data reported by over 4,000 weather stations
|
|

(lower is better)
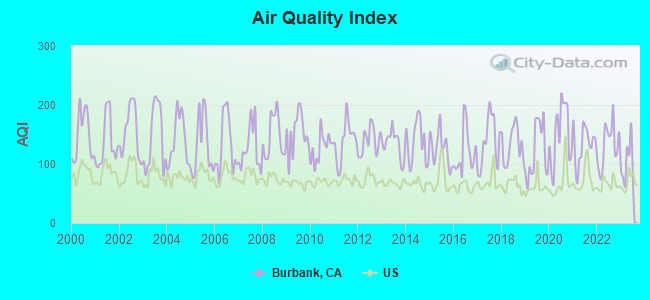
Air Quality Index (AQI) level in 2023 was 100. This is worse than average.
| City: | 100 |
| U.S.: | 73 |
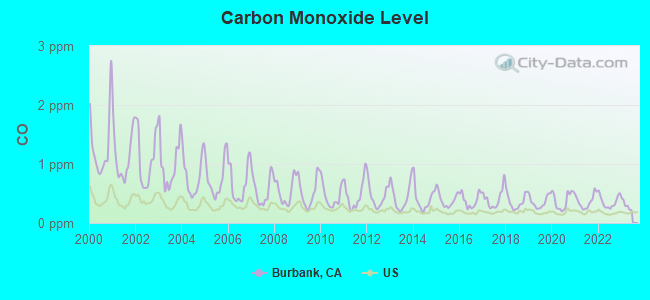
Carbon Monoxide (CO) [ppm] level in 2022 was 0.360. This is significantly worse than average. Closest monitor was 0.7 miles away from the city center.
| City: | 0.360 |
| U.S.: | 0.251 |
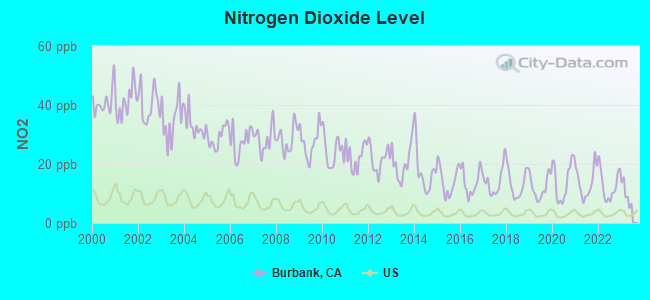
Nitrogen Dioxide (NO2) [ppb] level in 2022 was 12.9. This is significantly worse than average. Closest monitor was 0.7 miles away from the city center.
| City: | 12.9 |
| U.S.: | 5.1 |
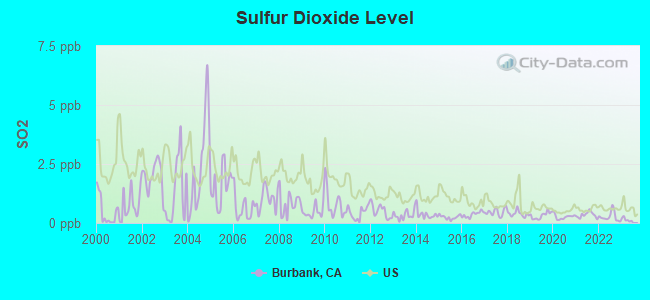
Sulfur Dioxide (SO2) [ppb] level in 2022 was 0.266. This is significantly better than average. Closest monitor was 0.7 miles away from the city center.
| City: | 0.266 |
| U.S.: | 1.515 |
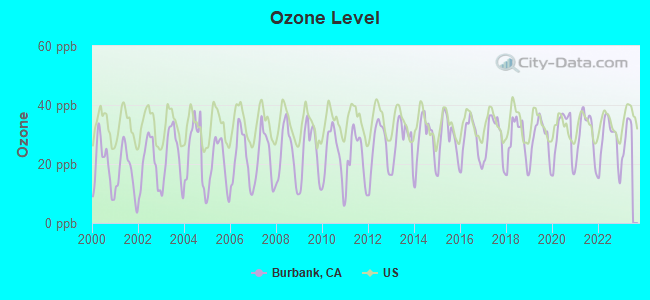
Ozone [ppb] level in 2022 was 27.7. This is better than average. Closest monitor was 0.7 miles away from the city center.
| City: | 27.7 |
| U.S.: | 33.3 |
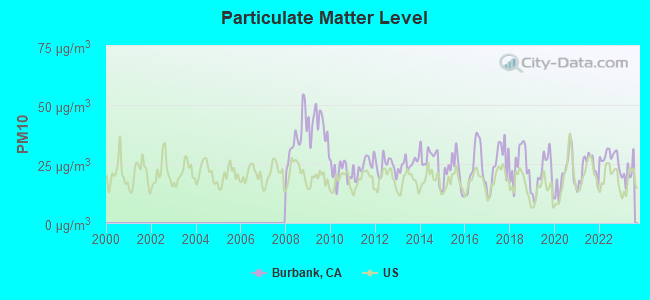
Particulate Matter (PM10) [µg/m3] level in 2023 was 21.6. This is about average. Closest monitor was 0.7 miles away from the city center.
| City: | 21.6 |
| U.S.: | 19.2 |
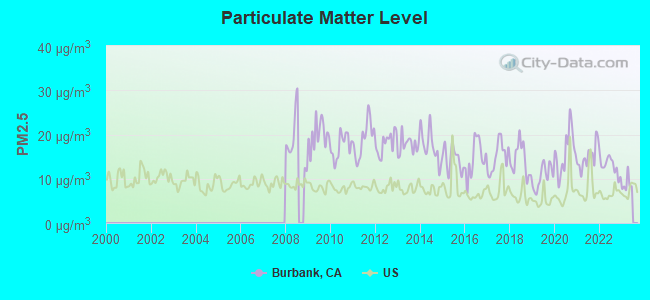
Particulate Matter (PM2.5) [µg/m3] level in 2022 was 12.9. This is significantly worse than average. Closest monitor was 0.7 miles away from the city center.
| City: | 12.9 |
| U.S.: | 8.1 |
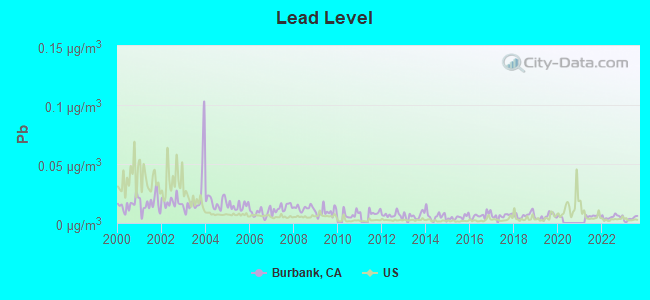
Lead (Pb) [µg/m3] level in 2023 was 0.00348. This is significantly better than average. Closest monitor was 0.1 miles away from the city center.
| City: | 0.00348 |
| U.S.: | 0.00931 |
Earthquake activity:
Burbank-area historical earthquake activity is significantly above California state average. It is 7103% greater than the overall U.S. average.On 7/21/1952 at 11:52:14, a magnitude 7.7 (7.7 UK, Class: Major, Intensity: VIII - XII) earthquake occurred 68.4 miles away from the city center, causing $50,000,000 total damage
On 6/28/1992 at 11:57:34, a magnitude 7.6 (6.2 MB, 7.6 MS, 7.3 MW, Depth: 0.7 mi) earthquake occurred 102.8 miles away from the city center, causing 3 deaths (1 shaking deaths, 2 other deaths) and 400 injuries, causing $100,000,000 total damage and $40,000,000 insured losses
On 10/16/1999 at 09:46:44, a magnitude 7.4 (6.3 MB, 7.4 MS, 7.2 MW, 7.3 ML) earthquake occurred 110.6 miles away from Burbank center
On 11/4/1927 at 13:51:53, a magnitude 7.5 (7.5 UK) earthquake occurred 162.1 miles away from Burbank center
On 1/17/1994 at 12:30:55, a magnitude 6.8 (6.4 MB, 6.8 MS, 6.7 MW, Depth: 11.4 mi, Class: Strong, Intensity: VII - IX) earthquake occurred 14.2 miles away from the city center, causing 60 deaths (60 shaking deaths) and 7000 injuries
On 4/21/1918 at 22:32:30, a magnitude 6.8 (6.8 UK) earthquake occurred 57.0 miles away from Burbank center
Magnitude types: body-wave magnitude (MB), local magnitude (ML), surface-wave magnitude (MS), moment magnitude (MW)
Natural disasters:
The number of natural disasters in Los Angeles County (57) is a lot greater than the US average (15).Major Disasters (Presidential) Declared: 27
Emergencies Declared: 3
Causes of natural disasters: Fires: 37, Floods: 16, Storms: 9, Winter Storms: 6, Landslides: 5, Mudslides: 5, Earthquakes: 3, Freeze: 1, Heavy Rain: 1, Hurricane: 1, Snow: 1, Tornado: 1, Wind: 1, Other: 1 (Note: some incidents may be assigned to more than one category).
Main business address for: LBI MEDIA HOLDINGS INC (RADIO BROADCASTING STATIONS), LBI MEDIA INC (RADIO BROADCASTING STATIONS), WALT DISNEY CO/ (SERVICES-MISCELLANEOUS AMUSEMENT & RECREATION), ALDILA INC ([3949]).
Hospitals in Burbank:
- PROVIDENCE SAINT JOSEPH MEDICAL CTR (Voluntary non-profit - Church, 501 SOUTH BUENA VISTA)
- VENCOR HOSPITAL BURBANK (466 EAST OLIVE)
Nursing Homes in Burbank:
- ALAMEDA CARE CENTER (925 W. ALAMEDA AVE.)
- BURBANK CONVALESCENT HOSPITAL (2710 W OLIVE AVE)
- BURBANK HEALTHCARE AND REHAB (1041 S. MAIN ST.)
- CYPRESS CONV CENTER (700 N FIRST ST)
- MAGNOLIA HEALTH CTR (620 NORTH FIRST STREET)
- WESLEY NURSING HOME (227 EAST GRINNELL DRIVE)
Dialysis Facilities in Burbank:
Home Health Centers in Burbank:
- A TO Z HOME HEALTH, INC (209 E ALAMEDA AVENUE, SUITE 200)
- ADVANCE HOME CARE, INC (1903 GLENOAKS ST, SUITE B)
- ASHERAH HOME HEALTH SERVICES, INC (1419 NORTH SAN FERNANDO BLVD, SUITE 210)
- CARITAS HOME HEALTH PROVIDERS, INC (209 EAST ALAMEDA AVENUE #203)
- FAITH AND HOPE HOME HEALTH, INC. (144 SOUTH FIRST ST., STE. 200A)
- HEALING WAVE HOME HEALTH AGENCY, INC (2401 WEST OLIVE AVE, STE 220)
- HOME HEALTH INTEGRATED SERVICES INC (704 SO MAIN STREET)
- MIRACLE LIFE HOME HEALTH INC (2829 N GLENOAKS BLVD)
- OUR LADY OF REFUGE HOME CARE, INC (4000 W MAGNOLIA BLVD, SUITE K)
- PRIVILEGE HOME HEALTH CARE INC (217 E ALAMEDA AVE, SUITE 215)
Airports and heliports located in Burbank:
- Bob Hope Airport (BUR) (Runways: 2, Commercial Ops: 46,102, Air Taxi Ops: 14,682, Itinerant Ops: 36,895, Local Ops: 27,432, Military Ops: 1,038)
- St Joseph Medical Center Heliport (CA95)
Colleges/Universities in Burbank:
- Woodbury University (Full-time enrollment: 1,729; Location: 7500 Glenoaks Blvd; Private, not-for-profit; Website: woodbury.edu/; Offers Master's degree)
- Marinello Schools of Beauty-Burbank (Full-time enrollment: 520; Location: 200 N. San Fernando Blvd; Private, for-profit; Website: www.marinello.com)
- Make-up Designory (Full-time enrollment: 322; Location: 129 S. San Fernando Blvd.; Private, for-profit; Website: www.mud.edu)
- Video Symphony EnterTraining Inc (Full-time enrollment: 272; Location: 266 E Magnolia Blvd; Private, for-profit; Website: www.videosymphony.com)
- CES College (Full-time enrollment: 130; Location: 401 S. Glenoaks Blvd. Suite 211; Private, not-for-profit; Website: www.cescollege.edu)
- InterCoast Colleges-Burbank (Full-time enrollment: 68; Location: 175 East Olive Avenue, 3rd Floor; Private, for-profit; Website: www.intercoast.edu)
Colleges/universities with over 2000 students nearest to Burbank:
- New York Film Academy (about 4 miles; Universal City, CA; Full-time enrollment: 4,714)
- Los Angeles Valley College (about 6 miles; Valley Glen, CA; FT enrollment: 9,459)
- Los Angeles Film School (about 6 miles; Hollywood, CA; FT enrollment: 3,189)
- Glendale Community College (about 6 miles; Glendale, CA; FT enrollment: 11,348)
- Los Angeles City College (about 7 miles; Los Angeles, CA; FT enrollment: 10,027)
- Occidental College (about 8 miles; Los Angeles, CA; FT enrollment: 2,276)
- Art Center College of Design (about 9 miles; Pasadena, CA; FT enrollment: 2,346)
Public high schools in Burbank:
- BURBANK HIGH (Students: 1,966, Location: 902 N. THIRD ST., Grades: 9-12)
- BURROUGHS HIGH (Students: 1,937, Location: 1920 CLARK AVE., Grades: 9-12)
- MONTEREY HIGH (CONTINUATION) (Students: 41, Location: 1915 MONTEREY AVE., Grades: 9-12)
- BURBANK USD COMMUNITY DAY (Students: 30, Location: 223 E. SANTA ANITA AVE., Grades: 7-12)
- MAGNOLIA PARK (Students: 18, Location: 827 AVON ST., Grades: 6-12)
- OFF CAMPUS LEARNING CENTER (Students: 5, Location: 3811 ALLAN AVE., Grades: 7-12)
- OPTIONS FOR YOUTH-BURBANK CHARTER (Location: 1610 W. BURBANK BLVD., Grades: KG-12, Charter school)
Private high schools in Burbank:
Biggest public elementary/middle schools in Burbank:
- JOHN MUIR MIDDLE (Students: 1,366, Location: 1111 N. KENNETH RD., Grades: 6-8)
- DAVID STARR JORDAN MIDDLE (Students: 1,161, Location: 420 S. MARIPOSA ST., Grades: 6-8)
- LUTHER BURBANK MIDDLE (Students: 956, Location: 3700 W. JEFFRIES AVE., Grades: 6-8)
- JOAQUIN MILLER ELEMENTARY (Students: 489, Location: 720 E. PROVIDENCIA AVE., Grades: KG-5)
- THOMAS JEFFERSON ELEMENTARY (Students: 485, Location: 1900 N. SIXTH ST., Grades: KG-5)
- BRET HARTE ELEMENTARY (Students: 421, Location: 3200 W. JEFFRIES AVE., Grades: KG-5)
- THOMAS EDISON ELEMENTARY (Students: 384, Location: 2110 W. CHESTNUT ST., Grades: KG-5)
- THEODORE ROOSEVELT ELEMENTARY (Students: 353, Location: 850 N. CORDOVA ST., Grades: KG-5)
- RALPH EMERSON ELEMENTARY (Students: 348, Location: 720 E. CYPRESS AVE., Grades: KG-5)
- GEORGE WASHINGTON ELEMENTARY (Students: 323, Location: 2322 N. LINCOLN ST., Grades: KG-5)
Private elementary/middle schools in Burbank:
- ST FINBAR PARISH SCHOOL (Students: 304, Location: 2120 W OLIVE AVE, Grades: KG-8)
- ST FRANCIS XAVIER SCHOOL (Students: 282, Location: 3601 SCOTT RD, Grades: KG-8)
- ST ROBERT BELLARMINE ELEMENTARY SCHOOL (Students: 205, Location: 154 N 5TH ST, Grades: KG-8)
- LITTLE ANGELS (Students: 46, Location: 721 S SAN FERNANDO BLVD, Grades: KG-2)
- FIRST LUTHERAN SCHOOL (Students: 42, Location: 1001 S GLENOAKS BLVD, Grades: PK-5)
User-submitted facts and corrections:
- KFI,KIIS,KTLK,KBIG,KOST, are all ClearChannel radio stations
Points of interest:
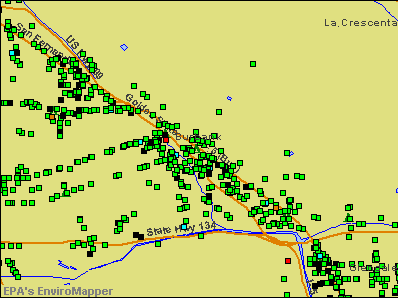
Notable locations in Burbank: Jefferson Avenue Pumping Station (A), City of Burbank Valley Pumping Plant (B), Disney Studios (C), Columbia Ranch (D), Warner Brothers Studios (E), NBC-TV Studios (F), De Bell Municipal Golf Course (G), Southern California Genealogical Society Library (H), Northwest Park Branch Burbank Public Library (I), Burbank Public Library (J), Buena Vista Branch Burbank Public Library (K), Burbank City Hall (L), Warner Brothers Studios Fire Department (M), City of Burbank Fire Department Station 14 (N), City of Burbank Fire Department Station 16 (O), Bob Hope Airport Fire Department (P), Walt Disney Studios Fire Department (Q), City of Burbank Fire Department Station 11 Headquarters (R), City of Burbank Fire Department Station 15 (S), City of Burbank Fire Department Station 12 (T). Display/hide their locations on the map
Shopping Center: Rancho Marketplace Shopping Center (1). Display/hide its location on the map
Main business address in Burbank include: LBI MEDIA HOLDINGS INC (A), LBI MEDIA INC (B), WALT DISNEY CO/ (C). Display/hide their locations on the map
Churches in Burbank include: Magnolia Park Community Methodist Church (A), Saint Finbars Church (B), Calvary Baptist Church (C), Second Church of Christ Scientist (D), Valley Baptist Church (E), Valley Community Church (F), Westminster Presbyterian Church (G), Central Baptist Church (H), Emmanuel Church (I). Display/hide their locations on the map
Parks in Burbank include: Brace Canyon Park (1), McCambridge Park (2), Mountain View Park (3), Olive Avenue Recreation Center (4), Pacific Park (5), Stough Park (6), Valley Park (7), Verdugo Recreation Center (8), Vickroy Park (9). Display/hide their locations on the map
Tourist attractions: Burbank Historical Society (Cultural Attractions- Events- & Facilities; 1015 West Olive Avenue) (1), All Amusement Fun Center (Amusement & Theme Parks; 201 East Magnolia Boulevard Suite 128) (2). Display/hide their approximate locations on the map
Hotels: Anabelle Hotel (2011 West Olive Avenue) (1), Best Western (3410 Riverside Drive) (2). Display/hide their approximate locations on the map
Birthplace of: Ryan Lavarnway - Baseball player, Bonnie Raitt - Alternative country singer, John Ritter - (1948-2003), actor, Dave Goelz - Voice actor, Jamie Dixon - Basketball player-coach, Wil Wheaton - (1972-) TV child actor, writer, Clint Howard - Child actor, Andrew Gold - Singer, Tim Burton - (born 1958), film director, David C. Lane - professor.
Drinking water stations with addresses in Burbank and their reported violations in the past:
COUNTRY HAVEN MOBILE HOME PARK (Serves MS, Population served: 666, Groundwater):Past monitoring violations:ANOKA ACRES MOBILE HOME PARK (Serves IN, Population served: 221, Groundwater):
- 83 regular monitoring violations
Past health violations:Past monitoring violations:
- MCL, Monthly (TCR) - In APR-2014, Contaminant: Coliform. Follow-up actions: St Violation/Reminder Notice (APR-17-2014), St Public Notif requested (APR-17-2014), St Compliance achieved (APR-17-2014), St Boil Water Order (APR-17-2014)
- Monitoring, Source Water (GWR) - In APR-22-2014, Contaminant: E. COLI. Follow-up actions: St Violation/Reminder Notice (APR-17-2014), St Public Notif requested (APR-17-2014)
- Follow-up Or Routine LCR Tap M/R - In OCT-01-2012, Contaminant: Lead and Copper Rule. Follow-up actions: St Public Notif requested (DEC-18-2012), St Violation/Reminder Notice (2 times from DEC-18-2012 to FEB-28-2013), St Public Notif received (APR-08-2013)
- Follow-up Or Routine LCR Tap M/R - In OCT-01-2011, Contaminant: Lead and Copper Rule. Follow-up actions: St Public Notif requested (DEC-08-2011), St Violation/Reminder Notice (2 times from DEC-08-2011 to FEB-28-2013), St Public Notif received (APR-08-2013), St Compliance achieved (NOV-21-2013)
Drinking water stations with addresses in Burbank that have no violations reported:
| This city: | 2.5 people |
| California: | 2.9 people |
| This city: | 60.6% |
| Whole state: | 68.7% |
| This city: | 6.1% |
| Whole state: | 7.2% |
Likely homosexual households (counted as self-reported same-sex unmarried-partner households)
- Lesbian couples: 0.4% of all households
- Gay men: 0.5% of all households
People in group quarters in Burbank in 2010:
- 268 people in nursing facilities/skilled-nursing facilities
- 172 people in other noninstitutional facilities
- 66 people in group homes intended for adults
- 36 people in residential treatment centers for adults
- 17 people in workers' group living quarters and job corps centers
- 6 people in residential treatment centers for juveniles (non-correctional)
- 5 people in in-patient hospice facilities
- 3 people in group homes for juveniles (non-correctional)
People in group quarters in Burbank in 2000:
- 462 people in nursing homes
- 135 people in other noninstitutional group quarters
- 108 people in homes for the physically handicapped
- 58 people in homes or halfway houses for drug/alcohol abuse
- 23 people in other nonhousehold living situations
- 15 people in religious group quarters
- 12 people in schools, hospitals, or wards for the intellectually disabled
- 6 people in homes for the mentally retarded
- 5 people in other group homes
- 2 people in local jails and other confinement facilities (including police lockups)
Banks with most branches in Burbank (2011 data):
- U.S. Bank National Association: Burbank Branch, Burbank Alameda Ralphs Branch, Burbank Pavilions, Burbank/Victory Branch, Burbank - San Fernando Boulevard Bra. Info updated 2012/01/30: Bank assets: $330,470.8 mil, Deposits: $236,091.5 mil, headquarters in Cincinnati, OH, positive income, 3121 total offices, Holding Company: U.S. Bancorp
- Bank of America, National Association: Magnolia Park Branch, Burbank Main Office, Toluca Lake Branch, North Toluca Lake Branch. Info updated 2009/11/18: Bank assets: $1,451,969.3 mil, Deposits: $1,077,176.8 mil, headquarters in Charlotte, NC, positive income, 5782 total offices, Holding Company: Bank Of America Corporation
- JPMorgan Chase Bank, National Association: Burbank Branch, 100 North First St. Branch, Burbank Branch, 3521 West Magnolia Branch. Info updated 2011/11/10: Bank assets: $1,811,678.0 mil, Deposits: $1,190,738.0 mil, headquarters in Columbus, OH, positive income, International Specialization, 5577 total offices, Holding Company: Jpmorgan Chase & Co.
- Citibank, National Association: 4000 W. Alameda Av Branch at 4000 W. Alameda Avenue, branch established on 1934/10/01; 360 E Magnolia Blvd Branch at 360 E Magnolia Blvd, branch established on 1945/01/01. Info updated 2012/01/10: Bank assets: $1,288,658.0 mil, Deposits: $882,541.0 mil, headquarters in Sioux Falls, SD, positive income, International Specialization, 1048 total offices, Holding Company: Citigroup Inc.
- Wells Fargo Bank, National Association: Burbank Civic Plaza Branch at 250 E Olive Ave, branch established on 1997/09/29; Burbank Branch at 900 North San Fernando Boulevard, branch established on 1954/12/29. Info updated 2011/04/05: Bank assets: $1,161,490.0 mil, Deposits: $905,653.0 mil, headquarters in Sioux Falls, SD, positive income, 6395 total offices, Holding Company: Wells Fargo & Company
- Union Bank, National Association: Burbank Branch at 601 South Glenoaks Blvd Ste 100, branch established on 1968/01/01; Toluca Lake Branch at 3900 West Alameda Avenue, branch established on 1996/07/15. Info updated 2011/09/01: Bank assets: $88,967.5 mil, Deposits: $65,286.4 mil, headquarters in San Francisco, CA, positive income, Commercial Lending Specialization, 403 total offices, Holding Company: Mitsubishi Ufj Financial Group, Inc.
- Boston Private Bank & Trust Company: Burbank Branch at 333 North Glenoaks Boulevard, branch established on 1984/12/21. Info updated 2011/06/08: Bank assets: $5,848.9 mil, Deposits: $4,643.9 mil, headquarters in Boston, MA, positive income, Commercial Lending Specialization, 24 total offices, Holding Company: Boston Private Financial Holdings, Inc.
- Comerica Bank: Burbank Branch at 801 N San Fernando Blvd, Ste 101, branch established on 2006/10/05. Info updated 2011/07/29: Bank assets: $60,970.5 mil, Deposits: $48,300.9 mil, headquarters in Dallas, TX, positive income, Commercial Lending Specialization, 497 total offices, Holding Company: Comerica Incorporated
- OneWest Bank, FSB: Burbank Branch at 1001 N. San Fernando Blvd Ste 150, branch established on 2005/10/31. Info updated 2011/07/21: Bank assets: $26,181.3 mil, Deposits: $15,408.4 mil, headquarters in Pasadena, CA, positive income, 79 total offices
- 4 other banks with 4 local branches
For population 15 years and over in Burbank:
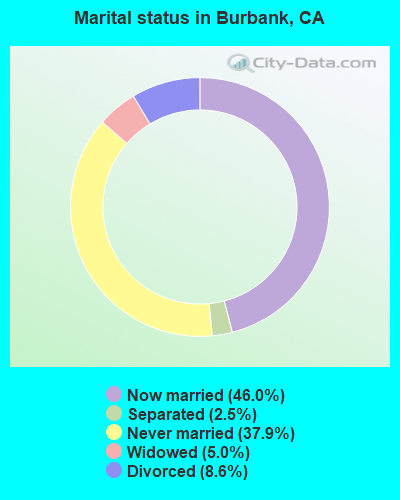
- Never married: 37.9%
- Now married: 46.0%
- Separated: 2.5%
- Widowed: 5.0%
- Divorced: 8.6%
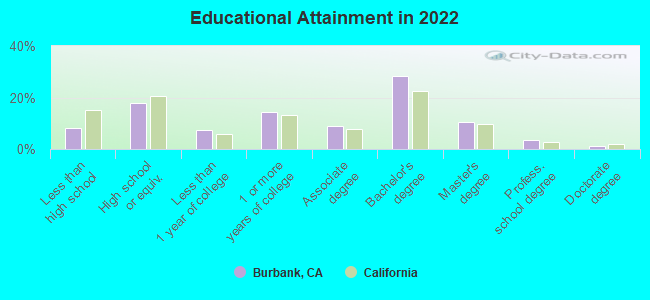
For population 25 years and over in Burbank:
- High school or higher: 91.8%
- Bachelor's degree or higher: 43.4%
- Graduate or professional degree: 15.2%
- Unemployed: 6.3%
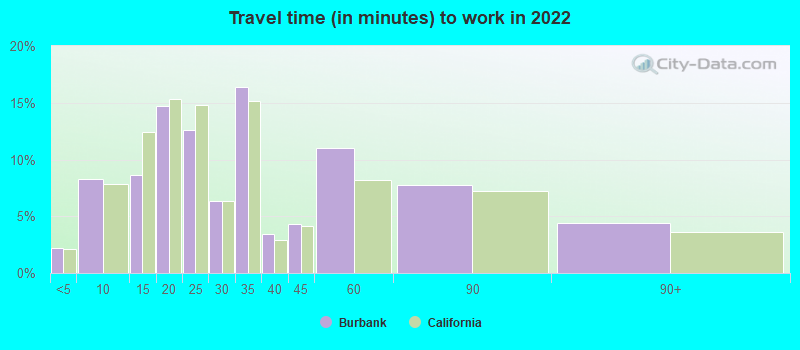
- Mean travel time to work (commute): 16.6 minutes
| Here: | 11.7 |
| California average: | 15.5 |


Graphs represent county-level data. Detailed 2008 Election Results
Neighborhoods in Burbank:
(Burbank, California Neighborhood Map)Religion statistics for Burbank, CA (based on Los Angeles County data)


| Religion | Adherents | Congregations |
|---|---|---|
| Catholic | 3,542,994 | 275 |
| Evangelical Protestant | 814,611 | 3,249 |
| Other | 451,594 | 1,023 |
| Mainline Protestant | 229,056 | 860 |
| Black Protestant | 112,338 | 290 |
| Orthodox | 63,517 | 76 |
| None | 4,604,495 | - |
Food Environment Statistics:
| Los Angeles County: | 2.12 / 10,000 pop. |
| California: | 2.14 / 10,000 pop. |
| This county: | 0.03 / 10,000 pop. |
| State: | 0.04 / 10,000 pop. |
| Here: | 0.58 / 10,000 pop. |
| California: | 0.62 / 10,000 pop. |
| This county: | 1.23 / 10,000 pop. |
| California: | 1.49 / 10,000 pop. |
| Los Angeles County: | 7.15 / 10,000 pop. |
| California: | 7.42 / 10,000 pop. |
| This county: | 7.5% |
| California: | 7.3% |
| Los Angeles County: | 20.4% |
| California: | 21.3% |
| This county: | 18.6% |
| State: | 17.9% |
Health and Nutrition:
| This city: | 52.3% |
| California: | 49.4% |
| This city: | 51.6% |
| California: | 48.0% |
| Burbank: | 28.0 |
| State: | 28.1 |
| Burbank: | 19.0% |
| California: | 20.2% |
| Burbank: | 10.5% |
| California: | 11.2% |
| Here: | 6.8 |
| California: | 6.8 |
| Burbank: | 32.7% |
| California: | 31.5% |
| This city: | 59.2% |
| California: | 56.4% |
| This city: | 81.4% |
| California: | 80.9% |
More about Health and Nutrition of Burbank, CA Residents
| Local government employment and payroll (March 2022) | |||||
| Function | Full-time employees | Monthly full-time payroll | Average yearly full-time wage | Part-time employees | Monthly part-time payroll |
|---|---|---|---|---|---|
| Electric Power | 193 | $2,805,817 | $174,455 | 7 | $20,905 |
| Police Protection - Officers | 147 | $2,207,831 | $180,231 | 0 | $0 |
| Firefighters | 115 | $1,763,648 | $184,033 | 0 | $0 |
| Streets and Highways | 88 | $730,712 | $99,643 | 2 | $4,389 |
| Water Supply | 84 | $928,443 | $132,635 | 3 | $8,330 |
| Police - Other | 74 | $531,340 | $86,163 | 29 | $38,712 |
| Financial Administration | 63 | $657,955 | $125,325 | 2 | $930 |
| Other and Unallocable | 54 | $496,917 | $110,426 | 7 | $28,569 |
| Parks and Recreation | 52 | $401,946 | $92,757 | 105 | $207,658 |
| Other Government Administration | 50 | $461,061 | $110,655 | 28 | $34,682 |
| Housing and Community Development (Local) | 40 | $385,350 | $115,605 | 0 | $0 |
| Local Libraries | 39 | $279,489 | $85,997 | 40 | $80,813 |
| Solid Waste Management | 34 | $249,769 | $88,154 | 3 | $10,325 |
| Transit | 28 | $284,664 | $121,999 | 5 | $6,451 |
| Judicial and Legal | 16 | $229,378 | $172,034 | 2 | $8,859 |
| Health | 13 | $89,789 | $82,882 | 2 | $3,062 |
| Fire - Other | 13 | $110,805 | $102,282 | 0 | $0 |
| Welfare | 9 | $65,665 | $87,553 | 12 | $35,672 |
| Sewerage | 9 | $96,948 | $129,264 | 0 | $0 |
| Natural Resources | 5 | $41,846 | $100,430 | 0 | $0 |
| Totals for Government | 1,126 | $12,819,372 | $136,619 | 247 | $489,358 |
Burbank government finances - Expenditure in 2021 (per resident):
- Construction - Regular Highways: $28,083,000 ($270.24)
Electric Utilities: $22,968,000 ($221.02)
Housing and Community Development: $5,020,000 ($48.31)
Water Utilities: $4,818,000 ($46.36)
Police Protection: $2,497,000 ($24.03)
Sewerage: $1,871,000 ($18.00)
General - Other: $1,220,000 ($11.74)
Parks and Recreation: $1,175,000 ($11.31)
General Public Buildings: $502,000 ($4.83)
Parking Facilities: $39,000 ($0.38)
Libraries: $18,000 ($0.17)
- Current Operations - Electric Utilities: $132,370,000 ($1273.77)
Police Protection: $58,258,000 ($560.60)
Central Staff Services: $33,056,000 ($318.09)
General - Other: $27,797,000 ($267.48)
Local Fire Protection: $27,007,000 ($259.88)
Water Utilities: $26,748,000 ($257.39)
Housing and Community Development: $17,965,000 ($172.87)
Solid Waste Management: $17,045,000 ($164.02)
Health - Other: $16,820,000 ($161.86)
Regular Highways: $16,534,000 ($159.10)
Parks and Recreation: $14,879,000 ($143.18)
Sewerage: $14,076,000 ($135.45)
Libraries: $7,296,000 ($70.21)
Protective Inspection and Regulation - Other: $4,886,000 ($47.02)
Transit Utilities: $4,712,000 ($45.34)
Judicial and Legal Services: $3,002,000 ($28.89)
Financial Administration: $2,312,000 ($22.25)
Parking Facilities: $597,000 ($5.74)
- Electric Utilities - Interest on Debt: $3,403,000 ($32.75)
- General - Interest on Debt: $872,000 ($8.39)
- Other Capital Outlay - Housing and Community Development: $5,020,000 ($48.31)
Electric Utilities: $3,299,000 ($31.75)
Parks and Recreation: $399,000 ($3.84)
Water Utilities: $231,000 ($2.22)
Local Fire Protection: $131,000 ($1.26)
Central Staff Services: $98,000 ($0.94)
Police Protection: $53,000 ($0.51)
Libraries: $33,000 ($0.32)
- Water Utilities - Interest on Debt: $1,723,000 ($16.58)
Burbank government finances - Revenue in 2021 (per resident):
- Charges - Other: $37,553,000 ($361.36)
Solid Waste Management: $17,789,000 ($171.18)
Sewerage: $17,194,000 ($165.45)
Parks and Recreation: $6,995,000 ($67.31)
Housing and Community Development: $721,000 ($6.94)
Parking Facilities: $525,000 ($5.05)
- Federal Intergovernmental - Other: $26,867,000 ($258.54)
Housing and Community Development: $1,985,000 ($19.10)
- Local Intergovernmental - Other: $9,672,000 ($93.07)
- Miscellaneous - General Revenue - Other: $17,606,000 ($169.42)
Special Assessments: $3,678,000 ($35.39)
Fines and Forfeits: $2,087,000 ($20.08)
Interest Earnings: $1,681,000 ($16.18)
Donations From Private Sources: $238,000 ($2.29)
Rents: $204,000 ($1.96)
- Revenue - Electric Utilities: $195,957,000 ($1885.65)
Water Utilities: $33,670,000 ($324.00)
Transit Utilities: $13,000 ($0.13)
- State Intergovernmental - Highways: $4,255,000 ($40.94)
Other: $3,644,000 ($35.07)
Electric Utilities: $2,949,000 ($28.38)
General Local Government Support: $165,000 ($1.59)
- Tax - Property: $61,132,000 ($588.26)
General Sales and Gross Receipts: $38,968,000 ($374.98)
Public Utilities Sales: $17,294,000 ($166.42)
Other: $14,338,000 ($137.97)
Other Selective Sales: $6,814,000 ($65.57)
Other License: $5,136,000 ($49.42)
Occupation and Business License - Other: $2,331,000 ($22.43)
Documentary and Stock Transfer: $732,000 ($7.04)
Burbank government finances - Debt in 2021 (per resident):
- Long Term Debt - Beginning Outstanding - Unspecified Public Purpose: $105,763,000 ($1017.73)
Outstanding Unspecified Public Purpose: $95,765,000 ($921.53)
Beginning Outstanding - Public Debt for Private Purpose: $21,055,000 ($202.61)
Outstanding Nonguaranteed - Industrial Revenue: $20,260,000 ($194.96)
Retired Unspecified Public Purpose: $9,998,000 ($96.21)
Retired Nonguaranteed - Public Debt for Private Purpose: $795,000 ($7.65)
Burbank government finances - Cash and Securities in 2021 (per resident):
- Bond Funds - Cash and Securities: $48,529,000 ($466.98)
- Other Funds - Cash and Securities: $139,856,000 ($1345.80)
- Sinking Funds - Cash and Securities: $37,543,000 ($361.27)
2.98% of this county's 2021 resident taxpayers lived in other counties in 2020 ($81,235 average adjusted gross income)
| Here: | 2.98% |
| California average: | 5.19% |
0.01% of residents moved from foreign countries ($155 average AGI)
Los Angeles County: 0.01% California average: 0.03%
Top counties from which taxpayers relocated into this county between 2020 and 2021:
| from Orange County, CA | |
| from San Bernardino County, CA | |
| from Riverside County, CA |
4.68% of this county's 2020 resident taxpayers moved to other counties in 2021 ($97,324 average adjusted gross income)
| Here: | 4.68% |
| California average: | 6.14% |
0.01% of residents moved to foreign countries ($196 average AGI)
Los Angeles County: 0.01% California average: 0.02%
Top counties to which taxpayers relocated from this county between 2020 and 2021:
| to Orange County, CA | |
| to San Bernardino County, CA | |
| to Riverside County, CA |
| Businesses in Burbank, CA | ||||
| Name | Count | Name | Count | |
|---|---|---|---|---|
| 24 Hour Fitness | 1 | KFC | 1 | |
| 7-Eleven | 7 | Kmart | 1 | |
| 99 Cents Only Stores | 1 | Kroger | 3 | |
| ALDO | 1 | Lane Bryant | 1 | |
| AT&T | 1 | Lane Furniture | 1 | |
| Aeropostale | 1 | LensCrafters | 1 | |
| Albertsons | 1 | Little Caesars Pizza | 1 | |
| American Eagle Outfitters | 1 | Lowe's | 1 | |
| AutoZone | 1 | Macy's | 1 | |
| Baja Fresh Mexican Grill | 1 | Marriott | 2 | |
| Bakers | 1 | Marshalls | 1 | |
| Barnes & Noble | 1 | MasterBrand Cabinets | 14 | |
| Baskin-Robbins | 5 | McDonald's | 5 | |
| Bath & Body Works | 1 | Men's Wearhouse | 1 | |
| Bed Bath & Beyond | 1 | Motherhood Maternity | 1 | |
| Ben & Jerry's | 1 | New York & Co | 1 | |
| Best Western | 1 | Nike | 10 | |
| Blockbuster | 2 | Nordstrom | 1 | |
| Budget Car Rental | 1 | Office Depot | 1 | |
| Buffalo Wild Wings | 1 | Old Navy | 1 | |
| Burger King | 1 | Olive Garden | 1 | |
| Burlington Coat Factory | 1 | Outback | 1 | |
| CVS | 5 | Outback Steakhouse | 1 | |
| CarMax | 1 | Pac Sun | 1 | |
| Carl\s Jr. | 2 | Panda Express | 4 | |
| Catherines | 1 | Papa John's Pizza | 1 | |
| Charlotte Russe | 1 | Payless | 2 | |
| Chevrolet | 1 | Pizza Hut | 2 | |
| Chipotle | 1 | Popeyes | 2 | |
| Chuck E. Cheese's | 1 | Quality | 1 | |
| Cinnabon | 1 | Quiznos | 3 | |
| Cold Stone Creamery | 1 | RadioShack | 3 | |
| Costco | 1 | Ramada | 1 | |
| Curves | 2 | Rite Aid | 1 | |
| DHL | 5 | SAS Shoes | 1 | |
| Dairy Queen | 1 | Safeway | 2 | |
| Decora Cabinetry | 4 | Sears | 5 | |
| Dennys | 2 | Skechers USA | 1 | |
| Domino's Pizza | 3 | Sprint Nextel | 2 | |
| El Pollo Loco | 2 | Staples | 2 | |
| Extended Stay America | 1 | Starbucks | 16 | |
| FedEx | 28 | Subway | 12 | |
| Foot Locker | 1 | T.J.Maxx | 1 | |
| Forever 21 | 1 | Taco Bell | 4 | |
| GNC | 4 | Target | 1 | |
| GameStop | 2 | The Room Place | 1 | |
| H&R Block | 6 | Toys"R"Us | 2 | |
| Haagen-Dazs | 1 | Trader Joe's | 1 | |
| Hilton | 1 | Travelodge | 1 | |
| Holiday Inn | 1 | U-Haul | 3 | |
| Home Depot | 1 | UPS | 21 | |
| HomeTown Buffet | 1 | Urban Outfitters | 1 | |
| Hot Topic | 1 | Vans | 5 | |
| IHOP | 1 | Verizon Wireless | 1 | |
| IKEA | 1 | Victoria's Secret | 1 | |
| Jack In The Box | 1 | Vons | 2 | |
| Jamba Juice | 3 | Walgreens | 2 | |
| Johnny Rockets | 1 | Wendy's | 1 | |
| Jones New York | 5 | Wet Seal | 1 | |
| Journeys | 1 | YMCA | 1 | |
Strongest AM radio stations in Burbank:
- KSPN (710 AM; 50 kW; LOS ANGELES, CA; Owner: KABC-AM RADIO, INC.)
- KBLA (1580 AM; 50 kW; SANTA MONICA, CA)
- KRLA (870 AM; 20 kW; GLENDALE, CA; Owner: NEW INSPIRATION BROADCASTING COMPANY)
- KFWB (980 AM; 50 kW; LOS ANGELES, CA; Owner: INFINITY BROADCASTING OPERATIONS, INC.)
- KMPC (1540 AM; 50 kW; LOS ANGELES, CA; Owner: ROSE CITY RADIO CORPORATION)
- KSUR (1260 AM; 25 kW; BEVERLY HILLS, CA)
- KXMX (1190 AM; 25 kW; ANAHEIM, CA; Owner: NEW INSPIRATION BROADCASTING COMPANY)
- KLAC (570 AM; 50 kW; LOS ANGELES, CA; Owner: AMFM RADIO LICENSES, L.L.C.)
- KDIS (1110 AM; 50 kW; PASADENA, CA; Owner: ABC,INC.)
- KTNQ (1020 AM; 50 kW; LOS ANGELES, CA; Owner: KTNQ-AM LICENSE CORP.)
- KFI (640 AM; 50 kW; LOS ANGELES, CA; Owner: CAPSTAR TX LIMITED PARTNERSHIP)
- KNX (1070 AM; 50 kW; LOS ANGELES, CA; Owner: INFINITY BROADCASTING OPERATIONS, INC.)
- KXTA (1150 AM; 50 kW; LOS ANGELES, CA; Owner: CITICASTERS LICENSES, L.P.)
Strongest FM radio stations in Burbank:
- KRTH-FM (101.1 FM; LOS ANGELES, CA; Owner: INFINITY BROADCASTING OPERATIONS, INC.)
- KKBT (100.3 FM; LOS ANGELES, CA; Owner: RADIO ONE LICENSES, LLC)
- KZLA-FM (93.9 FM; LOS ANGELES, CA; Owner: EMMIS RADIO LICENSE CORPORATION)
- KROQ-FM (106.7 FM; PASADENA, CA; Owner: INFINITY BROADCASTING CORP. OF LOS ANGELES)
- KPWR (105.9 FM; LOS ANGELES, CA; Owner: EMMIS RADIO LICENSE CORPORATION)
- KLSX (97.1 FM; LOS ANGELES, CA; Owner: INFINITY BROADCASTING OPERATIONS, INC.)
- KUSC (91.5 FM; LOS ANGELES, CA; Owner: UNIVERSITY OF SOUTHERN CALIFORNIA)
- KKLA-FM (99.5 FM; LOS ANGELES, CA; Owner: NEW INSPIRATION BROADCASTING CO., INC.)
- KYSR (98.7 FM; LOS ANGELES, CA; Owner: AMFM RADIO LICENSES, L.L.C.)
- KCRW (89.9 FM; SANTA MONICA, CA; Owner: SANTA MONICA COMM. COLLEGE DISTRICT)
- KCBS-FM (93.1 FM; LOS ANGELES, CA; Owner: INFINITY BROADCASTING OPERATIONS, INC.)
- K212FA (90.3 FM; TEMPLE CITY, CA; Owner: EDUCATIONAL MEDIA FOUNDATION)
- KSCA (101.9 FM; GLENDALE, CA; Owner: HBC LICENSE CORPORATION)
- KLOS (95.5 FM; LOS ANGELES, CA; Owner: KLOS-FM RADIO, INC.)
- KOST (103.5 FM; LOS ANGELES, CA; Owner: CAPSTAR TX LIMITED PARTNERSHIP)
- KLVE (107.5 FM; LOS ANGELES, CA; Owner: KLVE-FM LICENSE CORP.)
- KIIS-FM (102.7 FM; LOS ANGELES, CA; Owner: CITICASTERS LICENSES, L.P.)
- KPCC (89.3 FM; PASADENA, CA; Owner: PASADENA AREA COMMUNITY COLLEGE DISTRICT)
- KBIG-FM (104.3 FM; LOS ANGELES, CA; Owner: AMFM RADIO LICENSES, L.L.C.)
- KHHT (92.3 FM; LOS ANGELES, CA; Owner: AMFM RADIO LICENSES, L.L.C.)
TV broadcast stations around Burbank:
- KCBS-TV (Channel 2; LOS ANGELES, CA; Owner: CBS BROADCASTING INC.)
- KTRO-LP (Channel 50; LANCASTER, CA; Owner: ROBERT D. ADELMAN)
- KTLA-TV (Channel 5; LOS ANGELES, CA; Owner: KTLA INC.)
- KABC-TV (Channel 7; LOS ANGELES, CA; Owner: ABC HOLDING COMPANY, INC.)
- KCAL-TV (Channel 9; LOS ANGELES, CA; Owner: VIACOM TELEVISION STATIONS GROUP OF LOS ANGELES LLC)
- KNBC (Channel 4; LOS ANGELES, CA; Owner: NBC SUBSIDIARY (KNBC-TV), INC.)
- K38CY (Channel 38; VAN NUYS, CA; Owner: CAPITAL BROADCASTING CORPORATION)
- KMEX-TV (Channel 34; LOS ANGELES, CA; Owner: KMEX LICENSE PARTNERSHIP, G.P.)
- KAZA-TV (Channel 54; AVALON, CA; Owner: PAPPAS SOUTHERN CALIFORNIA LICENSE LLC)
- KWJD-LP (Channel 25; VAN NUYS, CA; Owner: FRIENDLY BROADCASTING COMPANY)
- KDOC-TV (Channel 56; ANAHEIM, CA; Owner: GOLDEN ORANGE BROADCASTING CO., INC.)
- KOCE-TV (Channel 50; HUNTINGTON BEACH, CA; Owner: BD. OF TRUSTEES, COAST COMMUNITY COLLEGE DIST.)
- KXLA (Channel 44; RANCHO PALOS VERDES, CA; Owner: RANCHO PALOS VERDES BROADCASTERS, INC.)
- KSCI (Channel 18; LONG BEACH, CA; Owner: KSLS, INC.)
- KCET (Channel 28; LOS ANGELES, CA; Owner: COMMUNITY TELEVISION OF SOUTHERN CALIFORNIA)
- KFTR (Channel 46; ONTARIO, CA; Owner: TELEFUTURA LOS ANGELES LLC)
- KTTV (Channel 11; LOS ANGELES, CA; Owner: FOX TELEVISION STATIONS, INC.)
- KWHY-TV (Channel 22; LOS ANGELES, CA; Owner: TELEMUNDO OF LOS ANGELES LICENSE CORPORATION)
- KSMV-LP (Channel 33; LOS ANGELES, CA; Owner: KJLA, LLC)
- KVEA (Channel 52; CORONA, CA; Owner: ESTRELLA LICENSE CORPORATION)
- KCOP-TV (Channel 13; LOS ANGELES, CA; Owner: FOX TELEVISION STATIONS, INC.)
- KTBN-TV (Channel 40; SANTA ANA, CA; Owner: TRINITY BROADCASTING NETWORK, INC.)
- KLCS (Channel 58; LOS ANGELES, CA; Owner: LOS ANGELES UNIFIED SCHOOL DISTRICT)
- KSFV-LP (Channel 26; SAN FERNANDO VALLEY, CA; Owner: VENTURE TECHNOLOGIES GROUP, LLC)
- National Bridge Inventory (NBI) Statistics
- 67Number of bridges
- 768ft / 234mTotal length
- 4,574,634Total average daily traffic
- 266,593Total average daily truck traffic
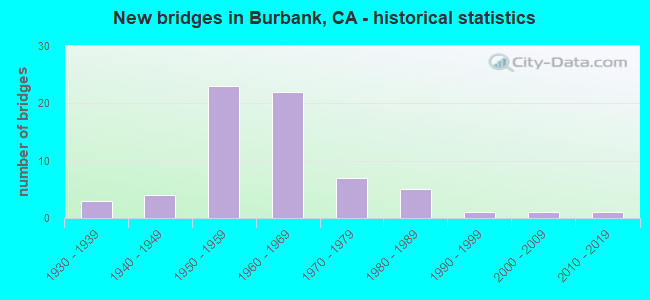
- New bridges - historical statistics
- 31930-1939
- 41940-1949
- 231950-1959
- 221960-1969
- 71970-1979
- 51980-1989
- 11990-1999
- 12000-2009
- 12010-2019
FCC Registered Commercial Land Mobile Towers: 5 (See the full list of FCC Registered Commercial Land Mobile Towers in Burbank, CA)
FCC Registered Private Land Mobile Towers: 7 (See the full list of FCC Registered Private Land Mobile Towers)
FCC Registered Broadcast Land Mobile Towers: 110 (See the full list of FCC Registered Broadcast Land Mobile Towers)
FCC Registered Microwave Towers: 183 (See the full list of FCC Registered Microwave Towers in this town)
FCC Registered Paging Towers: 9 (See the full list of FCC Registered Paging Towers)
FCC Registered Maritime Coast & Aviation Ground Towers: 32 (See the full list of FCC Registered Maritime Coast & Aviation Ground Towers)
FCC Registered Amateur Radio Licenses: 798 (See the full list of FCC Registered Amateur Radio Licenses in Burbank)
FAA Registered Aircraft Manufacturers and Dealers: 4 (See the full list of FAA Registered Manufacturers and Dealers in Burbank)
FAA Registered Aircraft: 101 (See the full list of FAA Registered Aircraft)
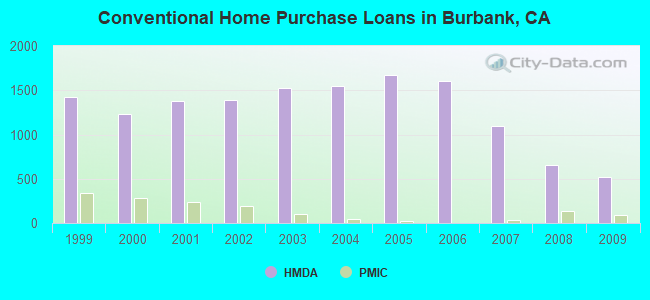
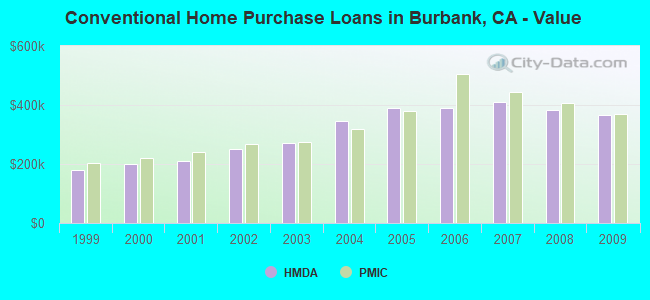
| Home Mortgage Disclosure Act Aggregated Statistics For Year 2009 (Based on 20 full tracts) | ||||||||||||||
| A) FHA, FSA/RHS & VA Home Purchase Loans | B) Conventional Home Purchase Loans | C) Refinancings | D) Home Improvement Loans | E) Loans on Dwellings For 5+ Families | F) Non-occupant Loans on < 5 Family Dwellings (A B C & D) | G) Loans On Manufactured Home Dwelling (A B C & D) | ||||||||
|---|---|---|---|---|---|---|---|---|---|---|---|---|---|---|
| Number | Average Value | Number | Average Value | Number | Average Value | Number | Average Value | Number | Average Value | Number | Average Value | Number | Average Value | |
| LOANS ORIGINATED | 169 | $449,891 | 517 | $365,476 | 1,921 | $323,225 | 126 | $240,116 | 22 | $1,365,173 | 175 | $311,912 | 1 | $323,000 |
| APPLICATIONS APPROVED, NOT ACCEPTED | 21 | $481,694 | 73 | $357,644 | 197 | $360,699 | 25 | $208,795 | 0 | $0 | 23 | $279,337 | 1 | $20,000 |
| APPLICATIONS DENIED | 39 | $454,216 | 125 | $380,659 | 602 | $372,980 | 46 | $155,456 | 11 | $1,160,749 | 72 | $312,863 | 0 | $0 |
| APPLICATIONS WITHDRAWN | 41 | $445,659 | 118 | $392,471 | 393 | $357,355 | 32 | $198,336 | 2 | $2,395,000 | 47 | $336,742 | 0 | $0 |
| FILES CLOSED FOR INCOMPLETENESS | 9 | $337,770 | 18 | $374,536 | 96 | $380,211 | 5 | $174,200 | 1 | $800,000 | 9 | $253,333 | 0 | $0 |
Detailed mortgage data for all 20 tracts in Burbank, CA
| Private Mortgage Insurance Companies Aggregated Statistics For Year 2009 (Based on 19 full tracts) | ||||
| A) Conventional Home Purchase Loans | B) Refinancings | |||
|---|---|---|---|---|
| Number | Average Value | Number | Average Value | |
| LOANS ORIGINATED | 87 | $368,434 | 11 | $434,262 |
| APPLICATIONS APPROVED, NOT ACCEPTED | 25 | $428,779 | 6 | $428,500 |
| APPLICATIONS DENIED | 24 | $374,654 | 9 | $467,444 |
| APPLICATIONS WITHDRAWN | 8 | $459,000 | 4 | $464,250 |
| FILES CLOSED FOR INCOMPLETENESS | 9 | $377,413 | 2 | $408,400 |
2005 - 2018 National Fire Incident Reporting System (NFIRS) incidents
- Fire incident types reported to NFIRS in Burbank, CA
- 1,16946.4%Structure Fires
- 60924.2%Outside Fires
- 58423.2%Mobile Property/Vehicle Fires
- 1596.3%Other
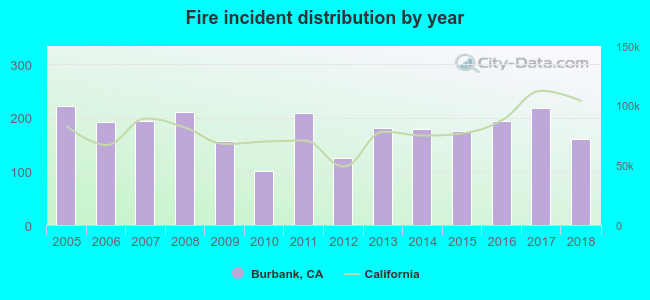 According to the data from the years 2005 - 2018 the average number of fires per year is 180. The highest number of fires - 223 took place in 2005, and the least - 100 in 2010. The data has a dropping trend.
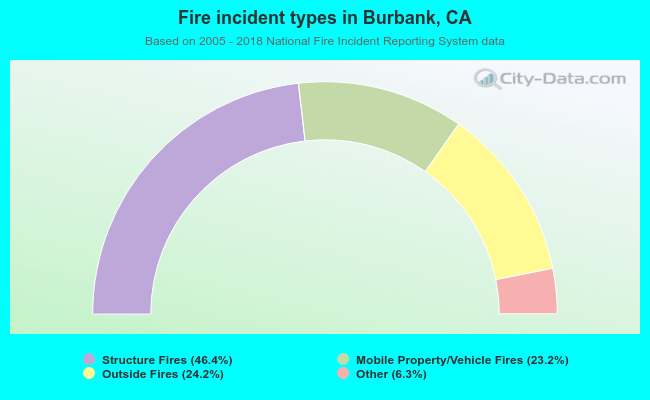 When looking into fire subcategories, the most incidents belonged to: Structure Fires (46.4%), and Outside Fires (24.2%).
Fire-safe hotels and motels in Burbank, California:
- Safari Inn, A Coast Hotel, 1911 W Olive Ave, Burbank, California 91506 , Phone: (818) 845-8586, Fax: (818) 845-0054
- Quality Inn, 2255 N Buena Vista St, Burbank, California 91504 , Phone: (818) 848-1680
- Burbank Airport Marriott Hotel & Convention Center, 2500 Hollywood Way, Burbank, California 91505 , Phone: (818) 843-6000, Fax: (818) 842-9720
- Extended Stay America - Los Angeles - Burbank Airport, 2200 Empire Ave, Burbank, California 91504 , Phone: (818) 567-0952, Fax: (818) 567-0953
- Hotel Amarano Burbank, 322 N Pass Ave, Burbank, California 91505 , Phone: (818) 842-8887, Fax: (818) 260-8999
- Residence Inn By Marriott Burbank Downtown, 321 S First St, Burbank, California 91502 , Phone: (818) 260-8787, Fax: (818) 260-9191
- Hampton Inn and Suites Burbank, 7501 N Glenoaks Blvd, Burbank, California 91504 , Phone: (818) 768-1106, Fax: (818) 768-1126
- Portofino Inn, 924 W Olive Ave, Burbank, California 91506 , Phone: (818) 848-5100, Fax: (818) 848-8290
- 2 other hotels and motels
| Most common first names in Burbank, CA among deceased individuals | ||
| Name | Count | Lived (average) |
|---|---|---|
| John | 703 | 75.1 years |
| Mary | 601 | 80.7 years |
| William | 556 | 74.1 years |
| Robert | 492 | 71.3 years |
| James | 403 | 73.0 years |
| Charles | 362 | 75.1 years |
| George | 345 | 76.8 years |
| Helen | 333 | 80.5 years |
| Joseph | 301 | 75.9 years |
| Margaret | 283 | 80.7 years |
| Most common last names in Burbank, CA among deceased individuals | ||
| Last name | Count | Lived (average) |
|---|---|---|
| Smith | 238 | 76.7 years |
| Johnson | 148 | 78.2 years |
| Miller | 118 | 77.6 years |
| Brown | 113 | 80.2 years |
| Davis | 109 | 77.1 years |
| Jones | 107 | 78.5 years |
| Anderson | 99 | 77.8 years |
| Williams | 97 | 75.9 years |
| Martin | 78 | 77.2 years |
| White | 67 | 77.5 years |
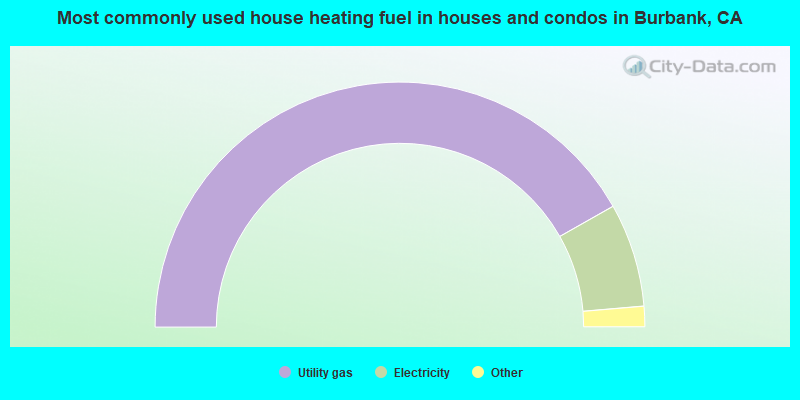
- 83.6%Utility gas
- 13.7%Electricity
- 1.7%Bottled, tank, or LP gas
- 0.7%Solar energy
- 0.3%No fuel used
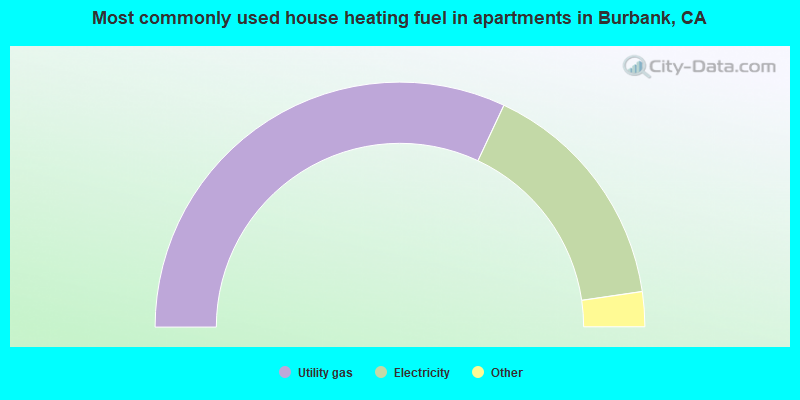
- 63.9%Utility gas
- 31.4%Electricity
- 2.5%No fuel used
- 1.8%Bottled, tank, or LP gas
- 0.1%Wood
- 0.1%Fuel oil, kerosene, etc.
Burbank compared to California state average:
- Unemployed percentage below state average.
- Median age above state average.
- House age above state average.
- Percentage of population with a bachelor's degree or higher above state average.
Burbank, CA compared to other similar cities:
Burbank on our top lists:
- #1 on the list of "Top 101 cities with largest percentage of females in occupations: arts, design, entertainment, sports, and media occupations (population 50,000+)"
- #2 on the list of "Top 101 cities with largest percentage of males in occupations: arts, design, entertainment, sports, and media occupations (population 50,000+)"
- #2 on the list of "Top 101 cities with largest percentage of males in industries: information (population 50,000+)"
- #2 on the list of "Top 101 cities with largest percentage of females in industries: information (population 50,000+)"
- #5 on the list of "Top 101 cities with the most residents born in Armenia (population 500+)"
- #10 on the list of "Top 101 cities with the smallest sunshine amount differences during a year (population 50,000+)"
- #12 on the list of "Top 101 cities with the most residents born in Iran (population 500+)"
- #13 on the list of "Top 101 cities with the highest cost per building permit(population 50,000+)"
- #17 on the list of "Top 100 cities with highest ratio of median house value to median household income (pop. 50,000+)"
- #19 on the list of "Top 101 larger cities with the highest increase in house/condo value from 2000 (population 50,000+)"
- #21 on the list of "Top 101 cities with largest percentage of females in industries: arts, entertainment, and recreation (population 50,000+)"
- #21 on the list of "Top 101 cities with the most residents born in Syria (population 500+)"
- #22 on the list of "Top 101 cities with the most residents born in Western Asia (population 500+)"
- #33 on the list of "Top 101 cities with largest percentage of males in industries: arts, entertainment, and recreation (population 50,000+)"
- #56 on the list of "Top 101 cities with largest percentage of females in industries: other services, except public administration (population 50,000+)"
- #63 on the list of "Top 100 cities with highest median house value (pop. 50,000+)"
- #68 on the list of "Top 101 cities that people commute into (largest positive percentage daily daytime population change due to commuting) (population 50,000+)"
- #71 on the list of "Top 101 cities with fewest building permits per 10,000 residents (population 50,000+)"
- #83 on the list of "Top 101 cities with largest percentage of females in occupations: personal care and service occupations (population 50,000+)"
- #88 on the list of "Top 101 cities with the largest percentage of likely gay men couples (counted as self-reported male-male unmarried-partner households) (population 50,000+)"
- #11 (91505) on the list of "Top 101 zip codes with the most big companies in 2005 (at least 1000 employees)"
- #88 (91504) on the list of "Top 101 zip codes with the largest percentage of Arab first ancestries"
- #1 on the list of "Top 101 counties with the most Evangelical Protestant congregations"
- #1 on the list of "Top 101 counties with the most Mainline Protestant congregations"
- #1 on the list of "Top 101 counties with the most Orthodox adherents"
- #1 on the list of "Top 101 counties with the highest ground withdrawal of fresh water for public supply (pop. 50,000+)"
- #1 on the list of "Top 101 counties with the most Catholic adherents (pop. 50,000+)"

|
|
Total of 1184 patent applications in 2008-2024.