Boston, Massachusetts Neighborhood Map - Income, House Prices, Occupations, Boundaries
Settings
X

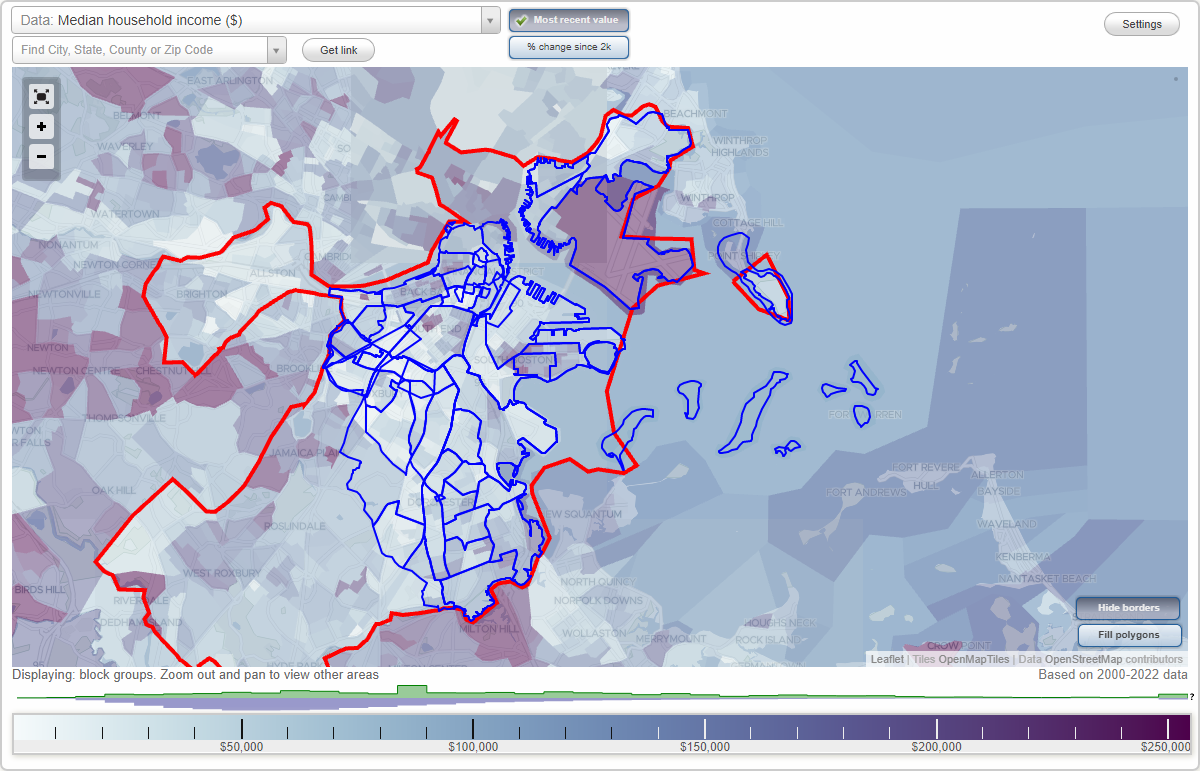
- City boundary
- Neighborhood boundaries
Business Search - 14 Million verified businesses
Neighborhoods:
Airport, Ashmont, Back Bay, Back Of The Hill, Beacon Hill, Boston Common, Bowdoin North, Brunswick King, Chinatown, City Point, Codman Sq, Columbia Point, Columbus Park, Dorchester, Downtown, Downtown Crossing, Dudley Square, Eagle Hill, East Boston, East Lower Mills, Fenway, Fields Corner East, Fields Corner West, Financial District, Fort Point, Four Corners, Franklin Field South, Government Center, Harbor Islands, Harbor View, Highland Park, Kenmore, Leather District, Longwood, Lower Roxbury, Maverick Sq, Medical Center Area, Meeting Housing Hill, Mission Hill, Mission Hill Projects, Neponset, North Dorchester, Point Shirley, Prudential, Roxbury, Sav-mor, South Boston, South End, St. Marks, Telegraph Hill, Theatre District, Uphams Corner, Washington Park, Waterfront, West Broadway, West Fens, West Lower MillsAirport neighborhood in Boston statistics: (Find on map)
Area: 2.680 square miles
Population: 104,445
Population density:
Median household income in 2021:
Median rent in in 2021:
Male vs Females
Median age
Housing prices:
Average estimated value of detached houses in 2021 (4.0% of all units):
Average estimated value of townhouses or other attached units in 2021 (2.6% of all units):
Average estimated value of housing units in 2-unit structures in 2021 (9.1% of all units):
Average estimated '21 value of housing units in 3-to-4-unit structures (38.0% of all units):
Average estimated '21 value of housing units in 5-or-more-unit structures (28.7% of all units):
Most popular occupations of males: service occupations (31.0%); management occupations (except farmers) (11.8%); sales and office occupations (10.6%); business and financial operations occupations (8.6%); computer and mathematical occupations (8.4%); architecture and engineering occupations (5.0%); arts, design, entertainment, sports, and media occupations (4.5%)
Most popular occupations of females: service occupations (18.6%); management occupations (except farmers) (16.3%); business and financial operations occupations (15.5%); sales and office occupations (15.2%); education, training, and library occupations (7.0%); healthcare practitioners and technical occupations (5.6%); life, physical, and social science occupations (4.1%)
Limited-access highways (interstate or state) in this neighborhood: I- 90 (Massachusetts Tpke).
Highways in this neighborhood: State Hwy 1 Alt (William F McClellan Hwy).
Roads and streets: N351; Maverick St; Sumner St; Webster St; Marginal St; Everett St; Cottage St; Orleans St; Prescott St; Gove St; Frankfort St; Porter St; Lamson St; Porter St Exd; Geneva St; Jeffries St; Haynes St; Lubec St; Ruth St; Emmet Pl; Pearl Pl; Day Sq Mbta Station; Brigham St; Porter St (Logan Airport Boundary); Seaver St; Murray Ct; Neptune Rd; Aramon St; Shrimpton St; Ardee St; Ipswich Pl; Neptune Ct; Lamson Ct; Webster Ave; Everett Pl; Percival Pl; E Gould Ct; McKay Pl; Cheever Ct; Wilbur Ct; Noble Ct; Sumner Pl; Castle Ct; Everett Ct; Webster Pl; Wellington Rd; Hooten Ct; Short St; Ida St; McCormack Sq.
Railroad features: Penn Central RR; Mbta Blue Line RR.
Airport neighborhood detailed profile
Area: 2.680 square miles
Population: 104,445
Population density:
| Airport (Jeffries Point): | 38,970 people per square mile |
| Boston: | 13,511 people per square mile |
Median household income in 2021:
| Airport (Jeffries Point): | $92,143 |
| Boston: | $79,283 |
Median rent in in 2021:
| Airport (Jeffries Point): | $1,977 |
| Boston: | $1,696 |
Male vs Females
| Males: | 52,051 |
| Females: | 52,394 |
Median age
| Males: | 33.3 years |
| Females: | 29.0 years |
Housing prices:
Average estimated value of detached houses in 2021 (4.0% of all units):
| Airport (Jeffries Point): | $686,607 |
| Boston: | $683,896 |
Average estimated value of townhouses or other attached units in 2021 (2.6% of all units):
| This neighborhood: | $389,429 |
| city: | $1,097,292 |
Average estimated value of housing units in 2-unit structures in 2021 (9.1% of all units):
| This neighborhood: | $240,644 |
| Boston: | $639,493 |
Average estimated '21 value of housing units in 3-to-4-unit structures (38.0% of all units):
| Airport (Jeffries Point): | $315,600 |
| city: | $745,440 |
Average estimated '21 value of housing units in 5-or-more-unit structures (28.7% of all units):
| Airport (Jeffries Point): | $444,947 |
| Boston: | $986,433 |
Most popular occupations of males: service occupations (31.0%); management occupations (except farmers) (11.8%); sales and office occupations (10.6%); business and financial operations occupations (8.6%); computer and mathematical occupations (8.4%); architecture and engineering occupations (5.0%); arts, design, entertainment, sports, and media occupations (4.5%)
Most popular occupations of females: service occupations (18.6%); management occupations (except farmers) (16.3%); business and financial operations occupations (15.5%); sales and office occupations (15.2%); education, training, and library occupations (7.0%); healthcare practitioners and technical occupations (5.6%); life, physical, and social science occupations (4.1%)
Limited-access highways (interstate or state) in this neighborhood: I- 90 (Massachusetts Tpke).
Highways in this neighborhood: State Hwy 1 Alt (William F McClellan Hwy).
Roads and streets: N351; Maverick St; Sumner St; Webster St; Marginal St; Everett St; Cottage St; Orleans St; Prescott St; Gove St; Frankfort St; Porter St; Lamson St; Porter St Exd; Geneva St; Jeffries St; Haynes St; Lubec St; Ruth St; Emmet Pl; Pearl Pl; Day Sq Mbta Station; Brigham St; Porter St (Logan Airport Boundary); Seaver St; Murray Ct; Neptune Rd; Aramon St; Shrimpton St; Ardee St; Ipswich Pl; Neptune Ct; Lamson Ct; Webster Ave; Everett Pl; Percival Pl; E Gould Ct; McKay Pl; Cheever Ct; Wilbur Ct; Noble Ct; Sumner Pl; Castle Ct; Everett Ct; Webster Pl; Wellington Rd; Hooten Ct; Short St; Ida St; McCormack Sq.
Railroad features: Penn Central RR; Mbta Blue Line RR.
Airport neighborhood detailed profile
Ashmont neighborhood in Boston statistics: (Find on map)
Area: 0.419 square miles
Population: 8,561
Population density:
Median household income in 2021:
Median rent in in 2021:
Male vs Females
Median age
Housing prices:
Average estimated value of detached houses in 2021 (17.3% of all units):
Average estimated value of townhouses or other attached units in 2021 (6.4% of all units):
Average estimated value of housing units in 2-unit structures in 2021 (29.5% of all units):
Average estimated '21 value of housing units in 3-to-4-unit structures (29.6% of all units):
Average estimated '21 value of housing units in 5-or-more-unit structures (12.3% of all units):
Most popular occupations of males: service occupations (18.3%); sales and office occupations (13.9%); management occupations (except farmers) (12.6%); education, training, and library occupations (10.7%); computer and mathematical occupations (7.5%); business and financial operations occupations (6.0%); transportation occupations (5.7%)
Most popular occupations of females: sales and office occupations (23.2%); service occupations (20.7%); healthcare practitioners and technical occupations (13.2%); management occupations (except farmers) (11.0%); community and social services occupations (7.3%); education, training, and library occupations (7.2%); transportation occupations (5.1%)
Highways in this neighborhood: State Hwy 203 (Gallivan Blvd).
Roads and streets: Ashmont St; Elmer Rd; Beaumont St; Dorchester Ave; Adams St; Carruth St; Minot St; Bailey St; Westmoreland St; Van Winkle St; Mercier Ave; Bushnell St; Fuller St; Huron Cir; Galty Ave; Mellen St; Roslin St; Alicia Rd; Burgoyne St; Talbot Ave; Range Rd; Beale St; Fairfax St; Owencroft Rd; Helena Rd; Becket St; Ocean St; Radford Ln; Ely Rd; Magdala St; Lombard St; Verdun St; Rowena St; Barna Rd; Frederika St; Shenandoah St; Regan Rd; Minot Park; Weyanoke St; Sedalia Rd; Wessex St; Barrington Rd; Wilcox Rd; Bateswell Rd; Fossdale Rd; Walton St; Bruce St; Hurlcroft Ave; Montague St; Clermont St; Atherstone St; Grace St; Harley St; Croftland Ave; Souther Rd; Rundel Park; Carmela Ln; Ashmont Park; Burt St; Louis Ter; Waldorf St; Adanac Ter; Berkshire St; Huron Pass; Kenmere Rd.
Mass transit rail lines: Ashmont-Mattapan Trolley (Mbta Red Line RR).
Ashmont neighborhood detailed profile
Area: 0.419 square miles
Population: 8,561
Population density:
| Ashmont: | 20,443 people per square mile |
| Boston: | 13,511 people per square mile |
Median household income in 2021:
| Ashmont: | $91,674 |
| Boston: | $79,283 |
Median rent in in 2021:
| Ashmont: | $1,380 |
| Boston: | $1,696 |
Male vs Females
| Males: | 3,993 |
| Females: | 4,567 |
Median age
| Males: | 36.9 years |
| Females: | 40.7 years |
Housing prices:
Average estimated value of detached houses in 2021 (17.3% of all units):
| Ashmont: | $509,463 |
| Boston: | $683,896 |
Average estimated value of townhouses or other attached units in 2021 (6.4% of all units):
| This neighborhood: | $225,183 |
| city: | $1,097,292 |
Average estimated value of housing units in 2-unit structures in 2021 (29.5% of all units):
| This neighborhood: | $485,834 |
| Boston: | $639,493 |
Average estimated '21 value of housing units in 3-to-4-unit structures (29.6% of all units):
| Ashmont: | $454,805 |
| city: | $745,440 |
Average estimated '21 value of housing units in 5-or-more-unit structures (12.3% of all units):
| Ashmont: | $260,281 |
| Boston: | $986,433 |
Most popular occupations of males: service occupations (18.3%); sales and office occupations (13.9%); management occupations (except farmers) (12.6%); education, training, and library occupations (10.7%); computer and mathematical occupations (7.5%); business and financial operations occupations (6.0%); transportation occupations (5.7%)
Most popular occupations of females: sales and office occupations (23.2%); service occupations (20.7%); healthcare practitioners and technical occupations (13.2%); management occupations (except farmers) (11.0%); community and social services occupations (7.3%); education, training, and library occupations (7.2%); transportation occupations (5.1%)
Highways in this neighborhood: State Hwy 203 (Gallivan Blvd).
Roads and streets: Ashmont St; Elmer Rd; Beaumont St; Dorchester Ave; Adams St; Carruth St; Minot St; Bailey St; Westmoreland St; Van Winkle St; Mercier Ave; Bushnell St; Fuller St; Huron Cir; Galty Ave; Mellen St; Roslin St; Alicia Rd; Burgoyne St; Talbot Ave; Range Rd; Beale St; Fairfax St; Owencroft Rd; Helena Rd; Becket St; Ocean St; Radford Ln; Ely Rd; Magdala St; Lombard St; Verdun St; Rowena St; Barna Rd; Frederika St; Shenandoah St; Regan Rd; Minot Park; Weyanoke St; Sedalia Rd; Wessex St; Barrington Rd; Wilcox Rd; Bateswell Rd; Fossdale Rd; Walton St; Bruce St; Hurlcroft Ave; Montague St; Clermont St; Atherstone St; Grace St; Harley St; Croftland Ave; Souther Rd; Rundel Park; Carmela Ln; Ashmont Park; Burt St; Louis Ter; Waldorf St; Adanac Ter; Berkshire St; Huron Pass; Kenmere Rd.
Mass transit rail lines: Ashmont-Mattapan Trolley (Mbta Red Line RR).
Ashmont neighborhood detailed profile
Back Bay neighborhood in Boston statistics: (Find on map)
Area: 0.424 square miles
Population: 5,499
Population density:
Median household income in 2021:
Median rent in in 2021:
Male vs Females
Median age
Most popular occupations of males: sales and office occupations (27.6%); business and financial operations occupations (25.8%); computer and mathematical occupations (15.7%); management occupations (except farmers) (11.0%); service occupations (7.1%); healthcare practitioners and technical occupations (5.8%); life, physical, and social science occupations (2.5%)
Most popular occupations of females: education, training, and library occupations (29.5%); management occupations (except farmers) (19.6%); business and financial operations occupations (15.5%); healthcare practitioners and technical occupations (11.7%); service occupations (9.7%); life, physical, and social science occupations (8.3%); sales and office occupations (7.1%)
Limited-access highways (interstate or state) in this neighborhood: Massachusetts Tpke (I- 90).
Highways in this neighborhood: US Hwy 20 (State Hwy 2, Commonwealth Ave); State Hwy 9 (St James Ave); Clarendon St (State Hwy 28); Massachusetts Ave (State Hwy 2 Alt); State Hwy 9 (Stuart St); Harvard Brg (Massachusetts Avenue Brg, Massachusetts Ave, State Hwy 2 Alt).
Roads and streets: Storrow Memorial Dr; Newbury St; Marlborough St; Beacon St; Boylston St; Back St; Charlesgate; Berkeley St; Dartmouth St; Arlington St; Providence St; Exeter St; Fairfield St; Gloucester St; Hereford St; Charlesgate E.
Other features: Muddy Riv.
Back Bay neighborhood detailed profile
Area: 0.424 square miles
Population: 5,499
Population density:
| Back Bay: | 12,975 people per square mile |
| Boston: | 13,511 people per square mile |
Median household income in 2021:
| Back Bay: | $83,404 |
| Boston: | $79,283 |
Median rent in in 2021:
| Back Bay: | $1,945 |
| Boston: | $1,696 |
Male vs Females
| Males: | 3,195 |
| Females: | 2,303 |
Median age
| Males: | 27.0 years |
| Females: | 28.1 years |
Most popular occupations of males: sales and office occupations (27.6%); business and financial operations occupations (25.8%); computer and mathematical occupations (15.7%); management occupations (except farmers) (11.0%); service occupations (7.1%); healthcare practitioners and technical occupations (5.8%); life, physical, and social science occupations (2.5%)
Most popular occupations of females: education, training, and library occupations (29.5%); management occupations (except farmers) (19.6%); business and financial operations occupations (15.5%); healthcare practitioners and technical occupations (11.7%); service occupations (9.7%); life, physical, and social science occupations (8.3%); sales and office occupations (7.1%)
Limited-access highways (interstate or state) in this neighborhood: Massachusetts Tpke (I- 90).
Highways in this neighborhood: US Hwy 20 (State Hwy 2, Commonwealth Ave); State Hwy 9 (St James Ave); Clarendon St (State Hwy 28); Massachusetts Ave (State Hwy 2 Alt); State Hwy 9 (Stuart St); Harvard Brg (Massachusetts Avenue Brg, Massachusetts Ave, State Hwy 2 Alt).
Roads and streets: Storrow Memorial Dr; Newbury St; Marlborough St; Beacon St; Boylston St; Back St; Charlesgate; Berkeley St; Dartmouth St; Arlington St; Providence St; Exeter St; Fairfield St; Gloucester St; Hereford St; Charlesgate E.
Other features: Muddy Riv.
Back Bay neighborhood detailed profile
Back Of The Hill neighborhood in Boston statistics: (Find on map)
Area: 0.417 square miles
Population: 12,714
Population density:
Median household income in 2021:
Median rent in in 2021:
Male vs Females
Median age
Housing prices:
Average estimated value of detached houses in 2021 (4.2% of all units):
Average estimated value of townhouses or other attached units in 2021 (6.1% of all units):
Average estimated value of housing units in 2-unit structures in 2021 (11.7% of all units):
Average estimated '21 value of housing units in 3-to-4-unit structures (39.7% of all units):
Average estimated '21 value of housing units in 5-or-more-unit structures (56.3% of all units):
Most popular occupations of males: sales and office occupations (22.3%); computer and mathematical occupations (13.2%); service occupations (12.4%); life, physical, and social science occupations (8.5%); management occupations (except farmers) (7.3%); education, training, and library occupations (7.3%); healthcare practitioners and technical occupations (5.1%)
Most popular occupations of females: healthcare practitioners and technical occupations (17.3%); sales and office occupations (16.1%); service occupations (11.7%); business and financial operations occupations (11.3%); education, training, and library occupations (9.0%); management occupations (except farmers) (8.4%); life, physical, and social science occupations (6.0%)
Highways in this neighborhood: Columbus Ave (State Hwy 28); State Hwy 9 (Mbta Green Line Trolley, Huntington Ave); State Hwy 9 (Huntington Ave).
Roads and streets: Riverway; Parker Hill Ave; Heath St; Hillside St; Fisher Ave; Calumet St; Alleghany St; Parker St; Lawn St; Terrace St; Fenwood Rd; Wensley St; Iroquois St; Iroquois St (Sachem St); New Whitney St; Francis St; Mission Park Dr; Delle Ave; Vining St; Wait St; Ellingwood St; Tremont St; St Albans Rd; Cherokee St; Pontiac St; Darling St; New Heath St; Stockwell St; Eldora St; Frawley St; Hayden St; Colburn St; Sunset St; Cedar St; Parker Hill Pl; Bucknam St; Mission St; Kempton St; Brookline Ave; Bickford Ave; Gore St; Oswald St; Oscar St; Estey St; Folsom Ave; Parker Hill Ter; Copenger St; Waymount St; Harleston St; Eugene Cir; Judge St; Eileen Cir; Pequot St; Binney St; Shepherd Ave; Twombley Pl; Vitale Pl; Torpie St; Decatur Ave; Wigglesworth St.
Railroad features: Mbta Orange Line RR (Amtrak RR, Mbta Commuter Rail).
Back Of The Hill neighborhood detailed profile
Area: 0.417 square miles
Population: 12,714
Population density:
| Back Of The Hill (RTH): | 30,472 people per square mile |
| Boston: | 13,511 people per square mile |
Median household income in 2021:
| Back Of The Hill (RTH): | $61,502 |
| Boston: | $79,283 |
Median rent in in 2021:
| Back Of The Hill (RTH): | $1,834 |
| Boston: | $1,696 |
Male vs Females
| Males: | 6,645 |
| Females: | 6,068 |
Median age
| Males: | 26.3 years |
| Females: | 32.0 years |
Housing prices:
Average estimated value of detached houses in 2021 (4.2% of all units):
| Back Of The Hill (RTH): | $480,152 |
| Boston: | $683,896 |
Average estimated value of townhouses or other attached units in 2021 (6.1% of all units):
| This neighborhood: | $743,733 |
| city: | $1,097,292 |
Average estimated value of housing units in 2-unit structures in 2021 (11.7% of all units):
| This neighborhood: | $943,912 |
| Boston: | $639,493 |
Average estimated '21 value of housing units in 3-to-4-unit structures (39.7% of all units):
| Back Of The Hill (RTH): | $725,488 |
| city: | $745,440 |
Average estimated '21 value of housing units in 5-or-more-unit structures (56.3% of all units):
| Back Of The Hill (RTH): | $733,684 |
| Boston: | $986,433 |
Most popular occupations of males: sales and office occupations (22.3%); computer and mathematical occupations (13.2%); service occupations (12.4%); life, physical, and social science occupations (8.5%); management occupations (except farmers) (7.3%); education, training, and library occupations (7.3%); healthcare practitioners and technical occupations (5.1%)
Most popular occupations of females: healthcare practitioners and technical occupations (17.3%); sales and office occupations (16.1%); service occupations (11.7%); business and financial operations occupations (11.3%); education, training, and library occupations (9.0%); management occupations (except farmers) (8.4%); life, physical, and social science occupations (6.0%)
Highways in this neighborhood: Columbus Ave (State Hwy 28); State Hwy 9 (Mbta Green Line Trolley, Huntington Ave); State Hwy 9 (Huntington Ave).
Roads and streets: Riverway; Parker Hill Ave; Heath St; Hillside St; Fisher Ave; Calumet St; Alleghany St; Parker St; Lawn St; Terrace St; Fenwood Rd; Wensley St; Iroquois St; Iroquois St (Sachem St); New Whitney St; Francis St; Mission Park Dr; Delle Ave; Vining St; Wait St; Ellingwood St; Tremont St; St Albans Rd; Cherokee St; Pontiac St; Darling St; New Heath St; Stockwell St; Eldora St; Frawley St; Hayden St; Colburn St; Sunset St; Cedar St; Parker Hill Pl; Bucknam St; Mission St; Kempton St; Brookline Ave; Bickford Ave; Gore St; Oswald St; Oscar St; Estey St; Folsom Ave; Parker Hill Ter; Copenger St; Waymount St; Harleston St; Eugene Cir; Judge St; Eileen Cir; Pequot St; Binney St; Shepherd Ave; Twombley Pl; Vitale Pl; Torpie St; Decatur Ave; Wigglesworth St.
Railroad features: Mbta Orange Line RR (Amtrak RR, Mbta Commuter Rail).
Back Of The Hill neighborhood detailed profile
Beacon Hill neighborhood in Boston statistics: (Find on map)
Area: 0.335 square miles
Population: 27,667
Population density:
Median household income in 2021:
Median rent in in 2021:
Male vs Females
Median age
Housing prices:
Average estimated value of townhouses or other attached units in 2021 (9.0% of all units):
Average estimated '21 value of housing units in 3-to-4-unit structures (17.6% of all units):
Average estimated '21 value of housing units in 5-or-more-unit structures (7.5% of all units):
Most popular occupations of males: management occupations (except farmers) (25.6%); business and financial operations occupations (16.0%); computer and mathematical occupations (9.9%); sales and office occupations (9.3%); life, physical, and social science occupations (8.1%); architecture and engineering occupations (7.6%); healthcare practitioners and technical occupations (7.6%)
Most popular occupations of females: business and financial operations occupations (24.3%); management occupations (except farmers) (23.4%); sales and office occupations (14.7%); life, physical, and social science occupations (10.8%); healthcare practitioners and technical occupations (6.1%); arts, design, entertainment, sports, and media occupations (5.1%); architecture and engineering occupations (4.9%)
Highways in this neighborhood: Embankment Rd (State Hwy 28, David G Mugar Way); Charles St (State Hwy 28, State Hwy 2); Charlesbank Rd (State Hwy 28); State Hwy 3 (Longfellow Brg).
Roads and streets: Beacon St; Mount Vernon St; Pinckney St; Chestnut St; Tremont St; Revere St; Myrtle St; Cambridge St; W Cedar St; Phillips St; Joy St; Brimmer St; River St; Cedar Lane Way; Anderson St; Branch St; Grove St; Louisburg Sq; Park St; Garden St; Bowdoin St; Derne St; Byron St; Beaver Pl; S Russell St; Walnut St; Lime St; Irving St; Acorn St; Hancock St; Spruce St; Silver Pl; Spruce Pl; Willow St; Charles River Sq; W Hill Pl; Wadsworth Pl; Temple St; Beaver St; Otis Pl; Park Street Pl; Spruce Ct; Joy Ct; Joy Pl; Smith Ct; Lindall Ct; Pleasure Rd; Mount Vernon Pl; Rollins Pl; Goodwin Pl; Phillips Ct; Sentry Hill Pl; Thompson Ct; River Street Pl; Primus Ave; Strong Pl; Champney Pl; Bellingham Pl; Anderson Pl.
Beacon Hill neighborhood detailed profile
Area: 0.335 square miles
Population: 27,667
Population density:
| Beacon Hill: | 82,629 people per square mile |
| Boston: | 13,511 people per square mile |
Median household income in 2021:
| Beacon Hill: | $97,465 |
| Boston: | $79,283 |
Median rent in in 2021:
| Beacon Hill: | $2,113 |
| Boston: | $1,696 |
Male vs Females
| Males: | 12,760 |
| Females: | 14,907 |
Median age
| Males: | 31.9 years |
| Females: | 31.2 years |
Housing prices:
Average estimated value of townhouses or other attached units in 2021 (9.0% of all units):
| This neighborhood: | $1,973,881 |
| city: | $1,097,292 |
Average estimated '21 value of housing units in 3-to-4-unit structures (17.6% of all units):
| Beacon Hill: | $1,392,925 |
| city: | $745,440 |
Average estimated '21 value of housing units in 5-or-more-unit structures (7.5% of all units):
| Beacon Hill: | $551,560 |
| Boston: | $986,433 |
Most popular occupations of males: management occupations (except farmers) (25.6%); business and financial operations occupations (16.0%); computer and mathematical occupations (9.9%); sales and office occupations (9.3%); life, physical, and social science occupations (8.1%); architecture and engineering occupations (7.6%); healthcare practitioners and technical occupations (7.6%)
Most popular occupations of females: business and financial operations occupations (24.3%); management occupations (except farmers) (23.4%); sales and office occupations (14.7%); life, physical, and social science occupations (10.8%); healthcare practitioners and technical occupations (6.1%); arts, design, entertainment, sports, and media occupations (5.1%); architecture and engineering occupations (4.9%)
Highways in this neighborhood: Embankment Rd (State Hwy 28, David G Mugar Way); Charles St (State Hwy 28, State Hwy 2); Charlesbank Rd (State Hwy 28); State Hwy 3 (Longfellow Brg).
Roads and streets: Beacon St; Mount Vernon St; Pinckney St; Chestnut St; Tremont St; Revere St; Myrtle St; Cambridge St; W Cedar St; Phillips St; Joy St; Brimmer St; River St; Cedar Lane Way; Anderson St; Branch St; Grove St; Louisburg Sq; Park St; Garden St; Bowdoin St; Derne St; Byron St; Beaver Pl; S Russell St; Walnut St; Lime St; Irving St; Acorn St; Hancock St; Spruce St; Silver Pl; Spruce Pl; Willow St; Charles River Sq; W Hill Pl; Wadsworth Pl; Temple St; Beaver St; Otis Pl; Park Street Pl; Spruce Ct; Joy Ct; Joy Pl; Smith Ct; Lindall Ct; Pleasure Rd; Mount Vernon Pl; Rollins Pl; Goodwin Pl; Phillips Ct; Sentry Hill Pl; Thompson Ct; River Street Pl; Primus Ave; Strong Pl; Champney Pl; Bellingham Pl; Anderson Pl.
Beacon Hill neighborhood detailed profile
Boston Common neighborhood in Boston statistics: (Find on map)
Area: 0.125 square miles
Highways in this neighborhood: State Hwy 2 (Arlington St).
Roads and streets: Tremont St; Boylston St.
Boston Common neighborhood detailed profile
Area: 0.125 square miles
Highways in this neighborhood: State Hwy 2 (Arlington St).
Roads and streets: Tremont St; Boylston St.
Boston Common neighborhood detailed profile
Bowdoin North neighborhood in Boston statistics: (Find on map)
Area: 0.258 square miles
Population: 5,256
Population density:
Median household income in 2021:
Median rent in in 2021:
Male vs Females
Median age
Housing prices:
Average estimated value of detached houses in 2021 (7.2% of all units):
Average estimated value of townhouses or other attached units in 2021 (6.3% of all units):
Average estimated value of housing units in 2-unit structures in 2021 (22.3% of all units):
Average estimated '21 value of housing units in 3-to-4-unit structures (51.8% of all units):
Average estimated '21 value of housing units in 5-or-more-unit structures (3.6% of all units):
Most popular occupations of males: service occupations (32.2%); sales and office occupations (18.5%); transportation occupations (9.4%); construction, extraction, and maintenance occupations (9.0%); material moving occupations (7.7%); management occupations (except farmers) (6.6%); production occupations (6.1%)
Most popular occupations of females: service occupations (34.0%); sales and office occupations (29.2%); management occupations (except farmers) (9.5%); production occupations (5.9%); education, training, and library occupations (5.3%); business and financial operations occupations (3.6%); arts, design, entertainment, sports, and media occupations (3.4%)
Roads and streets: Bowdoin St; Olney St; Rosseter St; Hamilton St; Richfield St; Bowdoin Ave; Barry St; Clarkson St; Geneva Ave; Bullard St; Cedar St; Mount Bowdoin Ter; Bellevue St; Norton St; Mallon Rd; Westwood St; Everton St; Puritan Ave; Coleman St; Nottingham St; Wilrose St; Blakeville St; Beechwood St; Mount Bowdoin Green; Inwood St; Rock Ter; Eldon St; Kane St; Bowdoin Park; Columbia Ter; Estes Ave; Dever St; Eunice St; Stanley St; Richfield Park; Davidson Ave; Mac Neil Way; Pilgrim Pl; Barry Park; Rockmount St; Wilcutt Rd; Grant Rd; Elba Ter; Langdon Park.
Bowdoin North neighborhood detailed profile
Area: 0.258 square miles
Population: 5,256
Population density:
| Bowdoin North (Mt Bowdoin): | 20,372 people per square mile |
| Boston: | 13,511 people per square mile |
Median household income in 2021:
| Bowdoin North (Mt Bowdoin): | $57,608 |
| Boston: | $79,283 |
Median rent in in 2021:
| Bowdoin North (Mt Bowdoin): | $1,389 |
| Boston: | $1,696 |
Male vs Females
| Males: | 2,423 |
| Females: | 2,833 |
Median age
| Males: | 31.9 years |
| Females: | 35.9 years |
Housing prices:
Average estimated value of detached houses in 2021 (7.2% of all units):
| Bowdoin North (Mt Bowdoin): | $496,552 |
| Boston: | $683,896 |
Average estimated value of townhouses or other attached units in 2021 (6.3% of all units):
| This neighborhood: | $74,632 |
| city: | $1,097,292 |
Average estimated value of housing units in 2-unit structures in 2021 (22.3% of all units):
| This neighborhood: | $260,982 |
| Boston: | $639,493 |
Average estimated '21 value of housing units in 3-to-4-unit structures (51.8% of all units):
| Bowdoin North (Mt Bowdoin): | $397,444 |
| city: | $745,440 |
Average estimated '21 value of housing units in 5-or-more-unit structures (3.6% of all units):
| Bowdoin North (Mt Bowdoin): | $255,079 |
| Boston: | $986,433 |
Most popular occupations of males: service occupations (32.2%); sales and office occupations (18.5%); transportation occupations (9.4%); construction, extraction, and maintenance occupations (9.0%); material moving occupations (7.7%); management occupations (except farmers) (6.6%); production occupations (6.1%)
Most popular occupations of females: service occupations (34.0%); sales and office occupations (29.2%); management occupations (except farmers) (9.5%); production occupations (5.9%); education, training, and library occupations (5.3%); business and financial operations occupations (3.6%); arts, design, entertainment, sports, and media occupations (3.4%)
Roads and streets: Bowdoin St; Olney St; Rosseter St; Hamilton St; Richfield St; Bowdoin Ave; Barry St; Clarkson St; Geneva Ave; Bullard St; Cedar St; Mount Bowdoin Ter; Bellevue St; Norton St; Mallon Rd; Westwood St; Everton St; Puritan Ave; Coleman St; Nottingham St; Wilrose St; Blakeville St; Beechwood St; Mount Bowdoin Green; Inwood St; Rock Ter; Eldon St; Kane St; Bowdoin Park; Columbia Ter; Estes Ave; Dever St; Eunice St; Stanley St; Richfield Park; Davidson Ave; Mac Neil Way; Pilgrim Pl; Barry Park; Rockmount St; Wilcutt Rd; Grant Rd; Elba Ter; Langdon Park.
Bowdoin North neighborhood detailed profile
Brunswick King neighborhood in Boston statistics: (Find on map)
Area: 0.668 square miles
Population: 16,352
Population density:
Median household income in 2021:
Median rent in in 2021:
Male vs Females
Median age
Housing prices:
Average estimated value of detached houses in 2021 (12.6% of all units):
Average estimated value of townhouses or other attached units in 2021 (12.1% of all units):
Average estimated value of housing units in 2-unit structures in 2021 (20.5% of all units):
Average estimated '21 value of housing units in 3-to-4-unit structures (47.0% of all units):
Average estimated '21 value of housing units in 5-or-more-unit structures (6.0% of all units):
Most popular occupations of males: service occupations (23.7%); sales and office occupations (22.7%); construction, extraction, and maintenance occupations (7.8%); transportation occupations (7.1%); management occupations (except farmers) (6.2%); education, training, and library occupations (4.9%); production occupations (4.6%)
Most popular occupations of females: service occupations (39.5%); sales and office occupations (24.2%); education, training, and library occupations (6.8%); management occupations (except farmers) (5.7%); transportation occupations (5.7%); healthcare practitioners and technical occupations (5.1%); community and social services occupations (4.9%)
Roads and streets: Magnolia St; Dudley St; Howard Ave; Shirley St; Columbia Rd; Geneva Ave; Quincy St; Clifton St; Devon St; Alexander St; Wayland St; Normandy St; Brook Ave; Hartford St; Stanwood St; Intervale St; Burrell St; Dacia St; Langdon St; W Cottage St; Norfolk Ave; Ceylon St; Vaughan Ave; E Cottage St; Proctor St; Sargent St; Dennis St; Julian St; Lawrence Ave; Marshfield St; Batchelder St; Dewey St; Robin Hood St; Brookford St; Folsom St; Robey St; Woodward Ave; Clarence St; Woodford St; Judson St; Woodcliff St; Rockford St; Leyland St; Lingard St; Gayland St; Cunningham St; Shetland St; Dean St; Burgess St; Harlow St; Albion St; Mascoma St; George St; Danube St; Chamblet St; Massachusetts Ave; Oldfields Rd; Woodville St; Creston St; Fayston St; North Ave; Fernboro St; Beauford Ln; Half Moon St; Napa St; Woodward Park St; Moreland St; Greenheys St; Brinsley St; Coleus Park; Bird St; Winthrop St; Wyola Pl; Morse St; Longmeadow St; Laredo St; Brunswick St; Balfour St; Rand St; Woodville Park; Ronald St; Magnolia Sq; Dalkeith St; Roswell St; Lester St; Dunkeld St; Gouldville Ter; Dalin Pl; Dromey St; Magnolia Pl; Emrose Ter; Perth St; Woodledge St; Rand Pl; Victor St; Oleander St; Partridge Pl; Hartford Ter; Lebanon St; Howard Pl; Dove Ct; Hartford Ct; Sherwood Ct; Dove St; Lewis Pl; Langdon Ter; Creston Park; Miller Park; Readfield Pl; Sweetfern Ter; Stanwood Ter; Rollins Ct; Letterfine Ter; Cottage Ct; Downey Ct; Columbia Ter; Randlett Pl; Toland Ct; Intervale Ter; Jarvis Pl; Dewey Ter; Hall Ave.
Railroad features: Mbta Commuter Rail; Penn Central RR.
Brunswick King neighborhood detailed profile
Area: 0.668 square miles
Population: 16,352
Population density:
| Brunswick King (Dudley): | 24,474 people per square mile |
| Boston: | 13,511 people per square mile |
Median household income in 2021:
| Brunswick King (Dudley): | $50,265 |
| Boston: | $79,283 |
Median rent in in 2021:
| Brunswick King (Dudley): | $1,031 |
| Boston: | $1,696 |
Male vs Females
| Males: | 8,060 |
| Females: | 8,291 |
Median age
| Males: | 30.0 years |
| Females: | 36.8 years |
Housing prices:
Average estimated value of detached houses in 2021 (12.6% of all units):
| Brunswick King (Dudley): | $533,371 |
| Boston: | $683,896 |
Average estimated value of townhouses or other attached units in 2021 (12.1% of all units):
| This neighborhood: | $727,754 |
| city: | $1,097,292 |
Average estimated value of housing units in 2-unit structures in 2021 (20.5% of all units):
| This neighborhood: | $650,475 |
| Boston: | $639,493 |
Average estimated '21 value of housing units in 3-to-4-unit structures (47.0% of all units):
| Brunswick King (Dudley): | $492,856 |
| city: | $745,440 |
Average estimated '21 value of housing units in 5-or-more-unit structures (6.0% of all units):
| Brunswick King (Dudley): | $325,847 |
| Boston: | $986,433 |
Most popular occupations of males: service occupations (23.7%); sales and office occupations (22.7%); construction, extraction, and maintenance occupations (7.8%); transportation occupations (7.1%); management occupations (except farmers) (6.2%); education, training, and library occupations (4.9%); production occupations (4.6%)
Most popular occupations of females: service occupations (39.5%); sales and office occupations (24.2%); education, training, and library occupations (6.8%); management occupations (except farmers) (5.7%); transportation occupations (5.7%); healthcare practitioners and technical occupations (5.1%); community and social services occupations (4.9%)
Roads and streets: Magnolia St; Dudley St; Howard Ave; Shirley St; Columbia Rd; Geneva Ave; Quincy St; Clifton St; Devon St; Alexander St; Wayland St; Normandy St; Brook Ave; Hartford St; Stanwood St; Intervale St; Burrell St; Dacia St; Langdon St; W Cottage St; Norfolk Ave; Ceylon St; Vaughan Ave; E Cottage St; Proctor St; Sargent St; Dennis St; Julian St; Lawrence Ave; Marshfield St; Batchelder St; Dewey St; Robin Hood St; Brookford St; Folsom St; Robey St; Woodward Ave; Clarence St; Woodford St; Judson St; Woodcliff St; Rockford St; Leyland St; Lingard St; Gayland St; Cunningham St; Shetland St; Dean St; Burgess St; Harlow St; Albion St; Mascoma St; George St; Danube St; Chamblet St; Massachusetts Ave; Oldfields Rd; Woodville St; Creston St; Fayston St; North Ave; Fernboro St; Beauford Ln; Half Moon St; Napa St; Woodward Park St; Moreland St; Greenheys St; Brinsley St; Coleus Park; Bird St; Winthrop St; Wyola Pl; Morse St; Longmeadow St; Laredo St; Brunswick St; Balfour St; Rand St; Woodville Park; Ronald St; Magnolia Sq; Dalkeith St; Roswell St; Lester St; Dunkeld St; Gouldville Ter; Dalin Pl; Dromey St; Magnolia Pl; Emrose Ter; Perth St; Woodledge St; Rand Pl; Victor St; Oleander St; Partridge Pl; Hartford Ter; Lebanon St; Howard Pl; Dove Ct; Hartford Ct; Sherwood Ct; Dove St; Lewis Pl; Langdon Ter; Creston Park; Miller Park; Readfield Pl; Sweetfern Ter; Stanwood Ter; Rollins Ct; Letterfine Ter; Cottage Ct; Downey Ct; Columbia Ter; Randlett Pl; Toland Ct; Intervale Ter; Jarvis Pl; Dewey Ter; Hall Ave.
Railroad features: Mbta Commuter Rail; Penn Central RR.
Brunswick King neighborhood detailed profile
Chinatown neighborhood in Boston statistics: (Find on map)
Area: 0.188 square miles
Population: 6,546
Population density:
Median household income in 2021:
Median rent in in 2021:
Male vs Females
Median age
Most popular occupations of males: service occupations (31.1%); management occupations (except farmers) (23.6%); computer and mathematical occupations (17.9%); legal occupations (16.5%); construction, extraction, and maintenance occupations (8.1%); business and financial operations occupations (6.5%); healthcare practitioners and technical occupations (5.9%)
Most popular occupations of females: sales and office occupations (27.5%); service occupations (23.8%); management occupations (except farmers) (17.6%); business and financial operations occupations (10.6%); arts, design, entertainment, sports, and media occupations (7.5%); education, training, and library occupations (4.4%); healthcare practitioners and technical occupations (4.4%)
Limited-access highways (interstate or state) in this neighborhood: I- 90 (Massachusetts Tpke); John F Fitzgerald Expy (State Hwy 3, I- 93, US Hwy 1).
Highways in this neighborhood: Stuart St (State Hwy 28); State Hwy 2 (Boylston St).
Roads and streets: Tremont St; Marginal Rd; Tyler St; Harrison Ave; Washington St; Hudson St; Charles St S; Church St; Melrose St; Oak St; Arlington St; Fayette St; Winchester St; Park Plz; Piedmont St; Cortes St; Harvard St; N144; Dore St; Pine St; Beach St; Shawmut Ave; Oak St W; Ash St; Warrenton St; May Pl; Kneeland St; Columbus Ave; Nassau St; Common St; Eliot St; Bennet St; Shawmut St; Seaver Pl; Maple Pl; Berkeley St; Johnny Ct; Warrenton Pl; Broadway; Tai-Tung St; Hadassah Way; Park Sq; Knox St; Jefferson St; Corey Ave; Edgerly Pl; S Cedar Pl; Lyndeboro Pl; Oak Pl; Dingley Pl; Kingston St.
Railroad features: Amtrak RR (Mbta Commuter Rail); Amtrak RR (Mbta Orange Line RR, Mbta Commuter Rail).
Chinatown neighborhood detailed profile
Area: 0.188 square miles
Population: 6,546
Population density:
| Chinatown (Bay Village): | 34,765 people per square mile |
| Boston: | 13,511 people per square mile |
Median household income in 2021:
| Chinatown (Bay Village): | $128,313 |
| Boston: | $79,283 |
Median rent in in 2021:
| Chinatown (Bay Village): | $1,259 |
| Boston: | $1,696 |
Male vs Females
| Males: | 2,525 |
| Females: | 4,021 |
Median age
| Males: | 37.8 years |
| Females: | 31.2 years |
Most popular occupations of males: service occupations (31.1%); management occupations (except farmers) (23.6%); computer and mathematical occupations (17.9%); legal occupations (16.5%); construction, extraction, and maintenance occupations (8.1%); business and financial operations occupations (6.5%); healthcare practitioners and technical occupations (5.9%)
Most popular occupations of females: sales and office occupations (27.5%); service occupations (23.8%); management occupations (except farmers) (17.6%); business and financial operations occupations (10.6%); arts, design, entertainment, sports, and media occupations (7.5%); education, training, and library occupations (4.4%); healthcare practitioners and technical occupations (4.4%)
Limited-access highways (interstate or state) in this neighborhood: I- 90 (Massachusetts Tpke); John F Fitzgerald Expy (State Hwy 3, I- 93, US Hwy 1).
Highways in this neighborhood: Stuart St (State Hwy 28); State Hwy 2 (Boylston St).
Roads and streets: Tremont St; Marginal Rd; Tyler St; Harrison Ave; Washington St; Hudson St; Charles St S; Church St; Melrose St; Oak St; Arlington St; Fayette St; Winchester St; Park Plz; Piedmont St; Cortes St; Harvard St; N144; Dore St; Pine St; Beach St; Shawmut Ave; Oak St W; Ash St; Warrenton St; May Pl; Kneeland St; Columbus Ave; Nassau St; Common St; Eliot St; Bennet St; Shawmut St; Seaver Pl; Maple Pl; Berkeley St; Johnny Ct; Warrenton Pl; Broadway; Tai-Tung St; Hadassah Way; Park Sq; Knox St; Jefferson St; Corey Ave; Edgerly Pl; S Cedar Pl; Lyndeboro Pl; Oak Pl; Dingley Pl; Kingston St.
Railroad features: Amtrak RR (Mbta Commuter Rail); Amtrak RR (Mbta Orange Line RR, Mbta Commuter Rail).
Chinatown neighborhood detailed profile
City Point neighborhood in Boston statistics: (Find on map)
Area: 0.375 square miles
Population: 8,329
Population density:
Median household income in 2021:
Median rent in in 2021:
Male vs Females
Median age
Housing prices:
Average estimated value of detached houses in 2021 (11.3% of all units):
Average estimated value of townhouses or other attached units in 2021 (16.8% of all units):
Average estimated value of housing units in 2-unit structures in 2021 (17.3% of all units):
Average estimated '21 value of housing units in 3-to-4-unit structures (51.6% of all units):
Most popular occupations of males: sales and office occupations (34.9%); business and financial operations occupations (16.4%); arts, design, entertainment, sports, and media occupations (14.5%); management occupations (except farmers) (12.4%); service occupations (9.6%); computer and mathematical occupations (3.7%); construction, extraction, and maintenance occupations (2.7%)
Most popular occupations of females: sales and office occupations (24.1%); business and financial operations occupations (17.8%); management occupations (except farmers) (16.1%); healthcare practitioners and technical occupations (14.2%); education, training, and library occupations (7.7%); service occupations (6.9%); computer and mathematical occupations (6.3%)
Roads and streets: E Broadway; E 3rd St; E 2nd St; William J Day Blvd; Columbia Rd; E 6th St; E 5th St; E 4th St; N St; O St; P St; E 8th St; E 7th St; Farragut Rd; M St; Emerson St; Marine Rd; Swallow St; K St; H St; L St; I St; Bantry Way; Kemble Pl; Lennon Ct; Twomey Ct; Peters St; Monks St; Emmet St; Hardy St; G St; Butland Ct; Newhill Pl; H Street Pl; Linley Ter; Ross Pl; Barrett Ave; O Street Pl; Dean Way; Balmoral Park; Burnham Pl; Bernard Pl; Lauten Pl; Flint Pl; K Street Pl; Schrepel Pl; Barnard Pl; Scott Pl; Leonard Pl; Grace Ct.
City Point neighborhood detailed profile
Area: 0.375 square miles
Population: 8,329
Population density:
| City Point: | 22,207 people per square mile |
| Boston: | 13,511 people per square mile |
Median household income in 2021:
| City Point: | $130,915 |
| Boston: | $79,283 |
Median rent in in 2021:
| City Point: | $2,665 |
| Boston: | $1,696 |
Male vs Females
| Males: | 4,164 |
| Females: | 4,164 |
Median age
| Males: | 28.9 years |
| Females: | 30.9 years |
Housing prices:
Average estimated value of detached houses in 2021 (11.3% of all units):
| City Point: | $655,093 |
| Boston: | $683,896 |
Average estimated value of townhouses or other attached units in 2021 (16.8% of all units):
| This neighborhood: | $624,012 |
| city: | $1,097,292 |
Average estimated value of housing units in 2-unit structures in 2021 (17.3% of all units):
| This neighborhood: | $709,394 |
| Boston: | $639,493 |
Average estimated '21 value of housing units in 3-to-4-unit structures (51.6% of all units):
| City Point: | $526,093 |
| city: | $745,440 |
Most popular occupations of males: sales and office occupations (34.9%); business and financial operations occupations (16.4%); arts, design, entertainment, sports, and media occupations (14.5%); management occupations (except farmers) (12.4%); service occupations (9.6%); computer and mathematical occupations (3.7%); construction, extraction, and maintenance occupations (2.7%)
Most popular occupations of females: sales and office occupations (24.1%); business and financial operations occupations (17.8%); management occupations (except farmers) (16.1%); healthcare practitioners and technical occupations (14.2%); education, training, and library occupations (7.7%); service occupations (6.9%); computer and mathematical occupations (6.3%)
Roads and streets: E Broadway; E 3rd St; E 2nd St; William J Day Blvd; Columbia Rd; E 6th St; E 5th St; E 4th St; N St; O St; P St; E 8th St; E 7th St; Farragut Rd; M St; Emerson St; Marine Rd; Swallow St; K St; H St; L St; I St; Bantry Way; Kemble Pl; Lennon Ct; Twomey Ct; Peters St; Monks St; Emmet St; Hardy St; G St; Butland Ct; Newhill Pl; H Street Pl; Linley Ter; Ross Pl; Barrett Ave; O Street Pl; Dean Way; Balmoral Park; Burnham Pl; Bernard Pl; Lauten Pl; Flint Pl; K Street Pl; Schrepel Pl; Barnard Pl; Scott Pl; Leonard Pl; Grace Ct.
City Point neighborhood detailed profile
Codman Sq neighborhood in Boston statistics: (Find on map)
Area: 0.491 square miles
Population: 11,396
Population density:
Median household income in 2021:
Median rent in in 2021:
Male vs Females
Median age
Housing prices:
Average estimated value of detached houses in 2021 (19.4% of all units):
Average estimated value of townhouses or other attached units in 2021 (11.9% of all units):
Average estimated value of housing units in 2-unit structures in 2021 (20.6% of all units):
Average estimated '21 value of housing units in 3-to-4-unit structures (42.5% of all units):
Average estimated '21 value of housing units in 5-or-more-unit structures (21.2% of all units):
Most popular occupations of males: service occupations (26.7%); transportation occupations (19.6%); sales and office occupations (18.9%); construction, extraction, and maintenance occupations (6.2%); management occupations (except farmers) (4.3%); material moving occupations (3.4%); healthcare practitioners and technical occupations (3.1%)
Most popular occupations of females: service occupations (41.1%); sales and office occupations (22.0%); management occupations (except farmers) (10.3%); healthcare practitioners and technical occupations (6.7%); education, training, and library occupations (5.8%); business and financial operations occupations (4.0%); community and social services occupations (3.3%)
Roads and streets: Washington St; Norwell St; Millet St; Southern Ave; Norfolk St; Park St; Whitfield St; Spencer St; Harvard St; Talbot Ave; School St; Torrey St; Athelwold St; Radcliffe St; Colonial Ave; Aspinwall Rd; W Tremlett St; Wheatland Ave; Dunlap St; Algonquin St; Rosedale St; Nevada St; Driscoll Dr; Fendale Ave; New England Ave; Codman Hill Ave; Thane St; Wentworth St; Peacevale Rd; Whitman St; Bradlee St; Elmont St; Fairmount St; Ripley Rd; Dunbar Ave; Kenberma Rd; Shafter St; Mallard Ave; Carmen St; Waterlow St; Withington St; Vassar St; Oakwood St; Chipman St; Gaylord St; Euclid St; Wentworth Ter; Elmhurst St; Ferndale St; Chamberlain St; Wilmington Ave; Darlington St; Ogden St; Merlin St; Epping St; Moody St; Herbert St; Hopestill St; Claridge Ter; Elwyn Rd; Richard Ter; Arvale Rd; Lynnville Ter; Harvard Ave; Harvard Park; Champlain Cir; Jayjay Dr.
Codman Sq neighborhood detailed profile
Area: 0.491 square miles
Population: 11,396
Population density:
| Codman Sq (East Codman Hill): | 23,229 people per square mile |
| Boston: | 13,511 people per square mile |
Median household income in 2021:
| Codman Sq (East Codman Hill): | $68,054 |
| Boston: | $79,283 |
Median rent in in 2021:
| Codman Sq (East Codman Hill): | $1,652 |
| Boston: | $1,696 |
Male vs Females
| Males: | 5,147 |
| Females: | 6,249 |
Median age
| Males: | 33.7 years |
| Females: | 36.3 years |
Housing prices:
Average estimated value of detached houses in 2021 (19.4% of all units):
| Codman Sq (East Codman Hill): | $488,496 |
| Boston: | $683,896 |
Average estimated value of townhouses or other attached units in 2021 (11.9% of all units):
| This neighborhood: | $332,000 |
| city: | $1,097,292 |
Average estimated value of housing units in 2-unit structures in 2021 (20.6% of all units):
| This neighborhood: | $370,615 |
| Boston: | $639,493 |
Average estimated '21 value of housing units in 3-to-4-unit structures (42.5% of all units):
| Codman Sq (East Codman Hill): | $374,800 |
| city: | $745,440 |
Average estimated '21 value of housing units in 5-or-more-unit structures (21.2% of all units):
| Codman Sq (East Codman Hill): | $556,800 |
| Boston: | $986,433 |
Most popular occupations of males: service occupations (26.7%); transportation occupations (19.6%); sales and office occupations (18.9%); construction, extraction, and maintenance occupations (6.2%); management occupations (except farmers) (4.3%); material moving occupations (3.4%); healthcare practitioners and technical occupations (3.1%)
Most popular occupations of females: service occupations (41.1%); sales and office occupations (22.0%); management occupations (except farmers) (10.3%); healthcare practitioners and technical occupations (6.7%); education, training, and library occupations (5.8%); business and financial operations occupations (4.0%); community and social services occupations (3.3%)
Roads and streets: Washington St; Norwell St; Millet St; Southern Ave; Norfolk St; Park St; Whitfield St; Spencer St; Harvard St; Talbot Ave; School St; Torrey St; Athelwold St; Radcliffe St; Colonial Ave; Aspinwall Rd; W Tremlett St; Wheatland Ave; Dunlap St; Algonquin St; Rosedale St; Nevada St; Driscoll Dr; Fendale Ave; New England Ave; Codman Hill Ave; Thane St; Wentworth St; Peacevale Rd; Whitman St; Bradlee St; Elmont St; Fairmount St; Ripley Rd; Dunbar Ave; Kenberma Rd; Shafter St; Mallard Ave; Carmen St; Waterlow St; Withington St; Vassar St; Oakwood St; Chipman St; Gaylord St; Euclid St; Wentworth Ter; Elmhurst St; Ferndale St; Chamberlain St; Wilmington Ave; Darlington St; Ogden St; Merlin St; Epping St; Moody St; Herbert St; Hopestill St; Claridge Ter; Elwyn Rd; Richard Ter; Arvale Rd; Lynnville Ter; Harvard Ave; Harvard Park; Champlain Cir; Jayjay Dr.
Codman Sq neighborhood detailed profile
Columbia Point neighborhood in Boston statistics: (Find on map)
Area: 1.646 square miles
Population: 22,528
Population density:
Median household income in 2021:
Median rent in in 2021:
Male vs Females
Median age
Housing prices:
Average estimated value of detached houses in 2021 (11.8% of all units):
Average estimated value of townhouses or other attached units in 2021 (2.7% of all units):
Average estimated value of housing units in 2-unit structures in 2021 (12.0% of all units):
Average estimated '21 value of housing units in 3-to-4-unit structures (56.2% of all units):
Average estimated '21 value of housing units in 5-or-more-unit structures (17.5% of all units):
Most popular occupations of males: sales and office occupations (14.9%); management occupations (except farmers) (13.4%); service occupations (12.2%); computer and mathematical occupations (10.5%); construction, extraction, and maintenance occupations (10.1%); business and financial operations occupations (7.6%); life, physical, and social science occupations (5.1%)
Most popular occupations of females: service occupations (17.2%); sales and office occupations (17.1%); management occupations (except farmers) (13.0%); business and financial operations occupations (11.1%); education, training, and library occupations (7.7%); healthcare practitioners and technical occupations (7.5%); life, physical, and social science occupations (5.9%)
Limited-access highways (interstate or state) in this neighborhood: US Hwy 1 (State Hwy 3, I- 93, John F Fitzgerald Expy, General Pulaski Skwy).
Roads and streets: William T Morrissey Blvd; Mount Vernon St; Savin Hill Ave; Dorchester Ave; Massachusetts Ave; Newmarket Sq; Sydney St; Grampian Way; Columbia Rd; Auckland St; Boston St; Southampton St; Harbor Point Blvd; Freeport St; N Point Dr; Ocean View Dr; S Bay Ave; Westwind Rd; Buttonwood St; Roseclair St; Beach Point Pl; Edison Green; Romsey St; Harbor View St; Sudan St; Sagamore St; Crescent Ave; Bay St; E Cottage St; N120; Saxton St; N433; Enterprise St; St Margaret St; Harvest St; Tuttle St; Island View Pl; Clapp St; Mayhew St; Dorset St; Locust St; Von Hillern St; Peninsula Pl; Belfort St; Bradston St; Moseley St; Bellflower St; Topeka St; Norfolk Ave; S Point Dr; Theodore Glynn Way; Harbor Crest Ct; Washburn St; Doris St; Howell St; Deer St; Spring Garden St; Denny St; Elton St; Newport St; W Howell St; Alpine Way; Carson St; Dewar St; Pond St; Southview St; Atkinson St; Grant St; Caspian Way; Willow Ct; Maryland St; Oyster Bay Rd; St William St; Castlerock St; Hallam St; Moore St; Rockmere St; Midland St; Raven St; Hartland St; Springdale St; Thornley St; Hubbardston Rd; Howard Johnson Plz; Greenmount St; Evandale Ter; S Sydney St; Playstead Rd; Fox Point Rd; Treadway Rd; Rawson St; Grafton St; Cottrell St; Cummings St; Roach St; W Bellflower St; Bayside St; Baker Ct; Melvinside Ter; Lasalle Park; Dunn St; Buttonwood Ct; Old Colony Ter; Greenhalge St; Graham Ct; Davitt St; Fields Ct; Wedmore St; Allstate Rd; Savin Hill Ct; Service Pl; Romsey Cir; Franklin Ct; Sea View Ter; Wave Ave; Savin Hill Ln; Sexton Ct; N380; Harvest Ter; Power St; Romsey Ter; Savin Hill Ter; Napier Park.
Railroad features: Mbta Red Line RR; Penn Central RR.
Columbia Point neighborhood detailed profile
Area: 1.646 square miles
Population: 22,528
Population density:
| Columbia Point (Columbia Pt): | 13,688 people per square mile |
| Boston: | 13,511 people per square mile |
Median household income in 2021:
| Columbia Point (Columbia Pt): | $81,498 |
| Boston: | $79,283 |
Median rent in in 2021:
| Columbia Point (Columbia Pt): | $1,706 |
| Boston: | $1,696 |
Male vs Females
| Males: | 11,068 |
| Females: | 11,459 |
Median age
| Males: | 34.6 years |
| Females: | 37.4 years |
Housing prices:
Average estimated value of detached houses in 2021 (11.8% of all units):
| Columbia Point (Columbia Pt): | $637,740 |
| Boston: | $683,896 |
Average estimated value of townhouses or other attached units in 2021 (2.7% of all units):
| This neighborhood: | $546,011 |
| city: | $1,097,292 |
Average estimated value of housing units in 2-unit structures in 2021 (12.0% of all units):
| This neighborhood: | $703,586 |
| Boston: | $639,493 |
Average estimated '21 value of housing units in 3-to-4-unit structures (56.2% of all units):
| Columbia Point (Columbia Pt): | $493,520 |
| city: | $745,440 |
Average estimated '21 value of housing units in 5-or-more-unit structures (17.5% of all units):
| Columbia Point (Columbia Pt): | $540,795 |
| Boston: | $986,433 |
Most popular occupations of males: sales and office occupations (14.9%); management occupations (except farmers) (13.4%); service occupations (12.2%); computer and mathematical occupations (10.5%); construction, extraction, and maintenance occupations (10.1%); business and financial operations occupations (7.6%); life, physical, and social science occupations (5.1%)
Most popular occupations of females: service occupations (17.2%); sales and office occupations (17.1%); management occupations (except farmers) (13.0%); business and financial operations occupations (11.1%); education, training, and library occupations (7.7%); healthcare practitioners and technical occupations (7.5%); life, physical, and social science occupations (5.9%)
Limited-access highways (interstate or state) in this neighborhood: US Hwy 1 (State Hwy 3, I- 93, John F Fitzgerald Expy, General Pulaski Skwy).
Roads and streets: William T Morrissey Blvd; Mount Vernon St; Savin Hill Ave; Dorchester Ave; Massachusetts Ave; Newmarket Sq; Sydney St; Grampian Way; Columbia Rd; Auckland St; Boston St; Southampton St; Harbor Point Blvd; Freeport St; N Point Dr; Ocean View Dr; S Bay Ave; Westwind Rd; Buttonwood St; Roseclair St; Beach Point Pl; Edison Green; Romsey St; Harbor View St; Sudan St; Sagamore St; Crescent Ave; Bay St; E Cottage St; N120; Saxton St; N433; Enterprise St; St Margaret St; Harvest St; Tuttle St; Island View Pl; Clapp St; Mayhew St; Dorset St; Locust St; Von Hillern St; Peninsula Pl; Belfort St; Bradston St; Moseley St; Bellflower St; Topeka St; Norfolk Ave; S Point Dr; Theodore Glynn Way; Harbor Crest Ct; Washburn St; Doris St; Howell St; Deer St; Spring Garden St; Denny St; Elton St; Newport St; W Howell St; Alpine Way; Carson St; Dewar St; Pond St; Southview St; Atkinson St; Grant St; Caspian Way; Willow Ct; Maryland St; Oyster Bay Rd; St William St; Castlerock St; Hallam St; Moore St; Rockmere St; Midland St; Raven St; Hartland St; Springdale St; Thornley St; Hubbardston Rd; Howard Johnson Plz; Greenmount St; Evandale Ter; S Sydney St; Playstead Rd; Fox Point Rd; Treadway Rd; Rawson St; Grafton St; Cottrell St; Cummings St; Roach St; W Bellflower St; Bayside St; Baker Ct; Melvinside Ter; Lasalle Park; Dunn St; Buttonwood Ct; Old Colony Ter; Greenhalge St; Graham Ct; Davitt St; Fields Ct; Wedmore St; Allstate Rd; Savin Hill Ct; Service Pl; Romsey Cir; Franklin Ct; Sea View Ter; Wave Ave; Savin Hill Ln; Sexton Ct; N380; Harvest Ter; Power St; Romsey Ter; Savin Hill Ter; Napier Park.
Railroad features: Mbta Red Line RR; Penn Central RR.
Columbia Point neighborhood detailed profile
Columbus Park neighborhood in Boston statistics: (Find on map)
Area: 0.738 square miles
Population: 23,750
Population density:
Median household income in 2021:
Median rent in in 2021:
Male vs Females
Median age
Housing prices:
Average estimated value of detached houses in 2021 (14.9% of all units):
Average estimated value of townhouses or other attached units in 2021 (14.4% of all units):
Average estimated value of housing units in 2-unit structures in 2021 (16.0% of all units):
Average estimated '21 value of housing units in 3-to-4-unit structures (33.7% of all units):
Average estimated '21 value of housing units in 5-or-more-unit structures (12.8% of all units):
Most popular occupations of males: sales and office occupations (18.9%); management occupations (except farmers) (15.5%); architecture and engineering occupations (14.6%); service occupations (13.0%); computer and mathematical occupations (10.4%); business and financial operations occupations (8.5%); construction, extraction, and maintenance occupations (6.7%)
Most popular occupations of females: business and financial operations occupations (19.6%); sales and office occupations (19.5%); service occupations (18.7%); management occupations (except farmers) (9.0%); healthcare practitioners and technical occupations (7.2%); education, training, and library occupations (6.9%); life, physical, and social science occupations (5.0%)
Limited-access highways (interstate or state) in this neighborhood: State Hwy 3 (I- 93, US Hwy 1, Southeast Expy).
Roads and streets: Columbia Rd; Old Colony Ave; Dorchester Ave; Frontage Rd; Widett Cir; William J Day Blvd; N380; Southampton St; Msgr O'Callaghan Way; N118; E 8th St; Dorchester St; Devine Way; Preble St; Mercer St; Damrell St; Alger St; Logan Way; W 4th St; Foundry St; Patterson Way; Ellery St; Foodmart Rd; Middle St; Murray Way; Old Harbor St; Rev Richard A Burke St (Burke St); Vinton St; Gavin Way; Telegraph St; Woodward St; Ward St; D St; Columbia Rd Rotary; Oconnor Way; Rogers St; E 9th St; Ewer St; Sterling Sq; Gates St; W Broadway; Jenkins St; Pilsudski Way; Access Rd; Leeds St; Boston St; Kemp St; McDonough Way; Tuckerman St; Humboldt Pl; Dexter St; Goodwin Ct; Carmody Ct; Greenbaum St; N113; Darius Ct; New Broadway Brg; Trimount Pl; Father Songin Way; Ward Ct; Milhender Pl; Knowlton St; Carpenter St; Covington St; Andrew Sq; Mohawk St; Glover Ct; Wendeller St; N124; Wadleigh Pl; Gifford Pl; Transit St; Liberty Pl; Plummer Pl; Woodward Pl; Wendell Pl; Sayward Pl.
Railroad features: Penn Central RR.
Columbus Park neighborhood detailed profile
Area: 0.738 square miles
Population: 23,750
Population density:
| Columbus Park (Andrew Square): | 32,200 people per square mile |
| Boston: | 13,511 people per square mile |
Median household income in 2021:
| Columbus Park (Andrew Square): | $118,013 |
| Boston: | $79,283 |
Median rent in in 2021:
| Columbus Park (Andrew Square): | $1,673 |
| Boston: | $1,696 |
Male vs Females
| Males: | 11,997 |
| Females: | 11,753 |
Median age
| Males: | 31.5 years |
| Females: | 35.6 years |
Housing prices:
Average estimated value of detached houses in 2021 (14.9% of all units):
| Columbus Park (Andrew Square): | $775,855 |
| Boston: | $683,896 |
Average estimated value of townhouses or other attached units in 2021 (14.4% of all units):
| This neighborhood: | $844,445 |
| city: | $1,097,292 |
Average estimated value of housing units in 2-unit structures in 2021 (16.0% of all units):
| This neighborhood: | $890,561 |
| Boston: | $639,493 |
Average estimated '21 value of housing units in 3-to-4-unit structures (33.7% of all units):
| Columbus Park (Andrew Square): | $691,471 |
| city: | $745,440 |
Average estimated '21 value of housing units in 5-or-more-unit structures (12.8% of all units):
| Columbus Park (Andrew Square): | $620,159 |
| Boston: | $986,433 |
Most popular occupations of males: sales and office occupations (18.9%); management occupations (except farmers) (15.5%); architecture and engineering occupations (14.6%); service occupations (13.0%); computer and mathematical occupations (10.4%); business and financial operations occupations (8.5%); construction, extraction, and maintenance occupations (6.7%)
Most popular occupations of females: business and financial operations occupations (19.6%); sales and office occupations (19.5%); service occupations (18.7%); management occupations (except farmers) (9.0%); healthcare practitioners and technical occupations (7.2%); education, training, and library occupations (6.9%); life, physical, and social science occupations (5.0%)
Limited-access highways (interstate or state) in this neighborhood: State Hwy 3 (I- 93, US Hwy 1, Southeast Expy).
Roads and streets: Columbia Rd; Old Colony Ave; Dorchester Ave; Frontage Rd; Widett Cir; William J Day Blvd; N380; Southampton St; Msgr O'Callaghan Way; N118; E 8th St; Dorchester St; Devine Way; Preble St; Mercer St; Damrell St; Alger St; Logan Way; W 4th St; Foundry St; Patterson Way; Ellery St; Foodmart Rd; Middle St; Murray Way; Old Harbor St; Rev Richard A Burke St (Burke St); Vinton St; Gavin Way; Telegraph St; Woodward St; Ward St; D St; Columbia Rd Rotary; Oconnor Way; Rogers St; E 9th St; Ewer St; Sterling Sq; Gates St; W Broadway; Jenkins St; Pilsudski Way; Access Rd; Leeds St; Boston St; Kemp St; McDonough Way; Tuckerman St; Humboldt Pl; Dexter St; Goodwin Ct; Carmody Ct; Greenbaum St; N113; Darius Ct; New Broadway Brg; Trimount Pl; Father Songin Way; Ward Ct; Milhender Pl; Knowlton St; Carpenter St; Covington St; Andrew Sq; Mohawk St; Glover Ct; Wendeller St; N124; Wadleigh Pl; Gifford Pl; Transit St; Liberty Pl; Plummer Pl; Woodward Pl; Wendell Pl; Sayward Pl.
Railroad features: Penn Central RR.
Columbus Park neighborhood detailed profile
Dorchester neighborhood in Boston statistics: (Find on map)
Area: 6.101 square miles
Population: 107,137
Population density:
Median household income in 2021:
Median rent in in 2021:
Male vs Females
Median age
Housing prices:
Average estimated value of detached houses in 2021 (15.1% of all units):
Average estimated value of townhouses or other attached units in 2021 (6.5% of all units):
Average estimated value of housing units in 2-unit structures in 2021 (21.1% of all units):
Average estimated '21 value of housing units in 3-to-4-unit structures (43.8% of all units):
Average estimated '21 value of housing units in 5-or-more-unit structures (13.9% of all units):
Most popular occupations of males: service occupations (23.5%); sales and office occupations (16.1%); management occupations (except farmers) (8.3%); transportation occupations (8.1%); construction, extraction, and maintenance occupations (7.6%); business and financial operations occupations (5.3%); computer and mathematical occupations (5.3%)
Most popular occupations of females: service occupations (26.7%); sales and office occupations (23.8%); management occupations (except farmers) (9.4%); healthcare practitioners and technical occupations (8.5%); education, training, and library occupations (8.0%); business and financial operations occupations (6.2%); community and social services occupations (4.0%)
Mass transit rail lines: .
Other features: Neponset Riv.
Limited-access highways (interstate or state) in this neighborhood: US Hwy 1 (State Hwy 3, I- 93, John F Fitzgerald Expy, General Pulaski Skwy).
Highways in this neighborhood: Gallivan Blvd (State Hwy 203).
Roads and streets: William T Morrissey Blvd; Dorchester Ave; Adams St; Washington St; Park St; Mount Vernon St; Ashmont St; Savin Hill Ave; Neponset Ave; Columbia Rd; Freeport St; Bowdoin St; Minot St; Centre St; Talbot Ave; Geneva Ave; Massachusetts Ave; Victory Rd; Milton St; E Cottage St; Hancock St; Norwell St; Newmarket Sq; Melville Ave; King St; Westville St; Sydney St; Pleasant St; Hamilton St; Grampian Way; Richmond St; Welles Ave; Wrentham St; Auckland St; Walnut St; Boston St; Homes Ave; Cushing Ave; Southampton St; Msgr Patrick J Lydon Way; Olney St; Train St; Quincy St; Harbor Point Blvd; Millet St; Hallet St; Elmer Rd; Bailey St; Dakota St; Conley St; Rosseter St; Bellevue St; Sawyer Ave; Tenean St; Southern Ave; Fuller St; Tonawanda St; Hill Top St; Parkman St; N Point Dr; Norfolk St; Draper St; Beaumont St; Whitfield St; Spencer St; Pierce Ave; Wheatland Ave; Bowdoin Ave; Lonsdale St; Gibson St; Chickatawbut St; Westglow St; Harvard St; Mount Ida Rd; Bloomfield St; St Marks Rd; Mather St; Stoughton St; Clarkson St; Brent St; Ocean View Dr; Richfield St; Whitten St; Waldeck St; Oakton Ave; Florida St; S Bay Ave; Granite Ave; Dix St; Church St; Bird St; Ashland St; Charles St; Carruth St; Glendale St; Burt St; Tremlett St; Moultrie St; Mill St; Westwind Rd; Linden St; Buttonwood St; Roseclair St; Kenwood St; Greenbrier St; Norton St; Houghton St; Lyndhurst St; Beach Point Pl; Barry St; Edison Green; Lindsey St; Clayton St; Westmoreland St; Edwin St; Claybourne St; Van Winkle St; Mayfield St; Lithgow St; Sumner St; Monadnock St; East St; Richview St; Dracut St; Mercier Ave; Humphreys St; Romsey St; School St; Virginia St; Harbor View St; Sudan St; Topliff St; Bushnell St; Everdean St; Sagamore St; Alban St; Crescent Ave; Wellesley Park; Butler St; Ridgewood St; Crockett Ave; Torrey St; Rockne Ave; Myrtlebank Ave; Shepton St; Ocean St; Holiday St; Larchmont St; Lenoxdale Ave; Bay St; Nahant Ave; Quincy Shore Dr; St Brendan Rd; Hoyt St; Longfellow St; N120; Coleman St; Athelwold St; Belden St; Mapes St; Bullard St; Medway St; Downer Ave; Saxton St; Corona St; Greenwich St; Roslin St; Radcliffe St; Cedar St; N433; Enterprise St; St Margaret St; Huron Cir; Harvest St; Colonial Ave; Galty Ave; Aspinwall Rd; Algonquin St; Boutwell St; St Gregory St; Percival St; Coffey St; Leonard St; Tuttle St; Hecla St; Island View Pl; Alpha Rd; Chelmsford St; W Tremlett St; Clapp St; Dudley St; Beach St; Taylor St; S Munroe Ter; Norwood St; Vassar St; Lyon St; Robinson St; Stanley St; Oakley St; Mayhew St; Elder St; Dickens St; N Munroe Ter; Valley Rd; Sturtevant St; Mount Bowdoin Ter; Pearl St; Dorset St; Thornley St; Rosemont St; Bearse Ave; Trull St; Arcadia St; Christopher St; Victoria St; Dunlap St; Orchardfield St; Franconia St; Port Norfolk St; Mellen St; Locust St; Tolman St; Lawley St; Rosedale St; Von Hillern St; Rugdale Rd; Allston St; Nevada St; Bakersfield St; Winter St; Fox St; Peninsula Pl; Belfort St; Manor St; Driscoll Dr; Bradlee St; Mallet St; Alicia Rd; Bradston St; Speedwell St; Leroy St; Semont Rd; Redfield St; Fendale Ave; Moseley St; Willis St; Stonehurst St; New England Ave; Bellflower St; Topeka St; McKone St; Norfolk Ave; Garner Rd; Wendover St; S Point Dr; Levant St; Water St; Codman Hill Ave; Worrell St; Samoset St; Vinson St; Thane St; Jerome St; Melbourne St; Wainwright St; Theodore Glynn Way; Mallon Rd; Taft St; Westwood St; Oconnell Rd; Delmont St; Burgoyne St; Windermere Rd; Glide St; Kimball St; Hillsdale St; Franklin St; Wentworth St; Elm St; Harbor Crest Ct; Washburn St; Mount Everett St; Peacevale Rd; Fenton St; Granville St; Salcombe St; Josephine St; Doris St; Whitman St; Cedar Grove St; Payson Ave; Popes Hill St; Everton St; Howell St; Howes St; Elmont St; Leedsville St; Rill St; Glenrose Rd; Range Rd; Fairmount St; Deer St; Upland Ave; Howe St; Bernice St; Puritan Ave; Regina Rd; Bourneside St; Beale St; Blanche St; Upham Ave; Milwood St; Fairfax St; Everett St; Paisley Park; Ripley Rd; Walton St; Dunbar Ave; Owencroft Rd; Avondale St; Rita Rd; Eastman St; Kenberma Rd; Helena Rd; Shafter St; Saranac St; Spring Garden St; Harvard Ave; Henderson Rd; Denny St; Plain St; Becket St; Auriga St; Brookvale St; Nottingham St; Branchfield St; Mallard Ave; Elton St; Charlemont St; Carmen St; Roseland St; Radford Ln; Nixon St; Faulkner St; Granger St; Centervale Park; Thelma Rd; Harley St; Daly St; Centre Ave; Ely Rd; Waterlow St; Hendry St; Eldon St; Hutchinson St; Green Hill St; Magdala St; Ventura St; Wilrose St; Withington St; Huntoon St; Bodwell St; Duncan St; Newport St; Blakeville St; Croftland Ave; Ditson St; Cameron St; W Howell St; Oakwood St; Grayson St; Annabel St; Alpine Way; Fernald Ter; Chipman St; Rowell St; Beechwood St; Salina Rd; Greenmount St; Sylvester Rd; Gaylord St; Elmdale St; Argyle St; Rangeley St; Carson St; Lombard St; Wenlock Rd; Roach St; Dewar St; Newhall St; Patterson St; Euclid St; Fifield St; Verdun St; Peverell St; Pond St; Bruce St; Southview St; Bowman St; Baker Ave; Wentworth Ter; Endicott Ter; Atkinson St; Everett Ave; Belton St; Ellsworth St; Grant St; Clover St; Arbroth St; High St; Whitridge St; Rowena St; Hinckley St; Morrill St; Hamlet St; Trescott St; Sayward St; Barna Rd; Caspian Way; Lincoln St; Elmhurst St; Holden St; Willow Ct; Frederika St; Spaulding St; Shenandoah St; Rosselerin Rd; Regan Rd; Rev Robert M Costello Pl; Ericsson St; Ferndale St; Agawam St; Minot Park; Maryland St; Juliette St; Chamberlain St; Arcadia Park; Claymont Ter; Wilmington Ave; Stock St; Flavia St; Mother Julian Rd; Arion St; Woodworth St; Darlington St; Rosaria St; Glen St; Ogden St; River St; Lorenzo St; Drayton Ave; Potosi St; Davern Ave; Weyanoke St; Merlin St; Southwick St; Oyster Bay Rd; Marsh St; Edna Rd; Fellsway St; Sedalia Rd; Ware St; Cheverus Rd; Bispham St; Ramsey St; Ronan St; Seaborn St; St William St; Dawes St; Freeport Way; Mount Bowdoin Green; Wessex St; Castlerock St; Hallam St; Moore St; Rozella St; Rockmere St; Blackwell St; Inwood St; Laban Pratt Rd; Midland St; Barrington Rd; Bloomington St; Raven St; Hartland St; Frost Ave; Wilcox Rd; Bateswell Rd; Fossdale Rd; Gene St; Rock Ter; Annapolis St; Springdale St; Downer Ct; Marlin Way; Mount Cushing Ter; Clementine Park; Marie St; Groom St; Freeman St; Hubbardston Rd; Ellet St; Nonquit St; Leslie St; Woodfield St; Dewolf St; Santuit St; Humes Rd; Lafield St; Sharp St; Silloway St; Banton St; Montello St; Oakman St; Epping St; Tilesboro St; Milwood Ter; Queen St; Kenmere Rd; Howard Johnson Plz; Moody St; Evandale Ter; Herbert St; Hurlcroft Ave; Bentham Rd; S Sydney St; Mather Ct; Cawfield St; Wilbur St; Branton St; Ross Rd; Playstead Rd; Montague St; Whitby Ter; Newkirk St; Marlowe St; Remington St; Fox Point Rd; Treadway Rd; Parish St; Rawson St; Manley St; Hopestill St; Humphreys Pl; Clermont St; Hooper St; Beaufield St; Crown Path; Atherstone St; Grace St; Quincefield St; Frazer St; Cedar Pl; Kane St; Grafton St; Boyd St; Chase St; Althea St; Iowa St; Clematis St; Penhallow St; Hillsboro St; Jo Anne Ter; Walnut Ct; Sunset Ln; Navillus Ter; Cottrell St; N119; Morrissey Blvd (Quincy Shore Dr, William T Morrissey Blvd); Souther Rd; Dunns Ter; Redwood St; Cummings St; Orne St; Joseph St; Conrad St; Dawson St; Templeton Way; Saco St; Grant Pl; W Bellflower St; Wheelock Ave; Rundel Park; O Donnell Sq; Whittemore Ter; Bayside St; Baker Ct; Melvinside Ter; Lasalle Park; Hesston Ter; Dahlgreen St (Louis D Brown Way); Narragansett St; Tilman St; Rowley St; Dunn St; Trent St; Buttonwood Ct; Bowdoin Park; Holbrook Ave; Howe Ter; Columbia Ter; Pt Rd; Old Colony Ter; Claridge Ter; Greenhalge St; Packard Ave; Sumner Park; Graham Ct; Stone Ter; Carmela Ln; Harrow St; Matigon Rd; Davitt St; Corwin St; Stoughton Ter; Toledo Ter; Elm Lawn St; Tanglewood Rd; Elwyn Rd; Tebroc St; Wilkinson Park; Fields Ct; Dayton St; Ashmont Park; Presley Rd; Tovar St; Estes Ave; Wichita Ter; Sumner Ter; Martin Rd; Argyle Ter; Dever St; Kevin Rd; Alvan Ter; Wedmore St; Denvir St; Ainsley St; Payne St; Ann St; Eunice St; Louis Ter; O Donnell Ter; Carlotta St; Waldorf St; Allstate Rd; Richfield Park; Richard Ter; Savin Hill Ct; Service Pl; Hallet Davis St; Sumner Sq; Arvale Rd; Davidson Ave; Romsey Cir; Mac Neil Way; Adanac Ter; St Clare Rd; Berkshire St; Franklin Ct; Sea View Ter; Harrison Park; Westville Ter; Columbia Pl; Lynnville Ter; Thatcher Ter; Coolidge Rd; Irena Rd; Ashmont Ct; Parkman Pl; Centre Ct; Orchardale St; Pilgrim Pl; Duncan Pl; Glover Pl; Barry Park; Morton St; Ginita St; Duncan Ter; Wave Ave; Dudley Ter; Savin Hill Ln; Melville Ln; Rockmount St; Sexton Ct; Adams Ter; Rice St; Gordon Pl; Arcadia Ter; Cassnet St; Stoughton Street Pl; N380; Harvard Park; Harvest Ter; Dawes Ter; Centre Pl; Fredonia St; Wilcutt Rd; Salisbury Park; Clayton Pl; Huron Pass; Grant Rd; Wm E Doucette Sq; Champlain Cir; Power St; Greenwood Park; Adirondack Pl; Berry St; Quincefield Pl; Harbell Ter; Delano St; Leonard Ct; St Jude Ter; Romsey Ter; Philip St; Elba Ter; Philips Pl; Griffin Ct; Swan Ct; Savin Hill Ter; Fruean Pl; Beckwith St; Uphams Ct; Belden Sq; Napier Park; Newhall Pl; Druce Ct.
Railroad features: Penn Central RR; Mbta Commuter Rail.
Mass transit rail lines: Ashmont-Mattapan Trolley (Mbta Red Line RR).
Other features: Neponset Riv.
Dorchester neighborhood detailed profile
Area: 6.101 square miles
Population: 107,137
Population density:
| Dorchester: | 17,561 people per square mile |
| Boston: | 13,511 people per square mile |
Median household income in 2021:
| Dorchester: | $77,304 |
| Boston: | $79,283 |
Median rent in in 2021:
| Dorchester: | $1,444 |
| Boston: | $1,696 |
Male vs Females
| Males: | 51,349 |
| Females: | 55,787 |
Median age
| Males: | 35.0 years |
| Females: | 38.0 years |
Housing prices:
Average estimated value of detached houses in 2021 (15.1% of all units):
| Dorchester: | $621,849 |
| Boston: | $683,896 |
Average estimated value of townhouses or other attached units in 2021 (6.5% of all units):
| This neighborhood: | $307,267 |
| city: | $1,097,292 |
Average estimated value of housing units in 2-unit structures in 2021 (21.1% of all units):
| This neighborhood: | $508,411 |
| Boston: | $639,493 |
Average estimated '21 value of housing units in 3-to-4-unit structures (43.8% of all units):
| Dorchester: | $551,323 |
| city: | $745,440 |
Average estimated '21 value of housing units in 5-or-more-unit structures (13.9% of all units):
| Dorchester: | $349,003 |
| Boston: | $986,433 |
Most popular occupations of males: service occupations (23.5%); sales and office occupations (16.1%); management occupations (except farmers) (8.3%); transportation occupations (8.1%); construction, extraction, and maintenance occupations (7.6%); business and financial operations occupations (5.3%); computer and mathematical occupations (5.3%)
Most popular occupations of females: service occupations (26.7%); sales and office occupations (23.8%); management occupations (except farmers) (9.4%); healthcare practitioners and technical occupations (8.5%); education, training, and library occupations (8.0%); business and financial operations occupations (6.2%); community and social services occupations (4.0%)
Mass transit rail lines: .
Other features: Neponset Riv.
Limited-access highways (interstate or state) in this neighborhood: US Hwy 1 (State Hwy 3, I- 93, John F Fitzgerald Expy, General Pulaski Skwy).
Highways in this neighborhood: Gallivan Blvd (State Hwy 203).
Roads and streets: William T Morrissey Blvd; Dorchester Ave; Adams St; Washington St; Park St; Mount Vernon St; Ashmont St; Savin Hill Ave; Neponset Ave; Columbia Rd; Freeport St; Bowdoin St; Minot St; Centre St; Talbot Ave; Geneva Ave; Massachusetts Ave; Victory Rd; Milton St; E Cottage St; Hancock St; Norwell St; Newmarket Sq; Melville Ave; King St; Westville St; Sydney St; Pleasant St; Hamilton St; Grampian Way; Richmond St; Welles Ave; Wrentham St; Auckland St; Walnut St; Boston St; Homes Ave; Cushing Ave; Southampton St; Msgr Patrick J Lydon Way; Olney St; Train St; Quincy St; Harbor Point Blvd; Millet St; Hallet St; Elmer Rd; Bailey St; Dakota St; Conley St; Rosseter St; Bellevue St; Sawyer Ave; Tenean St; Southern Ave; Fuller St; Tonawanda St; Hill Top St; Parkman St; N Point Dr; Norfolk St; Draper St; Beaumont St; Whitfield St; Spencer St; Pierce Ave; Wheatland Ave; Bowdoin Ave; Lonsdale St; Gibson St; Chickatawbut St; Westglow St; Harvard St; Mount Ida Rd; Bloomfield St; St Marks Rd; Mather St; Stoughton St; Clarkson St; Brent St; Ocean View Dr; Richfield St; Whitten St; Waldeck St; Oakton Ave; Florida St; S Bay Ave; Granite Ave; Dix St; Church St; Bird St; Ashland St; Charles St; Carruth St; Glendale St; Burt St; Tremlett St; Moultrie St; Mill St; Westwind Rd; Linden St; Buttonwood St; Roseclair St; Kenwood St; Greenbrier St; Norton St; Houghton St; Lyndhurst St; Beach Point Pl; Barry St; Edison Green; Lindsey St; Clayton St; Westmoreland St; Edwin St; Claybourne St; Van Winkle St; Mayfield St; Lithgow St; Sumner St; Monadnock St; East St; Richview St; Dracut St; Mercier Ave; Humphreys St; Romsey St; School St; Virginia St; Harbor View St; Sudan St; Topliff St; Bushnell St; Everdean St; Sagamore St; Alban St; Crescent Ave; Wellesley Park; Butler St; Ridgewood St; Crockett Ave; Torrey St; Rockne Ave; Myrtlebank Ave; Shepton St; Ocean St; Holiday St; Larchmont St; Lenoxdale Ave; Bay St; Nahant Ave; Quincy Shore Dr; St Brendan Rd; Hoyt St; Longfellow St; N120; Coleman St; Athelwold St; Belden St; Mapes St; Bullard St; Medway St; Downer Ave; Saxton St; Corona St; Greenwich St; Roslin St; Radcliffe St; Cedar St; N433; Enterprise St; St Margaret St; Huron Cir; Harvest St; Colonial Ave; Galty Ave; Aspinwall Rd; Algonquin St; Boutwell St; St Gregory St; Percival St; Coffey St; Leonard St; Tuttle St; Hecla St; Island View Pl; Alpha Rd; Chelmsford St; W Tremlett St; Clapp St; Dudley St; Beach St; Taylor St; S Munroe Ter; Norwood St; Vassar St; Lyon St; Robinson St; Stanley St; Oakley St; Mayhew St; Elder St; Dickens St; N Munroe Ter; Valley Rd; Sturtevant St; Mount Bowdoin Ter; Pearl St; Dorset St; Thornley St; Rosemont St; Bearse Ave; Trull St; Arcadia St; Christopher St; Victoria St; Dunlap St; Orchardfield St; Franconia St; Port Norfolk St; Mellen St; Locust St; Tolman St; Lawley St; Rosedale St; Von Hillern St; Rugdale Rd; Allston St; Nevada St; Bakersfield St; Winter St; Fox St; Peninsula Pl; Belfort St; Manor St; Driscoll Dr; Bradlee St; Mallet St; Alicia Rd; Bradston St; Speedwell St; Leroy St; Semont Rd; Redfield St; Fendale Ave; Moseley St; Willis St; Stonehurst St; New England Ave; Bellflower St; Topeka St; McKone St; Norfolk Ave; Garner Rd; Wendover St; S Point Dr; Levant St; Water St; Codman Hill Ave; Worrell St; Samoset St; Vinson St; Thane St; Jerome St; Melbourne St; Wainwright St; Theodore Glynn Way; Mallon Rd; Taft St; Westwood St; Oconnell Rd; Delmont St; Burgoyne St; Windermere Rd; Glide St; Kimball St; Hillsdale St; Franklin St; Wentworth St; Elm St; Harbor Crest Ct; Washburn St; Mount Everett St; Peacevale Rd; Fenton St; Granville St; Salcombe St; Josephine St; Doris St; Whitman St; Cedar Grove St; Payson Ave; Popes Hill St; Everton St; Howell St; Howes St; Elmont St; Leedsville St; Rill St; Glenrose Rd; Range Rd; Fairmount St; Deer St; Upland Ave; Howe St; Bernice St; Puritan Ave; Regina Rd; Bourneside St; Beale St; Blanche St; Upham Ave; Milwood St; Fairfax St; Everett St; Paisley Park; Ripley Rd; Walton St; Dunbar Ave; Owencroft Rd; Avondale St; Rita Rd; Eastman St; Kenberma Rd; Helena Rd; Shafter St; Saranac St; Spring Garden St; Harvard Ave; Henderson Rd; Denny St; Plain St; Becket St; Auriga St; Brookvale St; Nottingham St; Branchfield St; Mallard Ave; Elton St; Charlemont St; Carmen St; Roseland St; Radford Ln; Nixon St; Faulkner St; Granger St; Centervale Park; Thelma Rd; Harley St; Daly St; Centre Ave; Ely Rd; Waterlow St; Hendry St; Eldon St; Hutchinson St; Green Hill St; Magdala St; Ventura St; Wilrose St; Withington St; Huntoon St; Bodwell St; Duncan St; Newport St; Blakeville St; Croftland Ave; Ditson St; Cameron St; W Howell St; Oakwood St; Grayson St; Annabel St; Alpine Way; Fernald Ter; Chipman St; Rowell St; Beechwood St; Salina Rd; Greenmount St; Sylvester Rd; Gaylord St; Elmdale St; Argyle St; Rangeley St; Carson St; Lombard St; Wenlock Rd; Roach St; Dewar St; Newhall St; Patterson St; Euclid St; Fifield St; Verdun St; Peverell St; Pond St; Bruce St; Southview St; Bowman St; Baker Ave; Wentworth Ter; Endicott Ter; Atkinson St; Everett Ave; Belton St; Ellsworth St; Grant St; Clover St; Arbroth St; High St; Whitridge St; Rowena St; Hinckley St; Morrill St; Hamlet St; Trescott St; Sayward St; Barna Rd; Caspian Way; Lincoln St; Elmhurst St; Holden St; Willow Ct; Frederika St; Spaulding St; Shenandoah St; Rosselerin Rd; Regan Rd; Rev Robert M Costello Pl; Ericsson St; Ferndale St; Agawam St; Minot Park; Maryland St; Juliette St; Chamberlain St; Arcadia Park; Claymont Ter; Wilmington Ave; Stock St; Flavia St; Mother Julian Rd; Arion St; Woodworth St; Darlington St; Rosaria St; Glen St; Ogden St; River St; Lorenzo St; Drayton Ave; Potosi St; Davern Ave; Weyanoke St; Merlin St; Southwick St; Oyster Bay Rd; Marsh St; Edna Rd; Fellsway St; Sedalia Rd; Ware St; Cheverus Rd; Bispham St; Ramsey St; Ronan St; Seaborn St; St William St; Dawes St; Freeport Way; Mount Bowdoin Green; Wessex St; Castlerock St; Hallam St; Moore St; Rozella St; Rockmere St; Blackwell St; Inwood St; Laban Pratt Rd; Midland St; Barrington Rd; Bloomington St; Raven St; Hartland St; Frost Ave; Wilcox Rd; Bateswell Rd; Fossdale Rd; Gene St; Rock Ter; Annapolis St; Springdale St; Downer Ct; Marlin Way; Mount Cushing Ter; Clementine Park; Marie St; Groom St; Freeman St; Hubbardston Rd; Ellet St; Nonquit St; Leslie St; Woodfield St; Dewolf St; Santuit St; Humes Rd; Lafield St; Sharp St; Silloway St; Banton St; Montello St; Oakman St; Epping St; Tilesboro St; Milwood Ter; Queen St; Kenmere Rd; Howard Johnson Plz; Moody St; Evandale Ter; Herbert St; Hurlcroft Ave; Bentham Rd; S Sydney St; Mather Ct; Cawfield St; Wilbur St; Branton St; Ross Rd; Playstead Rd; Montague St; Whitby Ter; Newkirk St; Marlowe St; Remington St; Fox Point Rd; Treadway Rd; Parish St; Rawson St; Manley St; Hopestill St; Humphreys Pl; Clermont St; Hooper St; Beaufield St; Crown Path; Atherstone St; Grace St; Quincefield St; Frazer St; Cedar Pl; Kane St; Grafton St; Boyd St; Chase St; Althea St; Iowa St; Clematis St; Penhallow St; Hillsboro St; Jo Anne Ter; Walnut Ct; Sunset Ln; Navillus Ter; Cottrell St; N119; Morrissey Blvd (Quincy Shore Dr, William T Morrissey Blvd); Souther Rd; Dunns Ter; Redwood St; Cummings St; Orne St; Joseph St; Conrad St; Dawson St; Templeton Way; Saco St; Grant Pl; W Bellflower St; Wheelock Ave; Rundel Park; O Donnell Sq; Whittemore Ter; Bayside St; Baker Ct; Melvinside Ter; Lasalle Park; Hesston Ter; Dahlgreen St (Louis D Brown Way); Narragansett St; Tilman St; Rowley St; Dunn St; Trent St; Buttonwood Ct; Bowdoin Park; Holbrook Ave; Howe Ter; Columbia Ter; Pt Rd; Old Colony Ter; Claridge Ter; Greenhalge St; Packard Ave; Sumner Park; Graham Ct; Stone Ter; Carmela Ln; Harrow St; Matigon Rd; Davitt St; Corwin St; Stoughton Ter; Toledo Ter; Elm Lawn St; Tanglewood Rd; Elwyn Rd; Tebroc St; Wilkinson Park; Fields Ct; Dayton St; Ashmont Park; Presley Rd; Tovar St; Estes Ave; Wichita Ter; Sumner Ter; Martin Rd; Argyle Ter; Dever St; Kevin Rd; Alvan Ter; Wedmore St; Denvir St; Ainsley St; Payne St; Ann St; Eunice St; Louis Ter; O Donnell Ter; Carlotta St; Waldorf St; Allstate Rd; Richfield Park; Richard Ter; Savin Hill Ct; Service Pl; Hallet Davis St; Sumner Sq; Arvale Rd; Davidson Ave; Romsey Cir; Mac Neil Way; Adanac Ter; St Clare Rd; Berkshire St; Franklin Ct; Sea View Ter; Harrison Park; Westville Ter; Columbia Pl; Lynnville Ter; Thatcher Ter; Coolidge Rd; Irena Rd; Ashmont Ct; Parkman Pl; Centre Ct; Orchardale St; Pilgrim Pl; Duncan Pl; Glover Pl; Barry Park; Morton St; Ginita St; Duncan Ter; Wave Ave; Dudley Ter; Savin Hill Ln; Melville Ln; Rockmount St; Sexton Ct; Adams Ter; Rice St; Gordon Pl; Arcadia Ter; Cassnet St; Stoughton Street Pl; N380; Harvard Park; Harvest Ter; Dawes Ter; Centre Pl; Fredonia St; Wilcutt Rd; Salisbury Park; Clayton Pl; Huron Pass; Grant Rd; Wm E Doucette Sq; Champlain Cir; Power St; Greenwood Park; Adirondack Pl; Berry St; Quincefield Pl; Harbell Ter; Delano St; Leonard Ct; St Jude Ter; Romsey Ter; Philip St; Elba Ter; Philips Pl; Griffin Ct; Swan Ct; Savin Hill Ter; Fruean Pl; Beckwith St; Uphams Ct; Belden Sq; Napier Park; Newhall Pl; Druce Ct.
Railroad features: Penn Central RR; Mbta Commuter Rail.
Mass transit rail lines: Ashmont-Mattapan Trolley (Mbta Red Line RR).
Other features: Neponset Riv.
Dorchester neighborhood detailed profile
Downtown neighborhood in Boston statistics: (Find on map)
Area: 0.828 square miles
Population: 36,649
Population density:
Median household income in 2021:
Median rent in in 2021:
Male vs Females
Median age
Housing prices:
Average estimated value of townhouses or other attached units in 2021 (18.9% of all units):
Average estimated '21 value of housing units in 3-to-4-unit structures (23.6% of all units):
Average estimated '21 value of housing units in 5-or-more-unit structures (17.8% of all units):
Most popular occupations of males: business and financial operations occupations (23.0%); management occupations (except farmers) (17.1%); sales and office occupations (10.1%); legal occupations (8.8%); computer and mathematical occupations (8.2%); service occupations (7.5%); healthcare practitioners and technical occupations (7.4%)
Most popular occupations of females: business and financial operations occupations (24.3%); sales and office occupations (15.2%); management occupations (except farmers) (14.7%); education, training, and library occupations (7.0%); healthcare practitioners and technical occupations (6.9%); computer and mathematical occupations (6.5%); life, physical, and social science occupations (5.4%)
Limited-access highways (interstate or state) in this neighborhood: US Hwy 1 (I- 93, John F Fitzgerald Expy, State Hwy 3, General Pulaski Skwy); I- 90 (Massachusetts Tpke).
Highways in this neighborhood: State Hwy 3; Charles St (State Hwy 3); Msgr O'Brien Hwy (State Hwy 28); Embankment Rd (State Hwy 28); State Hwy 28 (Charlesbank Rd); State Hwy 28 (State Hwy 3, Leverett Cir); Longfellow Brg (State Hwy 3); State Hwy 28.
Roads and streets: Congress St; Cambridge St; Washington St; Franklin St; Summer St; Atlantic Ave; High St; Dorchester Ave; Milk St; Essex St; Purchase St; New Chardon St; Blossom St; Devonshire St; Nashua St; Causeway St; Water St; State St; Bedford St; Federal St; Kneeland St; William Cardinal O'Connell Way; Broad St; South St; Beach St; Oliver St; Chatham St; Pearl St; Martha Rd; Canal St; Friend St; New Sudbury St; Pleasure Rd; N Washington St; Ave de Lafayette; Lincoln St; Merrimac St; Chauncy St; Batterymarch St; Staniford St; Arch St; Harrison Ave; Blackstone St; Portland St; Merchants Row; Kilby St; North St; India St; Milton Pl; School St; Court Sq; Court St; Hawley St; Mason St; Lomasney Way; Kingston St; N144; Utica St; Fruit St; Hawkins St; Central St; Cambridge Street Ave; Parkman St; Bulfinch Pl; N384; East St; Estes Pl; Traverse St; Boates Ct; Stuart St; Avon St; Clinton St; Snow Pl; Tremont St; N417; Matthews St; Mason St Pl; Boylston St; Lancaster St; Tufts St; Lagrange St; Union St; Bowker St; Fort Hill Wharf; Gilbert Pl; Knapp St; New Congress St; Medford St; Province St; N North Grove St; Lovejoy Pl; Avery St; Pemberton Sq; Beverly St; Beacon St; Winter St; Boylston Sq; Hayward Pl; Otis St; Quaker Ln; Haymarket Sq; Hanover St; Commercial St; Science Park; Creek Sq; Bromfield St; Well St; Chapman Pl; Harrison Ave Exd; Federal Ct; West St; Exchange St; Spring Ln; N Anderson St; Waverly Pl; Somerset St; Blossom Ct; Jenton Way; Post Office Sq; Temple Pl; Wendell St; Gridley St; Wharf St; Emerson Pl; Hathaway St; Brattle Way; Hawthorne Pl; Columbia St; Avery Pl; Aldine St; Cross St; High Street Pl; Exeter Pl; New Broadway Brg; Whittier Pl; Fayette Ct; Custom House St; Chapel Pl; Marshall St; Butler Row; Haymarket Pl; Red Auerbach Way (Cotting St); Hawley Pl; Utica Pl; Batterymarch Arm; Northern Ave; Winthrop Sq; Kilby Pl; Market St; East Pl; Scott Aly; Wesleyan Pl; Accolyn Way; City Hall Ave; McKinley Sq; Marsh Ln; Jackson Pl; Amy Ct; Province Ct; Sullivan Pl; Bumstead Ct; Albany St; Ordway Pl; Head Pl; Harem Pl; Winter Pl; Chickerling Pl; Lynde St; Chatham Row; Harvard Pl; Hersey Pl; Adams Pl; Longfellow Pl; Pie Aly; Sudbury St; Music Hall Pl; Bridge Ct; Butler Sq; Cornhill St; Boston Pl; Herald St; Bates Pl; N382; Lane Pl; N113; Leman Pl.
Railroad features: Penn Central RR; Mbta Commuter Rail (Amtrak RR); Boston and Maine RR.
Mass transit rail lines: Lechmere Viaduct (Mbta Green Line Trolley).
Downtown neighborhood detailed profile
Area: 0.828 square miles
Population: 36,649
Population density:
| Downtown (West End): | 44,264 people per square mile |
| Boston: | 13,511 people per square mile |
Median household income in 2021:
| Downtown (West End): | $96,998 |
| Boston: | $79,283 |
Median rent in in 2021:
| Downtown (West End): | $1,938 |
| Boston: | $1,696 |
Male vs Females
| Males: | 16,477 |
| Females: | 20,172 |
Median age
| Males: | 30.3 years |
| Females: | 29.4 years |
Housing prices:
Average estimated value of townhouses or other attached units in 2021 (18.9% of all units):
| This neighborhood: | $1,973,881 |
| city: | $1,097,292 |
Average estimated '21 value of housing units in 3-to-4-unit structures (23.6% of all units):
| Downtown (West End): | $740,909 |
| city: | $745,440 |
Average estimated '21 value of housing units in 5-or-more-unit structures (17.8% of all units):
| Downtown (West End): | $980,745 |
| Boston: | $986,433 |
Most popular occupations of males: business and financial operations occupations (23.0%); management occupations (except farmers) (17.1%); sales and office occupations (10.1%); legal occupations (8.8%); computer and mathematical occupations (8.2%); service occupations (7.5%); healthcare practitioners and technical occupations (7.4%)
Most popular occupations of females: business and financial operations occupations (24.3%); sales and office occupations (15.2%); management occupations (except farmers) (14.7%); education, training, and library occupations (7.0%); healthcare practitioners and technical occupations (6.9%); computer and mathematical occupations (6.5%); life, physical, and social science occupations (5.4%)
Limited-access highways (interstate or state) in this neighborhood: US Hwy 1 (I- 93, John F Fitzgerald Expy, State Hwy 3, General Pulaski Skwy); I- 90 (Massachusetts Tpke).
Highways in this neighborhood: State Hwy 3; Charles St (State Hwy 3); Msgr O'Brien Hwy (State Hwy 28); Embankment Rd (State Hwy 28); State Hwy 28 (Charlesbank Rd); State Hwy 28 (State Hwy 3, Leverett Cir); Longfellow Brg (State Hwy 3); State Hwy 28.
Roads and streets: Congress St; Cambridge St; Washington St; Franklin St; Summer St; Atlantic Ave; High St; Dorchester Ave; Milk St; Essex St; Purchase St; New Chardon St; Blossom St; Devonshire St; Nashua St; Causeway St; Water St; State St; Bedford St; Federal St; Kneeland St; William Cardinal O'Connell Way; Broad St; South St; Beach St; Oliver St; Chatham St; Pearl St; Martha Rd; Canal St; Friend St; New Sudbury St; Pleasure Rd; N Washington St; Ave de Lafayette; Lincoln St; Merrimac St; Chauncy St; Batterymarch St; Staniford St; Arch St; Harrison Ave; Blackstone St; Portland St; Merchants Row; Kilby St; North St; India St; Milton Pl; School St; Court Sq; Court St; Hawley St; Mason St; Lomasney Way; Kingston St; N144; Utica St; Fruit St; Hawkins St; Central St; Cambridge Street Ave; Parkman St; Bulfinch Pl; N384; East St; Estes Pl; Traverse St; Boates Ct; Stuart St; Avon St; Clinton St; Snow Pl; Tremont St; N417; Matthews St; Mason St Pl; Boylston St; Lancaster St; Tufts St; Lagrange St; Union St; Bowker St; Fort Hill Wharf; Gilbert Pl; Knapp St; New Congress St; Medford St; Province St; N North Grove St; Lovejoy Pl; Avery St; Pemberton Sq; Beverly St; Beacon St; Winter St; Boylston Sq; Hayward Pl; Otis St; Quaker Ln; Haymarket Sq; Hanover St; Commercial St; Science Park; Creek Sq; Bromfield St; Well St; Chapman Pl; Harrison Ave Exd; Federal Ct; West St; Exchange St; Spring Ln; N Anderson St; Waverly Pl; Somerset St; Blossom Ct; Jenton Way; Post Office Sq; Temple Pl; Wendell St; Gridley St; Wharf St; Emerson Pl; Hathaway St; Brattle Way; Hawthorne Pl; Columbia St; Avery Pl; Aldine St; Cross St; High Street Pl; Exeter Pl; New Broadway Brg; Whittier Pl; Fayette Ct; Custom House St; Chapel Pl; Marshall St; Butler Row; Haymarket Pl; Red Auerbach Way (Cotting St); Hawley Pl; Utica Pl; Batterymarch Arm; Northern Ave; Winthrop Sq; Kilby Pl; Market St; East Pl; Scott Aly; Wesleyan Pl; Accolyn Way; City Hall Ave; McKinley Sq; Marsh Ln; Jackson Pl; Amy Ct; Province Ct; Sullivan Pl; Bumstead Ct; Albany St; Ordway Pl; Head Pl; Harem Pl; Winter Pl; Chickerling Pl; Lynde St; Chatham Row; Harvard Pl; Hersey Pl; Adams Pl; Longfellow Pl; Pie Aly; Sudbury St; Music Hall Pl; Bridge Ct; Butler Sq; Cornhill St; Boston Pl; Herald St; Bates Pl; N382; Lane Pl; N113; Leman Pl.
Railroad features: Penn Central RR; Mbta Commuter Rail (Amtrak RR); Boston and Maine RR.
Mass transit rail lines: Lechmere Viaduct (Mbta Green Line Trolley).
Downtown neighborhood detailed profile
Downtown Crossing neighborhood in Boston statistics: (Find on map)
Area: 0.090 square miles
Roads and streets: Washington St; Bedford St; Devonshire St; Summer St; Ave de Lafayette; Arch St; Franklin St; Chauncy St; Hawley St; Mason St; Bromfield St; Kingston St; Avon St; Milk St; Snow Pl; Mason St Pl; Avery St; Winter St; Hayward Pl; Bosworth St; Otis St; West St; Spring Ln; Temple Pl; Province St; Harrison Ave; Avery Pl; Exeter Pl; Hawley Pl; Winthrop Sq; Wesleyan Pl; Jackson Pl; Province Ct; Ordway Pl; Harem Pl; Winter Pl; Chickerling Pl; Harvard Pl; Harrison Ave Exd; Music Hall Pl; Sewall Pl.
Downtown Crossing neighborhood detailed profile
Dudley Square neighborhood in Boston statistics: (Find on map)
Area: 0.305 square miles
Population: 7,209
Population density:
Median household income in 2021:
Median rent in in 2021:
Male vs Females
Median age
Housing prices:
Average estimated value of detached houses in 2021 (7.4% of all units):
Average estimated value of townhouses or other attached units in 2021 (8.3% of all units):
Average estimated value of housing units in 2-unit structures in 2021 (9.6% of all units):
Average estimated '21 value of housing units in 3-to-4-unit structures (32.0% of all units):
Most popular occupations of males: service occupations (26.7%); sales and office occupations (20.0%); transportation occupations (19.1%); legal occupations (4.1%); production occupations (4.1%); community and social services occupations (3.8%); healthcare practitioners and technical occupations (3.4%)
Most popular occupations of females: service occupations (41.9%); sales and office occupations (19.5%); management occupations (except farmers) (12.0%); community and social services occupations (6.8%); healthcare practitioners and technical occupations (5.9%); transportation occupations (4.8%); education, training, and library occupations (3.0%)
Roads and streets: Melnea Cass Blvd; Dudley St; Eustis St; Washington St; Warren St; Mount Pleasant Ave; Harrison Ave; Ziegler St; Winthrop St; Hampden St; Forest St; Shawmut Ave; Adams St; Moreland St; St James St; Yeoman St; Albany St; Greenville St; Mall St; Kearsarge Ave; Vine St; Dade St; Degautier Way; Williams St; Ambrose St; Dearborn St; Ruggles St; Shabazz Way; Warren Pl; Crosby Sq; Bethune Way; Prescott St; Palmer St; Chadwick St; Fairland St; Webber St; Whiting St; Cleveland St; Vernon St; Bard Ave; Marvin St; Taber St; Roxbury St; Renfrew St; N447; Pevear Pl; Wheatley Way; Renfrew Ct; St James Ter; Woodrow Wilson Ct; Hunneman St; Winslow St; Mount Pleasant Ter; Ruggles Ct; Oakville Ave; Orchard Park St; Vine Ave; Nathan St; Newman Pl; Kearsarge Ter; Gary St; Mount Pleasant Pl; Cleveland Park; Forest Pl; E Campbell Pl; Mulberry Pl; Guild Row; Greenville Park; Regent St; Madison Park Ct.
Dudley Square neighborhood detailed profile
Area: 0.305 square miles
Population: 7,209
Population density:
| Dudley Square: | 23,625 people per square mile |
| Boston: | 13,511 people per square mile |
Median household income in 2021:
| Dudley Square: | $41,066 |
| Boston: | $79,283 |
Median rent in in 2021:
| Dudley Square: | $1,123 |
| Boston: | $1,696 |
Male vs Females
| Males: | 2,865 |
| Females: | 4,344 |
Median age
| Males: | 29.7 years |
| Females: | 35.2 years |
Housing prices:
Average estimated value of detached houses in 2021 (7.4% of all units):
| Dudley Square: | $1,832,551 |
| Boston: | $683,896 |
Average estimated value of townhouses or other attached units in 2021 (8.3% of all units):
| This neighborhood: | $1,370,673 |
| city: | $1,097,292 |
Average estimated value of housing units in 2-unit structures in 2021 (9.6% of all units):
| This neighborhood: | $1,926,449 |
| Boston: | $639,493 |
Average estimated '21 value of housing units in 3-to-4-unit structures (32.0% of all units):
| Dudley Square: | $2,250,664 |
| city: | $745,440 |
Most popular occupations of males: service occupations (26.7%); sales and office occupations (20.0%); transportation occupations (19.1%); legal occupations (4.1%); production occupations (4.1%); community and social services occupations (3.8%); healthcare practitioners and technical occupations (3.4%)
Most popular occupations of females: service occupations (41.9%); sales and office occupations (19.5%); management occupations (except farmers) (12.0%); community and social services occupations (6.8%); healthcare practitioners and technical occupations (5.9%); transportation occupations (4.8%); education, training, and library occupations (3.0%)
Roads and streets: Melnea Cass Blvd; Dudley St; Eustis St; Washington St; Warren St; Mount Pleasant Ave; Harrison Ave; Ziegler St; Winthrop St; Hampden St; Forest St; Shawmut Ave; Adams St; Moreland St; St James St; Yeoman St; Albany St; Greenville St; Mall St; Kearsarge Ave; Vine St; Dade St; Degautier Way; Williams St; Ambrose St; Dearborn St; Ruggles St; Shabazz Way; Warren Pl; Crosby Sq; Bethune Way; Prescott St; Palmer St; Chadwick St; Fairland St; Webber St; Whiting St; Cleveland St; Vernon St; Bard Ave; Marvin St; Taber St; Roxbury St; Renfrew St; N447; Pevear Pl; Wheatley Way; Renfrew Ct; St James Ter; Woodrow Wilson Ct; Hunneman St; Winslow St; Mount Pleasant Ter; Ruggles Ct; Oakville Ave; Orchard Park St; Vine Ave; Nathan St; Newman Pl; Kearsarge Ter; Gary St; Mount Pleasant Pl; Cleveland Park; Forest Pl; E Campbell Pl; Mulberry Pl; Guild Row; Greenville Park; Regent St; Madison Park Ct.
Dudley Square neighborhood detailed profile
Eagle Hill neighborhood in Boston statistics: (Find on map)
Area: 0.363 square miles
Population: 21,092
Population density:
Median household income in 2021:
Median rent in in 2021:
Male vs Females
Median age
Housing prices:
Average estimated value of detached houses in 2021 (14.6% of all units):
Average estimated value of townhouses or other attached units in 2021 (2.3% of all units):
Average estimated value of housing units in 2-unit structures in 2021 (10.4% of all units):
Average estimated '21 value of housing units in 3-to-4-unit structures (53.7% of all units):
Average estimated '21 value of housing units in 5-or-more-unit structures (12.7% of all units):
Most popular occupations of males: service occupations (20.9%); management occupations (except farmers) (18.0%); sales and office occupations (14.7%); production occupations (11.7%); business and financial operations occupations (8.2%); transportation occupations (8.0%); construction, extraction, and maintenance occupations (5.0%)
Most popular occupations of females: service occupations (35.4%); sales and office occupations (21.8%); healthcare practitioners and technical occupations (11.9%); education, training, and library occupations (6.5%); management occupations (except farmers) (5.7%); business and financial operations occupations (3.7%); legal occupations (3.7%)
Highways in this neighborhood: State Hwy 1 Alt (William F McClellan Hwy).
Roads and streets: Saratoga St; Princeton St; Condor St; Lexington St; Falcon St; Trenton St; Meridian St; White St; E Eagle St; Chelsea St; Brooks St; Eutaw St; Marion St; Putnam St; W Eagle St; Monmouth St; Border St; Bremen St; Prescott St; Nay St; Shelby St; Glendon St; Beck St; Glendon Pl; Marion Pl; White Street Pl; Eagle Sq; Curtis St; Bennet Pl; Princeton Pl; Lawson Pl.
Railroad features: Penn Central RR.
Eagle Hill neighborhood detailed profile
Area: 0.363 square miles
Population: 21,092
Population density:
| Eagle Hill: | 58,126 people per square mile |
| Boston: | 13,511 people per square mile |
Median household income in 2021:
| Eagle Hill: | $72,530 |
| Boston: | $79,283 |
Median rent in in 2021:
| Eagle Hill: | $1,642 |
| Boston: | $1,696 |
Male vs Females
| Males: | 11,344 |
| Females: | 9,747 |
Median age
| Males: | 36.0 years |
| Females: | 36.2 years |
Housing prices:
Average estimated value of detached houses in 2021 (14.6% of all units):
| Eagle Hill: | $902,704 |
| Boston: | $683,896 |
Average estimated value of townhouses or other attached units in 2021 (2.3% of all units):
| This neighborhood: | $389,429 |
| city: | $1,097,292 |
Average estimated value of housing units in 2-unit structures in 2021 (10.4% of all units):
| This neighborhood: | $467,180 |
| Boston: | $639,493 |
Average estimated '21 value of housing units in 3-to-4-unit structures (53.7% of all units):
| Eagle Hill: | $3,152,367 |
| city: | $745,440 |
Average estimated '21 value of housing units in 5-or-more-unit structures (12.7% of all units):
| Eagle Hill: | $491,224 |
| Boston: | $986,433 |
Most popular occupations of males: service occupations (20.9%); management occupations (except farmers) (18.0%); sales and office occupations (14.7%); production occupations (11.7%); business and financial operations occupations (8.2%); transportation occupations (8.0%); construction, extraction, and maintenance occupations (5.0%)
Most popular occupations of females: service occupations (35.4%); sales and office occupations (21.8%); healthcare practitioners and technical occupations (11.9%); education, training, and library occupations (6.5%); management occupations (except farmers) (5.7%); business and financial operations occupations (3.7%); legal occupations (3.7%)
Highways in this neighborhood: State Hwy 1 Alt (William F McClellan Hwy).
Roads and streets: Saratoga St; Princeton St; Condor St; Lexington St; Falcon St; Trenton St; Meridian St; White St; E Eagle St; Chelsea St; Brooks St; Eutaw St; Marion St; Putnam St; W Eagle St; Monmouth St; Border St; Bremen St; Prescott St; Nay St; Shelby St; Glendon St; Beck St; Glendon Pl; Marion Pl; White Street Pl; Eagle Sq; Curtis St; Bennet Pl; Princeton Pl; Lawson Pl.
Railroad features: Penn Central RR.
Eagle Hill neighborhood detailed profile
East Boston neighborhood in Boston statistics: (Find on map)
Area: 4.736 square miles
Population: 123,960
Population density:
Median household income in 2021:
Median rent in in 2021:
Male vs Females
Median age
Housing prices:
Average estimated value of detached houses in 2021 (11.2% of all units):
Average estimated value of townhouses or other attached units in 2021 (5.8% of all units):
Average estimated value of housing units in 2-unit structures in 2021 (14.1% of all units):
Average estimated '21 value of housing units in 3-to-4-unit structures (66.0% of all units):
Average estimated '21 value of housing units in 5-or-more-unit structures (19.4% of all units):
Most popular occupations of males: service occupations (34.9%); sales and office occupations (11.1%); management occupations (except farmers) (10.9%); construction, extraction, and maintenance occupations (6.6%); computer and mathematical occupations (6.2%); transportation occupations (5.7%); business and financial operations occupations (5.0%)
Most popular occupations of females: service occupations (30.8%); sales and office occupations (19.3%); management occupations (except farmers) (8.3%); business and financial operations occupations (7.8%); education, training, and library occupations (7.2%); healthcare practitioners and technical occupations (6.7%); production occupations (3.6%)
Limited-access highways (interstate or state) in this neighborhood: I- 90 (Massachusetts Tpke).
Highways in this neighborhood: State Hwy 1 Alt (William F McClellan Hwy).
Roads and streets: Bennington St; Saratoga St; N351; Bremen St; Chelsea St; Waldemar Ave; Maverick St; Sumner St; Meridian St; Princeton St; Orient Ave; Marginal St; Leyden St; Condor St; Lexington St; Paris St; Prescott St; Faywood Ave; Border St; Havre St; Gladstone St; Porter St; Falcon St; Webster St; Trenton St; Marion St; Frankfort St; Brooks St; Bayswater St; Everett St; White St; E Eagle St; St Andrews Rd; Wordsworth St; Putnam St; Orleans St; Barnes Ave; Byron St; London St; Ashley St; Cottage St; Gove St; Boardman St; Horace St; Eutaw St; Moore St; Addison St; Neptune Rd; Beachview Rd; Cowper St; Brandywyne Dr; W Eagle St; Chaucer St; Breed St; Vallar Rd; Morris St; Liverpool St; Montmorenci Ave; Lamson St; Coleridge St; Monmouth St; Porter St Exd; Vienna St; Palermo St; Lovell St; Curtis St; Clyde St; Pope St; Homer St; Walley St; Westbrook St; St Edward Rd; Neptune Cir; Thurston St; Shawsheen Rd; Seaview Ave; Geneva St; Jeffries St; Haynes St; Rice St; Decatur St; Lubec St; Swan Ave; Nay St; Leverett Ave; Annavoy St; Swift St; Shelby St; Tower St; Benevento St; Teregram St; Ruth St; Crestway Rd; Maverick Sq; New St; Wood Island Mbta Station Rd; Clipper Ship Ln; N348; Whitby St; Brenen St; Ford St; Emmet Pl; Trident St; Glendon St; Pearl Pl; Day Sq Mbta Station; Emmons St; Lewis St; Brigham St; Antrim St; Porter St (Logan Airport Boundary); Trustman Ter; Nancia St; Elbow St; Lawn Ave; Drumlin Rd; Selma St; S Bremen St; Grady Ct; Seaver St; Marion Ct; Murray Ct; Blackinton St; Drake Pl; Swift Ter; Harmony St; Anthony J Grieco Ter; Aramon St; Shrimpton St; Ardee St; Henry St; Washington Ave; Lillian St; Coppersmith Way; Wordsworth Ter; Central Sq; Winthrop St; Beck St; Glendon Pl; Marion Pl; White Street Pl; Eagle Sq; Msgr Albert A Jacobbe Rd; Chelsea Ter; Davis Ct; Appian Pl; Ipswich Pl; Neptune Ct; Paris Pl; Lamson Ct; London Ct; Porter Pl; Webster Ave; Paris Ct; Everett Pl; Bremen Pl; Sharon Ct; Percival Pl; E Gould Ct; McKay Pl; Cheever Ct; Wilbur Ct; Northwood St; Noble Ct; Bennet Pl; Sumner Pl; Castle Ct; Everett Ct; Princeton Pl; Webster Pl; Wellington Rd; Hooten Ct; Short St; Lawson Pl; Ida St; McCormack Sq.
Railroad features: Mbta Blue Line RR; Penn Central RR; Mbta RR; Boston and Maine RR.
East Boston neighborhood detailed profile
Area: 4.736 square miles
Population: 123,960
Population density:
| East Boston: | 26,175 people per square mile |
| Boston: | 13,511 people per square mile |
Median household income in 2021:
| East Boston: | $81,546 |
| Boston: | $79,283 |
Median rent in in 2021:
| East Boston: | $1,696 |
| Boston: | $1,696 |
Male vs Females
| Males: | 64,189 |
| Females: | 59,771 |
Median age
| Males: | 35.9 years |
| Females: | 34.1 years |
Housing prices:
Average estimated value of detached houses in 2021 (11.2% of all units):
| East Boston: | $686,237 |
| Boston: | $683,896 |
Average estimated value of townhouses or other attached units in 2021 (5.8% of all units):
| This neighborhood: | $190,341 |
| city: | $1,097,292 |
Average estimated value of housing units in 2-unit structures in 2021 (14.1% of all units):
| This neighborhood: | $559,459 |
| Boston: | $639,493 |
Average estimated '21 value of housing units in 3-to-4-unit structures (66.0% of all units):
| East Boston: | $315,600 |
| city: | $745,440 |
Average estimated '21 value of housing units in 5-or-more-unit structures (19.4% of all units):
| East Boston: | $444,664 |
| Boston: | $986,433 |
Most popular occupations of males: service occupations (34.9%); sales and office occupations (11.1%); management occupations (except farmers) (10.9%); construction, extraction, and maintenance occupations (6.6%); computer and mathematical occupations (6.2%); transportation occupations (5.7%); business and financial operations occupations (5.0%)
Most popular occupations of females: service occupations (30.8%); sales and office occupations (19.3%); management occupations (except farmers) (8.3%); business and financial operations occupations (7.8%); education, training, and library occupations (7.2%); healthcare practitioners and technical occupations (6.7%); production occupations (3.6%)
Limited-access highways (interstate or state) in this neighborhood: I- 90 (Massachusetts Tpke).
Highways in this neighborhood: State Hwy 1 Alt (William F McClellan Hwy).
Roads and streets: Bennington St; Saratoga St; N351; Bremen St; Chelsea St; Waldemar Ave; Maverick St; Sumner St; Meridian St; Princeton St; Orient Ave; Marginal St; Leyden St; Condor St; Lexington St; Paris St; Prescott St; Faywood Ave; Border St; Havre St; Gladstone St; Porter St; Falcon St; Webster St; Trenton St; Marion St; Frankfort St; Brooks St; Bayswater St; Everett St; White St; E Eagle St; St Andrews Rd; Wordsworth St; Putnam St; Orleans St; Barnes Ave; Byron St; London St; Ashley St; Cottage St; Gove St; Boardman St; Horace St; Eutaw St; Moore St; Addison St; Neptune Rd; Beachview Rd; Cowper St; Brandywyne Dr; W Eagle St; Chaucer St; Breed St; Vallar Rd; Morris St; Liverpool St; Montmorenci Ave; Lamson St; Coleridge St; Monmouth St; Porter St Exd; Vienna St; Palermo St; Lovell St; Curtis St; Clyde St; Pope St; Homer St; Walley St; Westbrook St; St Edward Rd; Neptune Cir; Thurston St; Shawsheen Rd; Seaview Ave; Geneva St; Jeffries St; Haynes St; Rice St; Decatur St; Lubec St; Swan Ave; Nay St; Leverett Ave; Annavoy St; Swift St; Shelby St; Tower St; Benevento St; Teregram St; Ruth St; Crestway Rd; Maverick Sq; New St; Wood Island Mbta Station Rd; Clipper Ship Ln; N348; Whitby St; Brenen St; Ford St; Emmet Pl; Trident St; Glendon St; Pearl Pl; Day Sq Mbta Station; Emmons St; Lewis St; Brigham St; Antrim St; Porter St (Logan Airport Boundary); Trustman Ter; Nancia St; Elbow St; Lawn Ave; Drumlin Rd; Selma St; S Bremen St; Grady Ct; Seaver St; Marion Ct; Murray Ct; Blackinton St; Drake Pl; Swift Ter; Harmony St; Anthony J Grieco Ter; Aramon St; Shrimpton St; Ardee St; Henry St; Washington Ave; Lillian St; Coppersmith Way; Wordsworth Ter; Central Sq; Winthrop St; Beck St; Glendon Pl; Marion Pl; White Street Pl; Eagle Sq; Msgr Albert A Jacobbe Rd; Chelsea Ter; Davis Ct; Appian Pl; Ipswich Pl; Neptune Ct; Paris Pl; Lamson Ct; London Ct; Porter Pl; Webster Ave; Paris Ct; Everett Pl; Bremen Pl; Sharon Ct; Percival Pl; E Gould Ct; McKay Pl; Cheever Ct; Wilbur Ct; Northwood St; Noble Ct; Bennet Pl; Sumner Pl; Castle Ct; Everett Ct; Princeton Pl; Webster Pl; Wellington Rd; Hooten Ct; Short St; Lawson Pl; Ida St; McCormack Sq.
Railroad features: Mbta Blue Line RR; Penn Central RR; Mbta RR; Boston and Maine RR.
East Boston neighborhood detailed profile
East Lower Mills neighborhood in Boston statistics: (Find on map)
Area: 0.763 square miles
Population: 5,120
Population density:
Median household income in 2021:
Median rent in in 2021:
Male vs Females
Median age
Housing prices:
Average estimated value of detached houses in 2021 (31.9% of all units):
Average estimated value of townhouses or other attached units in 2021 (9.4% of all units):
Average estimated value of housing units in 2-unit structures in 2021 (23.3% of all units):
Average estimated '21 value of housing units in 3-to-4-unit structures (17.0% of all units):
Average estimated '21 value of housing units in 5-or-more-unit structures (13.2% of all units):
Most popular occupations of males: service occupations (35.1%); sales and office occupations (13.5%); construction, extraction, and maintenance occupations (9.2%); business and financial operations occupations (7.9%); management occupations (except farmers) (7.4%); computer and mathematical occupations (5.5%); arts, design, entertainment, sports, and media occupations (4.8%)
Most popular occupations of females: sales and office occupations (22.0%); healthcare practitioners and technical occupations (14.9%); business and financial operations occupations (13.4%); service occupations (11.4%); education, training, and library occupations (10.0%); management occupations (except farmers) (8.1%); community and social services occupations (4.6%)
Highways in this neighborhood: Gallivan Blvd (State Hwy 203).
Roads and streets: Adams St; Milton St; Richmond St; Washington St; Dorchester Ave; Hill Top St; Granite Ave; Hallet St; Richview St; Butler St; Medway St; St Gregory St; Valley Rd; Bearse Ave; Rugdale Rd; Oconnell Rd; Hillsdale St; Cedar Grove St; Avondale St; Rita Rd; St Brendan Rd; Brookvale St; Branchfield St; Ventura St; Huntoon St; Grayson St; Crockett Ave; Rockne Ave; Myrtlebank Ave; Belton St; Whitridge St; Lenoxdale Ave; Mother Julian Rd; River St; Marsh St; Edna Rd; Fellsway St; Milwood Ter; Beaufield St; Frazer St; Jo Anne Ter; Sunset Ln; Grant Pl; Hutchinson St; Packard Ave; Tanglewood Rd; Wichita Ter; Milwood St; Hallet Davis St; Patterson St; Irena Rd; Morton St; Adirondack Pl; Granville St; Swan Ct.
Railroad features: Penn Central RR.
Mass transit rail lines: Mbta Red Line RR (Ashmont-Mattapan Trolley).
East Lower Mills neighborhood detailed profile
Area: 0.763 square miles
Population: 5,120
Population density:
| East Lower Mills (Cedar Grove): | 6,708 people per square mile |
| Boston: | 13,511 people per square mile |
Median household income in 2021:
| East Lower Mills (Cedar Grove): | $113,005 |
| Boston: | $79,283 |
Median rent in in 2021:
| East Lower Mills (Cedar Grove): | $1,462 |
| Boston: | $1,696 |
Male vs Females
| Males: | 2,560 |
| Females: | 2,559 |
Median age
| Males: | 36.5 years |
| Females: | 41.2 years |
Housing prices:
Average estimated value of detached houses in 2021 (31.9% of all units):
| East Lower Mills (Cedar Grove): | $548,598 |
| Boston: | $683,896 |
Average estimated value of townhouses or other attached units in 2021 (9.4% of all units):
| This neighborhood: | $529,362 |
| city: | $1,097,292 |
Average estimated value of housing units in 2-unit structures in 2021 (23.3% of all units):
| This neighborhood: | $551,406 |
| Boston: | $639,493 |
Average estimated '21 value of housing units in 3-to-4-unit structures (17.0% of all units):
| East Lower Mills (Cedar Grove): | $560,472 |
| city: | $745,440 |
Average estimated '21 value of housing units in 5-or-more-unit structures (13.2% of all units):
| East Lower Mills (Cedar Grove): | $492,140 |
| Boston: | $986,433 |
Most popular occupations of males: service occupations (35.1%); sales and office occupations (13.5%); construction, extraction, and maintenance occupations (9.2%); business and financial operations occupations (7.9%); management occupations (except farmers) (7.4%); computer and mathematical occupations (5.5%); arts, design, entertainment, sports, and media occupations (4.8%)
Most popular occupations of females: sales and office occupations (22.0%); healthcare practitioners and technical occupations (14.9%); business and financial operations occupations (13.4%); service occupations (11.4%); education, training, and library occupations (10.0%); management occupations (except farmers) (8.1%); community and social services occupations (4.6%)
Highways in this neighborhood: Gallivan Blvd (State Hwy 203).
Roads and streets: Adams St; Milton St; Richmond St; Washington St; Dorchester Ave; Hill Top St; Granite Ave; Hallet St; Richview St; Butler St; Medway St; St Gregory St; Valley Rd; Bearse Ave; Rugdale Rd; Oconnell Rd; Hillsdale St; Cedar Grove St; Avondale St; Rita Rd; St Brendan Rd; Brookvale St; Branchfield St; Ventura St; Huntoon St; Grayson St; Crockett Ave; Rockne Ave; Myrtlebank Ave; Belton St; Whitridge St; Lenoxdale Ave; Mother Julian Rd; River St; Marsh St; Edna Rd; Fellsway St; Milwood Ter; Beaufield St; Frazer St; Jo Anne Ter; Sunset Ln; Grant Pl; Hutchinson St; Packard Ave; Tanglewood Rd; Wichita Ter; Milwood St; Hallet Davis St; Patterson St; Irena Rd; Morton St; Adirondack Pl; Granville St; Swan Ct.
Railroad features: Penn Central RR.
Mass transit rail lines: Mbta Red Line RR (Ashmont-Mattapan Trolley).
East Lower Mills neighborhood detailed profile
Fenway neighborhood in Boston statistics: (Find on map)
Area: 1.227 square miles
Population: 24,418
Population density:
Median household income in 2021:
Median rent in in 2021:
Male vs Females
Median age
Most popular occupations of males: service occupations (31.2%); sales and office occupations (25.0%); education, training, and library occupations (7.6%); computer and mathematical occupations (7.1%); management occupations (except farmers) (6.5%); arts, design, entertainment, sports, and media occupations (5.6%); life, physical, and social science occupations (4.6%)
Most popular occupations of females: sales and office occupations (29.6%); service occupations (29.1%); education, training, and library occupations (10.9%); management occupations (except farmers) (8.3%); life, physical, and social science occupations (4.3%); business and financial operations occupations (4.0%); healthcare practitioners and technical occupations (3.6%)
Highways in this neighborhood: Commonwealth Ave (US Hwy 20); US Hwy 20 (Commonwealth Ave, Saint Marys St).
Limited-access highways (interstate or state) in this neighborhood: Massachusetts Tpke (I- 90).
Highways in this neighborhood: Huntington Ave (State Hwy 9); Commonwealth Ave (US Hwy 20); State Hwy 2 (Beacon St); Commonwealth Ave (Saint Marys St, US Hwy 20).
Roads and streets: Storrow Memorial Dr; Park Dr; Fenway; Riverway; Boylston St; Bay State Rd; Brookline Ave; Longwood Ave; Back St; Hemenway St; Ipswich St; Gainsborough St; Peterborough St; Massachusetts Ave; Queensberry St; Ave of the Arts; Norway St; Ruggles St; Westland Ave; Forsyth St; Jersey St; Cummington St; Evans Way; Pilgrim Rd; Van Ness St; Newbury St; Kilmarnock St; Parker St; St Stephen St; Ave Louis Pasteur; Mountfort St; Saint Alphonsus St; Lansdowne St (Ted Williams Way); St Botolph St; Symphony Rd; Charlesgate; Palace Rd; Edgerly Rd; Agassiz Rd; St Germain St; Binney St; Annunciation Rd; Field St; Burbank St; Clearway St; Leon St; Deaconess Rd; Charlesgate W; Fullerton St; Museum Rd; Shattuck St; Greenleaf St; Overland St; Forsyth; Short St; St Cecilia St; Haviland St; Hemenway Ter; Buswell St; Plymouth St; Burlington Ave; Blackfan St; Deerfield St; N389; Speare Pl; Tavern Rd; Autumn St; Louis Prang St; Dalton St; Stoneholm St; Scotia St; Sherborn St; Medfield St; Kenmore St; Maitland St; Granby St; Fenway St; Blandford St; Charlesgate E; Cambria St; Aberdeen St; Raleigh St; Miner St; Fenway Plz; Joslin Pl; University Rd; Children's Rd; Hinsdale St; Vancouver St; Arundel St; Keswick St; Tetlow St; Fencourt Rd; Worthington St; Claremont St; New Edgerly Rd; Albemarle Ter; Jimmy Fund Way; Opera Pl; Smith St; Whipple St; Tremont St; Bills Ct; Munson St; Belvidere St; Albemarle St; Ward St; Forsyth Way; Brookwood Ter.
Railroad features: Mbta Commuter Rail (Amtrak RR); Mbta Orange Line RR (Mbta Commuter Rail, Amtrak RR).
Mass transit rail lines: Mbta Green Line Trolley.
Other features: Muddy Riv.
Fenway neighborhood detailed profile
Area: 1.227 square miles
Population: 24,418
Population density:
| Fenway (Kenmore Square): | 19,905 people per square mile |
| Boston: | 13,511 people per square mile |
Median household income in 2021:
| Fenway (Kenmore Square): | $75,657 |
| Boston: | $79,283 |
Median rent in in 2021:
| Fenway (Kenmore Square): | $2,219 |
| Boston: | $1,696 |
Male vs Females
| Males: | 9,758 |
| Females: | 14,659 |
Median age
| Males: | 23.8 years |
| Females: | 25.4 years |
Most popular occupations of males: service occupations (31.2%); sales and office occupations (25.0%); education, training, and library occupations (7.6%); computer and mathematical occupations (7.1%); management occupations (except farmers) (6.5%); arts, design, entertainment, sports, and media occupations (5.6%); life, physical, and social science occupations (4.6%)
Most popular occupations of females: sales and office occupations (29.6%); service occupations (29.1%); education, training, and library occupations (10.9%); management occupations (except farmers) (8.3%); life, physical, and social science occupations (4.3%); business and financial operations occupations (4.0%); healthcare practitioners and technical occupations (3.6%)
Highways in this neighborhood: Commonwealth Ave (US Hwy 20); US Hwy 20 (Commonwealth Ave, Saint Marys St).
Limited-access highways (interstate or state) in this neighborhood: Massachusetts Tpke (I- 90).
Highways in this neighborhood: Huntington Ave (State Hwy 9); Commonwealth Ave (US Hwy 20); State Hwy 2 (Beacon St); Commonwealth Ave (Saint Marys St, US Hwy 20).
Roads and streets: Storrow Memorial Dr; Park Dr; Fenway; Riverway; Boylston St; Bay State Rd; Brookline Ave; Longwood Ave; Back St; Hemenway St; Ipswich St; Gainsborough St; Peterborough St; Massachusetts Ave; Queensberry St; Ave of the Arts; Norway St; Ruggles St; Westland Ave; Forsyth St; Jersey St; Cummington St; Evans Way; Pilgrim Rd; Van Ness St; Newbury St; Kilmarnock St; Parker St; St Stephen St; Ave Louis Pasteur; Mountfort St; Saint Alphonsus St; Lansdowne St (Ted Williams Way); St Botolph St; Symphony Rd; Charlesgate; Palace Rd; Edgerly Rd; Agassiz Rd; St Germain St; Binney St; Annunciation Rd; Field St; Burbank St; Clearway St; Leon St; Deaconess Rd; Charlesgate W; Fullerton St; Museum Rd; Shattuck St; Greenleaf St; Overland St; Forsyth; Short St; St Cecilia St; Haviland St; Hemenway Ter; Buswell St; Plymouth St; Burlington Ave; Blackfan St; Deerfield St; N389; Speare Pl; Tavern Rd; Autumn St; Louis Prang St; Dalton St; Stoneholm St; Scotia St; Sherborn St; Medfield St; Kenmore St; Maitland St; Granby St; Fenway St; Blandford St; Charlesgate E; Cambria St; Aberdeen St; Raleigh St; Miner St; Fenway Plz; Joslin Pl; University Rd; Children's Rd; Hinsdale St; Vancouver St; Arundel St; Keswick St; Tetlow St; Fencourt Rd; Worthington St; Claremont St; New Edgerly Rd; Albemarle Ter; Jimmy Fund Way; Opera Pl; Smith St; Whipple St; Tremont St; Bills Ct; Munson St; Belvidere St; Albemarle St; Ward St; Forsyth Way; Brookwood Ter.
Railroad features: Mbta Commuter Rail (Amtrak RR); Mbta Orange Line RR (Mbta Commuter Rail, Amtrak RR).
Mass transit rail lines: Mbta Green Line Trolley.
Other features: Muddy Riv.
Fenway neighborhood detailed profile
Fields Corner East neighborhood in Boston statistics: (Find on map)
Area: 0.315 square miles
Population: 5,248
Population density:
Median household income in 2021:
Median rent in in 2021:
Male vs Females
Median age
Housing prices:
Average estimated value of detached houses in 2021 (11.8% of all units):
Average estimated value of townhouses or other attached units in 2021 (3.5% of all units):
Average estimated value of housing units in 2-unit structures in 2021 (15.3% of all units):
Average estimated '21 value of housing units in 3-to-4-unit structures (47.8% of all units):
Average estimated '21 value of housing units in 5-or-more-unit structures (17.8% of all units):
Most popular occupations of males: service occupations (18.0%); sales and office occupations (12.5%); construction, extraction, and maintenance occupations (11.6%); business and financial operations occupations (9.2%); education, training, and library occupations (8.8%); transportation occupations (7.9%); material moving occupations (7.6%)
Most popular occupations of females: education, training, and library occupations (25.1%); service occupations (23.7%); sales and office occupations (15.9%); healthcare practitioners and technical occupations (13.7%); management occupations (except farmers) (6.9%); business and financial operations occupations (5.6%); production occupations (3.9%)
Limited-access highways (interstate or state) in this neighborhood: Southeast Expy (US Hwy 1, I- 93, State Hwy 3).
Roads and streets: Victory Rd; Park St; William T Morrissey Blvd; Ashland St; Adams St; Gibson St; Mill St; Mapes St; Everdean St; Clayton St; Leonard St; Dickens St; Sturtevant St; Parkman St; Freeport St; Elm St; Fenton St; Bernice St; Everett St; Granger St; Green Hill St; Beach St; Christopher St; Neponset Ave; Bispham St; Duncan St; Blanche St; Newkirk St; Manley St; Saco St; Pt Rd; Presley Rd; Harrison Park; Parkman Pl; Duncan Pl; Duncan Ter; Gordon Pl; Cassnet St; Salisbury Park; Clayton Pl; Greenwood Park; Harbell Ter; Leonard Ct; Griffin Ct.
Railroad features: Ashmont Train (Mbta Red Line RR).
Fields Corner East neighborhood detailed profile
Area: 0.315 square miles
Population: 5,248
Population density:
| Fields Corner East: | 16,666 people per square mile |
| Boston: | 13,511 people per square mile |
Median household income in 2021:
| Fields Corner East: | $65,836 |
| Boston: | $79,283 |
Median rent in in 2021:
| Fields Corner East: | $1,365 |
| Boston: | $1,696 |
Male vs Females
| Males: | 2,716 |
| Females: | 2,531 |
Median age
| Males: | 46.3 years |
| Females: | 42.4 years |
Housing prices:
Average estimated value of detached houses in 2021 (11.8% of all units):
| Fields Corner East: | $769,022 |
| Boston: | $683,896 |
Average estimated value of townhouses or other attached units in 2021 (3.5% of all units):
| This neighborhood: | $637,500 |
| city: | $1,097,292 |
Average estimated value of housing units in 2-unit structures in 2021 (15.3% of all units):
| This neighborhood: | $548,660 |
| Boston: | $639,493 |
Average estimated '21 value of housing units in 3-to-4-unit structures (47.8% of all units):
| Fields Corner East: | $494,418 |
| city: | $745,440 |
Average estimated '21 value of housing units in 5-or-more-unit structures (17.8% of all units):
| Fields Corner East: | $359,052 |
| Boston: | $986,433 |
Most popular occupations of males: service occupations (18.0%); sales and office occupations (12.5%); construction, extraction, and maintenance occupations (11.6%); business and financial operations occupations (9.2%); education, training, and library occupations (8.8%); transportation occupations (7.9%); material moving occupations (7.6%)
Most popular occupations of females: education, training, and library occupations (25.1%); service occupations (23.7%); sales and office occupations (15.9%); healthcare practitioners and technical occupations (13.7%); management occupations (except farmers) (6.9%); business and financial operations occupations (5.6%); production occupations (3.9%)
Limited-access highways (interstate or state) in this neighborhood: Southeast Expy (US Hwy 1, I- 93, State Hwy 3).
Roads and streets: Victory Rd; Park St; William T Morrissey Blvd; Ashland St; Adams St; Gibson St; Mill St; Mapes St; Everdean St; Clayton St; Leonard St; Dickens St; Sturtevant St; Parkman St; Freeport St; Elm St; Fenton St; Bernice St; Everett St; Granger St; Green Hill St; Beach St; Christopher St; Neponset Ave; Bispham St; Duncan St; Blanche St; Newkirk St; Manley St; Saco St; Pt Rd; Presley Rd; Harrison Park; Parkman Pl; Duncan Pl; Duncan Ter; Gordon Pl; Cassnet St; Salisbury Park; Clayton Pl; Greenwood Park; Harbell Ter; Leonard Ct; Griffin Ct.
Railroad features: Ashmont Train (Mbta Red Line RR).
Fields Corner East neighborhood detailed profile
Fields Corner West neighborhood in Boston statistics: (Find on map)
Area: 0.279 square miles
Population: 5,731
Population density:
Median household income in 2021:
Median rent in in 2021:
Male vs Females
Median age
Housing prices:
Average estimated value of detached houses in 2021 (19.8% of all units):
Average estimated value of townhouses or other attached units in 2021 (5.0% of all units):
Average estimated value of housing units in 2-unit structures in 2021 (26.9% of all units):
Average estimated '21 value of housing units in 3-to-4-unit structures (35.1% of all units):
Average estimated '21 value of housing units in 5-or-more-unit structures (11.7% of all units):
Most popular occupations of males: service occupations (29.6%); construction, extraction, and maintenance occupations (13.0%); sales and office occupations (10.1%); transportation occupations (7.5%); education, training, and library occupations (6.7%); management occupations (except farmers) (6.5%); material moving occupations (5.9%)
Most popular occupations of females: sales and office occupations (31.3%); service occupations (27.0%); healthcare practitioners and technical occupations (10.2%); production occupations (6.9%); education, training, and library occupations (4.9%); transportation occupations (3.6%); management occupations (except farmers) (3.5%)
Roads and streets: Park St; Melville Ave; Tonawanda St; Dakota St; Waldeck St; Dorchester Ave; Lindsey St; Wellesley Park; Larchmont St; Alpha Rd; Greenbrier St; Claybourne St; Geneva Ave; Vinson St; Upland Ave; Regina Rd; Bourneside St; Tremlett St; Paisley Park; Faulkner St; Centervale Park; Westville St; Corona St; Marlowe St; Hooper St; Boyd St; Iowa St; Washington St; Allston St; Dahlgreen St (Louis D Brown Way); Freeman St; Westville Ter; Orchardale St; Melville Ln; Fredonia St.
Railroad features: Mbta Red Line RR (Ashmont Train).
Fields Corner West neighborhood detailed profile
Area: 0.279 square miles
Population: 5,731
Population density:
| Fields Corner West: | 20,553 people per square mile |
| Boston: | 13,511 people per square mile |
Median household income in 2021:
| Fields Corner West: | $72,645 |
| Boston: | $79,283 |
Median rent in in 2021:
| Fields Corner West: | $1,382 |
| Boston: | $1,696 |
Male vs Females
| Males: | 2,867 |
| Females: | 2,863 |
Median age
| Males: | 37.0 years |
| Females: | 37.4 years |
Housing prices:
Average estimated value of detached houses in 2021 (19.8% of all units):
| Fields Corner West: | $769,022 |
| Boston: | $683,896 |
Average estimated value of townhouses or other attached units in 2021 (5.0% of all units):
| This neighborhood: | $77,290 |
| city: | $1,097,292 |
Average estimated value of housing units in 2-unit structures in 2021 (26.9% of all units):
| This neighborhood: | $548,660 |
| Boston: | $639,493 |
Average estimated '21 value of housing units in 3-to-4-unit structures (35.1% of all units):
| Fields Corner West: | $494,418 |
| city: | $745,440 |
Average estimated '21 value of housing units in 5-or-more-unit structures (11.7% of all units):
| Fields Corner West: | $359,052 |
| Boston: | $986,433 |
Most popular occupations of males: service occupations (29.6%); construction, extraction, and maintenance occupations (13.0%); sales and office occupations (10.1%); transportation occupations (7.5%); education, training, and library occupations (6.7%); management occupations (except farmers) (6.5%); material moving occupations (5.9%)
Most popular occupations of females: sales and office occupations (31.3%); service occupations (27.0%); healthcare practitioners and technical occupations (10.2%); production occupations (6.9%); education, training, and library occupations (4.9%); transportation occupations (3.6%); management occupations (except farmers) (3.5%)
Roads and streets: Park St; Melville Ave; Tonawanda St; Dakota St; Waldeck St; Dorchester Ave; Lindsey St; Wellesley Park; Larchmont St; Alpha Rd; Greenbrier St; Claybourne St; Geneva Ave; Vinson St; Upland Ave; Regina Rd; Bourneside St; Tremlett St; Paisley Park; Faulkner St; Centervale Park; Westville St; Corona St; Marlowe St; Hooper St; Boyd St; Iowa St; Washington St; Allston St; Dahlgreen St (Louis D Brown Way); Freeman St; Westville Ter; Orchardale St; Melville Ln; Fredonia St.
Railroad features: Mbta Red Line RR (Ashmont Train).
Fields Corner West neighborhood detailed profile
Financial District neighborhood in Boston statistics: (Find on map)
Area: 0.105 square miles
Limited-access highways (interstate or state) in this neighborhood: I- 93 (State Hwy 3, US Hwy 1, John F Fitzgerald Expy).
Roads and streets: High St; Franklin St; Milk St; Congress St; Federal St; Water St; Purchase St; Oliver St; Pearl St; Broad St; Batterymarch St; Central St; India St; Boates Ct; Matthews St; Kilby St; Milton Pl; Well St; Federal Ct; Exchange St; Jenton Way; Post Office Sq; Wendell St; Gridley St; Wharf St; Devonshire St; High Street Pl; Quaker Ln; Custom House St; Batterymarch Arm; Kilby Pl; Sullivan Pl; Commercial St; Lane Pl; Summer St; Leman Pl; High Ct.
Financial District neighborhood detailed profile
Fort Point neighborhood in Boston statistics: (Find on map)
Area: 0.297 square miles
Limited-access highways (interstate or state) in this neighborhood: I- 90 (Massachusetts Tpke); US Hwy 1 (John F Fitzgerald Expy, State Hwy 3, I- 93).
Roads and streets: A St; Congress St; Seaport Blvd (Northern Ave); Summer St; Dorchester Ave; Sleeper St; Granite St; Midway St; Binford St; N380; Necco St; Richards St; W 2nd St; Atlantic Ave; Melcher St; Pittsburgh St; Purchase St; Necco Ct; Farnsworth St; Thomson Pl (Stillings St); Baldwin St; Wormwood St; Baldwin Pl; Fort Hill Wharf; Oliver St; Mt Washington Ave; Mount Washington Ave; Estes Pl; New Northern Ave; Yard Way; Hathaway St; Calvin Pl; High St; Lane Pl; Necco Pl.
Railroad features: Penn Central RR.
Fort Point neighborhood detailed profile
Four Corners neighborhood in Boston statistics: (Find on map)
Area: 0.010 square miles
Population: 305
Population density:
Median household income in 2021:
Median rent in in 2021:
Male vs Females
Median age
Housing prices:
Average estimated value of detached houses in 2021 (24.5% of all units):
Average estimated value of townhouses or other attached units in 2021 (3.1% of all units):
Average estimated value of housing units in 2-unit structures in 2021 (26.5% of all units):
Average estimated '21 value of housing units in 3-to-4-unit structures (22.4% of all units):
Average estimated '21 value of housing units in 5-or-more-unit structures (1.0% of all units):
Most popular occupations of males: transportation occupations (39.2%); sales and office occupations (15.4%); management occupations (except farmers) (13.9%); service occupations (10.3%); material moving occupations (9.5%); construction, extraction, and maintenance occupations (7.0%); education, training, and library occupations (2.6%)
Most popular occupations of females: sales and office occupations (49.1%); service occupations (19.7%); transportation occupations (7.7%); management occupations (except farmers) (7.0%); production occupations (3.8%); business and financial operations occupations (3.7%); community and social services occupations (3.7%)
Roads and streets: Dakota St; Washington St.
Four Corners neighborhood detailed profile
Area: 0.010 square miles
Population: 305
Population density:
| Four Corners: | 30,663 people per square mile |
| Boston: | 13,511 people per square mile |
Median household income in 2021:
| Four Corners: | $70,186 |
| Boston: | $79,283 |
Median rent in in 2021:
| Four Corners: | $1,827 |
| Boston: | $1,696 |
Male vs Females
| Males: | 152 |
| Females: | 152 |
Median age
| Males: | 33.8 years |
| Females: | 34.8 years |
Housing prices:
Average estimated value of detached houses in 2021 (24.5% of all units):
| Four Corners: | $769,022 |
| Boston: | $683,896 |
Average estimated value of townhouses or other attached units in 2021 (3.1% of all units):
| This neighborhood: | $204,310 |
| city: | $1,097,292 |
Average estimated value of housing units in 2-unit structures in 2021 (26.5% of all units):
| This neighborhood: | $548,660 |
| Boston: | $639,493 |
Average estimated '21 value of housing units in 3-to-4-unit structures (22.4% of all units):
| Four Corners: | $494,418 |
| city: | $745,440 |
Average estimated '21 value of housing units in 5-or-more-unit structures (1.0% of all units):
| Four Corners: | $359,052 |
| Boston: | $986,433 |
Most popular occupations of males: transportation occupations (39.2%); sales and office occupations (15.4%); management occupations (except farmers) (13.9%); service occupations (10.3%); material moving occupations (9.5%); construction, extraction, and maintenance occupations (7.0%); education, training, and library occupations (2.6%)
Most popular occupations of females: sales and office occupations (49.1%); service occupations (19.7%); transportation occupations (7.7%); management occupations (except farmers) (7.0%); production occupations (3.8%); business and financial operations occupations (3.7%); community and social services occupations (3.7%)
Roads and streets: Dakota St; Washington St.
Four Corners neighborhood detailed profile
Franklin Field South neighborhood in Boston statistics: (Find on map)
Area: 0.597 square miles
Population: 12,862
Population density:
Median household income in 2021:
Median rent in in 2021:
Male vs Females
Median age
Housing prices:
Average estimated value of detached houses in 2021 (11.5% of all units):
Average estimated value of townhouses or other attached units in 2021 (25.9% of all units):
Average estimated value of housing units in 2-unit structures in 2021 (25.6% of all units):
Average estimated '21 value of housing units in 3-to-4-unit structures (41.3% of all units):
Most popular occupations of males: service occupations (26.4%); sales and office occupations (15.5%); transportation occupations (15.1%); construction, extraction, and maintenance occupations (9.6%); material moving occupations (7.5%); business and financial operations occupations (4.8%); healthcare practitioners and technical occupations (4.4%)
Most popular occupations of females: service occupations (33.6%); sales and office occupations (32.1%); healthcare practitioners and technical occupations (11.5%); education, training, and library occupations (6.3%); management occupations (except farmers) (4.3%); business and financial operations occupations (4.1%); community and social services occupations (3.2%)
Highways in this neighborhood: State Hwy 28 (Blue Hill Ave); Morton St (State Hwy 203).
Roads and streets: Woodrow Ave; Callender St; Harvard St; Stratton St; Westview St; Ballou Ave; Lucerne St; Ames St; Floyd St; Ashton St; Willowwood St; Jones Ave; Mascot St; Franklin Hill Ave; Norfolk St; Mountain Ave; Johnston Rd; Winston Rd; Wilcock St; Balsam St; Shandon Rd; Arbutus St; Tonset St; Harwood St; Jacob St; Middleton St; Fabyan St; Hansborough St; Lorne St; Ansel Rd; Theodore St; Brookview St; Wilbert Rd; Oakhurst St; Austin St; Greenock St; Frontenac St; Livingstone St; Irma St; Donald Rd; Bernard St; Dumas St; Lyford St; Wildwood St; Tucker St; Hildreth St; Fermoy Heights Ave; Paxton St; Don St; Marden Ave; Lauriat St; Carlos St; Wollaston Ter; Westview Way; Boyden St; Wilbert Cir; Iola St; Johnson Ter; Ballou Pl; Wilson St.
Railroad features: Mbta Commuter Rail.
Franklin Field South neighborhood detailed profile
Area: 0.597 square miles
Population: 12,862
Population density:
| Franklin Field South: | 21,528 people per square mile |
| Boston: | 13,511 people per square mile |
Median household income in 2021:
| Franklin Field South: | $45,451 |
| Boston: | $79,283 |
Median rent in in 2021:
| Franklin Field South: | $1,301 |
| Boston: | $1,696 |
Male vs Females
| Males: | 5,661 |
| Females: | 7,201 |
Median age
| Males: | 27.6 years |
| Females: | 35.4 years |
Housing prices:
Average estimated value of detached houses in 2021 (11.5% of all units):
| Franklin Field South: | $427,659 |
| Boston: | $683,896 |
Average estimated value of townhouses or other attached units in 2021 (25.9% of all units):
| This neighborhood: | $447,345 |
| city: | $1,097,292 |
Average estimated value of housing units in 2-unit structures in 2021 (25.6% of all units):
| This neighborhood: | $418,319 |
| Boston: | $639,493 |
Average estimated '21 value of housing units in 3-to-4-unit structures (41.3% of all units):
| Franklin Field South: | $411,382 |
| city: | $745,440 |
Most popular occupations of males: service occupations (26.4%); sales and office occupations (15.5%); transportation occupations (15.1%); construction, extraction, and maintenance occupations (9.6%); material moving occupations (7.5%); business and financial operations occupations (4.8%); healthcare practitioners and technical occupations (4.4%)
Most popular occupations of females: service occupations (33.6%); sales and office occupations (32.1%); healthcare practitioners and technical occupations (11.5%); education, training, and library occupations (6.3%); management occupations (except farmers) (4.3%); business and financial operations occupations (4.1%); community and social services occupations (3.2%)
Highways in this neighborhood: State Hwy 28 (Blue Hill Ave); Morton St (State Hwy 203).
Roads and streets: Woodrow Ave; Callender St; Harvard St; Stratton St; Westview St; Ballou Ave; Lucerne St; Ames St; Floyd St; Ashton St; Willowwood St; Jones Ave; Mascot St; Franklin Hill Ave; Norfolk St; Mountain Ave; Johnston Rd; Winston Rd; Wilcock St; Balsam St; Shandon Rd; Arbutus St; Tonset St; Harwood St; Jacob St; Middleton St; Fabyan St; Hansborough St; Lorne St; Ansel Rd; Theodore St; Brookview St; Wilbert Rd; Oakhurst St; Austin St; Greenock St; Frontenac St; Livingstone St; Irma St; Donald Rd; Bernard St; Dumas St; Lyford St; Wildwood St; Tucker St; Hildreth St; Fermoy Heights Ave; Paxton St; Don St; Marden Ave; Lauriat St; Carlos St; Wollaston Ter; Westview Way; Boyden St; Wilbert Cir; Iola St; Johnson Ter; Ballou Pl; Wilson St.
Railroad features: Mbta Commuter Rail.
Franklin Field South neighborhood detailed profile
Government Center neighborhood in Boston statistics: (Find on map)
Area: 0.034 square miles
Roads and streets: Congress St; Court St; State St; Cornhill St; Union St.
Government Center neighborhood detailed profile
Area: 0.034 square miles
Roads and streets: Congress St; Court St; State St; Cornhill St; Union St.
Government Center neighborhood detailed profile
Harbor Islands neighborhood in Boston statistics: (Find on map)
Area: 1.388 square miles
Population: 831
Population density:
Median household income in 2021:
Median rent in in 2021:
Male vs Females
Median age
Housing prices:
Average estimated value of detached houses in 2021 (62.7% of all units):
Average estimated value of townhouses or other attached units in 2021 (1.1% of all units):
Average estimated value of housing units in 2-unit structures in 2021 (28.2% of all units):
Average estimated '21 value of housing units in 3-to-4-unit structures (2.8% of all units):
Most popular occupations of males: construction, extraction, and maintenance occupations (12.3%); business and financial operations occupations (11.7%); education, training, and library occupations (11.4%); sales and office occupations (11.1%); management occupations (except farmers) (10.2%); transportation occupations (9.0%); computer and mathematical occupations (7.8%)
Most popular occupations of females: management occupations (except farmers) (28.0%); business and financial operations occupations (24.3%); sales and office occupations (15.4%); healthcare practitioners and technical occupations (9.9%); service occupations (7.9%); computer and mathematical occupations (6.7%); education, training, and library occupations (4.2%)
Roads and streets: Long Island Rd; Tafts Ave; Deer Island Rd; Gallups Island St; Taft Ave; Lovell Island Rd; Correction House Rd; Fort Dawes Rd.
Harbor Islands neighborhood detailed profile
Area: 1.388 square miles
Population: 831
Population density:
| Harbor Islands: | 599 people per square mile |
| Boston: | 13,511 people per square mile |
Median household income in 2021:
| Harbor Islands: | $131,727 |
| Boston: | $79,283 |
Median rent in in 2021:
| Harbor Islands: | $1,823 |
| Boston: | $1,696 |
Male vs Females
| Males: | 376 |
| Females: | 455 |
Median age
| Males: | 51.9 years |
| Females: | 38.8 years |
Housing prices:
Average estimated value of detached houses in 2021 (62.7% of all units):
| Harbor Islands: | $243,541 |
| Boston: | $683,896 |
Average estimated value of townhouses or other attached units in 2021 (1.1% of all units):
| This neighborhood: | $244,950 |
| city: | $1,097,292 |
Average estimated value of housing units in 2-unit structures in 2021 (28.2% of all units):
| This neighborhood: | $304,031 |
| Boston: | $639,493 |
Average estimated '21 value of housing units in 3-to-4-unit structures (2.8% of all units):
| Harbor Islands: | $413,800 |
| city: | $745,440 |
Most popular occupations of males: construction, extraction, and maintenance occupations (12.3%); business and financial operations occupations (11.7%); education, training, and library occupations (11.4%); sales and office occupations (11.1%); management occupations (except farmers) (10.2%); transportation occupations (9.0%); computer and mathematical occupations (7.8%)
Most popular occupations of females: management occupations (except farmers) (28.0%); business and financial operations occupations (24.3%); sales and office occupations (15.4%); healthcare practitioners and technical occupations (9.9%); service occupations (7.9%); computer and mathematical occupations (6.7%); education, training, and library occupations (4.2%)
Roads and streets: Long Island Rd; Tafts Ave; Deer Island Rd; Gallups Island St; Taft Ave; Lovell Island Rd; Correction House Rd; Fort Dawes Rd.
Harbor Islands neighborhood detailed profile
Harbor View neighborhood in Boston statistics: (Find on map)
Area: 1.313 square miles
Population: 15,395
Population density:
Median household income in 2021:
Median rent in in 2021:
Male vs Females
Median age
Housing prices:
Average estimated value of detached houses in 2021 (21.3% of all units):
Average estimated value of housing units in 2-unit structures in 2021 (30.0% of all units):
Average estimated '21 value of housing units in 5-or-more-unit structures (0.9% of all units):
Most popular occupations of males: service occupations (29.8%); sales and office occupations (15.4%); management occupations (except farmers) (13.5%); computer and mathematical occupations (10.6%); construction, extraction, and maintenance occupations (8.4%); transportation occupations (6.4%); education, training, and library occupations (5.4%)
Most popular occupations of females: service occupations (30.6%); sales and office occupations (22.0%); education, training, and library occupations (11.5%); life, physical, and social science occupations (7.4%); healthcare practitioners and technical occupations (6.4%); business and financial operations occupations (5.5%); management occupations (except farmers) (4.7%)
Highways in this neighborhood: State Hwy 145 (Bennington St); William F McClellan Hwy (State Hwy 1 Alt).
Roads and streets: Saratoga St; Waldemar Ave; Orient Ave; Leyden St; Faywood Ave; Gladstone St; Bayswater St; St Andrews Rd; Wordsworth St; Barnes Ave; Byron St; Ashley St; Boardman St; Horace St; Frankfort St; Moore St; Addison St; Beachview Rd; Cowper St; Brandywyne Dr; Chaucer St; Breed St; Vallar Rd; Montmorenci Ave; Vienna St; Palermo St; Pope St; Homer St; Walley St; Westbrook St; St Edward Rd; Neptune Cir; Thurston St; Shawsheen Rd; Seaview Ave; Rice St; Coleridge St; Curtis St; Neptune Rd; Swan Ave; Leverett Ave; Annavoy St; Swift St; Tower St; Benevento St; Teregram St; Crestway Rd; Whitby St; Ford St; Trident St; Wood Island Mbta Station Rd; Antrim St; Trustman Ter; Nancia St; Lawn Ave; Drumlin Rd; Selma St; Blackinton St; Swift Ter; Harmony St; Lillian St; Wordsworth Ter; Northwood St.
Railroad features: Mbta Blue Line RR; Mbta RR; Boston and Maine RR; Penn Central RR.
Harbor View neighborhood detailed profile
Area: 1.313 square miles
Population: 15,395
Population density:
| Harbor View (Orient Heights): | 11,727 people per square mile |
| Boston: | 13,511 people per square mile |
Median household income in 2021:
| Harbor View (Orient Heights): | $78,441 |
| Boston: | $79,283 |
Median rent in in 2021:
| Harbor View (Orient Heights): | $1,709 |
| Boston: | $1,696 |
Male vs Females
| Males: | 7,420 |
| Females: | 7,974 |
Median age
| Males: | 42.6 years |
| Females: | 41.6 years |
Housing prices:
Average estimated value of detached houses in 2021 (21.3% of all units):
| Harbor View (Orient Heights): | $446,440 |
| Boston: | $683,896 |
Average estimated value of housing units in 2-unit structures in 2021 (30.0% of all units):
| This neighborhood: | $559,459 |
| Boston: | $639,493 |
Average estimated '21 value of housing units in 5-or-more-unit structures (0.9% of all units):
| Harbor View (Orient Heights): | $520,851 |
| Boston: | $986,433 |
Most popular occupations of males: service occupations (29.8%); sales and office occupations (15.4%); management occupations (except farmers) (13.5%); computer and mathematical occupations (10.6%); construction, extraction, and maintenance occupations (8.4%); transportation occupations (6.4%); education, training, and library occupations (5.4%)
Most popular occupations of females: service occupations (30.6%); sales and office occupations (22.0%); education, training, and library occupations (11.5%); life, physical, and social science occupations (7.4%); healthcare practitioners and technical occupations (6.4%); business and financial operations occupations (5.5%); management occupations (except farmers) (4.7%)
Highways in this neighborhood: State Hwy 145 (Bennington St); William F McClellan Hwy (State Hwy 1 Alt).
Roads and streets: Saratoga St; Waldemar Ave; Orient Ave; Leyden St; Faywood Ave; Gladstone St; Bayswater St; St Andrews Rd; Wordsworth St; Barnes Ave; Byron St; Ashley St; Boardman St; Horace St; Frankfort St; Moore St; Addison St; Beachview Rd; Cowper St; Brandywyne Dr; Chaucer St; Breed St; Vallar Rd; Montmorenci Ave; Vienna St; Palermo St; Pope St; Homer St; Walley St; Westbrook St; St Edward Rd; Neptune Cir; Thurston St; Shawsheen Rd; Seaview Ave; Rice St; Coleridge St; Curtis St; Neptune Rd; Swan Ave; Leverett Ave; Annavoy St; Swift St; Tower St; Benevento St; Teregram St; Crestway Rd; Whitby St; Ford St; Trident St; Wood Island Mbta Station Rd; Antrim St; Trustman Ter; Nancia St; Lawn Ave; Drumlin Rd; Selma St; Blackinton St; Swift Ter; Harmony St; Lillian St; Wordsworth Ter; Northwood St.
Railroad features: Mbta Blue Line RR; Mbta RR; Boston and Maine RR; Penn Central RR.
Harbor View neighborhood detailed profile
Highland Park neighborhood in Boston statistics: (Find on map)
Area: 0.296 square miles
Population: 4,473
Population density:
Median household income in 2021:
Median rent in in 2021:
Male vs Females
Median age
Housing prices:
Average estimated value of detached houses in 2021 (16.7% of all units):
Average estimated value of townhouses or other attached units in 2021 (9.5% of all units):
Average estimated value of housing units in 2-unit structures in 2021 (18.4% of all units):
Average estimated '21 value of housing units in 3-to-4-unit structures (39.2% of all units):
Average estimated '21 value of housing units in 5-or-more-unit structures (9.4% of all units):
Most popular occupations of males: sales and office occupations (17.0%); service occupations (11.7%); business and financial operations occupations (10.2%); material moving occupations (9.5%); architecture and engineering occupations (8.5%); management occupations (except farmers) (7.1%); transportation occupations (6.6%)
Most popular occupations of females: service occupations (28.3%); sales and office occupations (13.2%); management occupations (except farmers) (11.7%); business and financial operations occupations (9.9%); computer and mathematical occupations (7.8%); healthcare practitioners and technical occupations (6.6%); community and social services occupations (5.8%)
Roads and streets: Highland St; Cedar St; Centre St; Washington St; Thornton St; Roxbury St; Marcella St; Bartlett St; Lambert Ave; Dudley St; Fort Ave; Beech Glen St; Fulda St; Hawthorne St; Linwood St; Ritchie St; Millmont St; Lambert St; Juniper St; Norfolk St; Kenilworth St; Dorr St; Vale St; Highland Park Ave; Valentine St; Linwood Sq; Logan St; Thwing St; Rockledge St; Highland Ave; Guild St; Ellis St; Elmwood St; Newark St; King St; Oakland St; Highland Park St; Gardner St; Willoughby Pl; Putnam St; Merton Pl; Fort Avenue Ter; New Dudley St; Blanchard St; Cedar Park; Alvah Kittredge Park; Morley St; Anita Ter; Cedar Sq; Centre Street Ter; Centre Pl; Archer Ter; Highland Ter; Romar Ter; Bonner Ter; Mulvey Ter; Osgood Ct; Harrington Ave; Eliot Ter; Vale Ct; John Eliot Sq; Bonnel Ter; Chicamauga Park; Willis Ter; Thornton Pl; Putnam Pl; Gay St.
Highland Park neighborhood detailed profile
Area: 0.296 square miles
Population: 4,473
Population density:
| Highland Park: | 15,116 people per square mile |
| Boston: | 13,511 people per square mile |
Median household income in 2021:
| Highland Park: | $61,470 |
| Boston: | $79,283 |
Median rent in in 2021:
| Highland Park: | $1,887 |
| Boston: | $1,696 |
Male vs Females
| Males: | 2,081 |
| Females: | 2,392 |
Median age
| Males: | 28.1 years |
| Females: | 41.9 years |
Housing prices:
Average estimated value of detached houses in 2021 (16.7% of all units):
| Highland Park: | $933,339 |
| Boston: | $683,896 |
Average estimated value of townhouses or other attached units in 2021 (9.5% of all units):
| This neighborhood: | $705,003 |
| city: | $1,097,292 |
Average estimated value of housing units in 2-unit structures in 2021 (18.4% of all units):
| This neighborhood: | $753,697 |
| Boston: | $639,493 |
Average estimated '21 value of housing units in 3-to-4-unit structures (39.2% of all units):
| Highland Park: | $1,926,402 |
| city: | $745,440 |
Average estimated '21 value of housing units in 5-or-more-unit structures (9.4% of all units):
| Highland Park: | $427,574 |
| Boston: | $986,433 |
Most popular occupations of males: sales and office occupations (17.0%); service occupations (11.7%); business and financial operations occupations (10.2%); material moving occupations (9.5%); architecture and engineering occupations (8.5%); management occupations (except farmers) (7.1%); transportation occupations (6.6%)
Most popular occupations of females: service occupations (28.3%); sales and office occupations (13.2%); management occupations (except farmers) (11.7%); business and financial operations occupations (9.9%); computer and mathematical occupations (7.8%); healthcare practitioners and technical occupations (6.6%); community and social services occupations (5.8%)
Roads and streets: Highland St; Cedar St; Centre St; Washington St; Thornton St; Roxbury St; Marcella St; Bartlett St; Lambert Ave; Dudley St; Fort Ave; Beech Glen St; Fulda St; Hawthorne St; Linwood St; Ritchie St; Millmont St; Lambert St; Juniper St; Norfolk St; Kenilworth St; Dorr St; Vale St; Highland Park Ave; Valentine St; Linwood Sq; Logan St; Thwing St; Rockledge St; Highland Ave; Guild St; Ellis St; Elmwood St; Newark St; King St; Oakland St; Highland Park St; Gardner St; Willoughby Pl; Putnam St; Merton Pl; Fort Avenue Ter; New Dudley St; Blanchard St; Cedar Park; Alvah Kittredge Park; Morley St; Anita Ter; Cedar Sq; Centre Street Ter; Centre Pl; Archer Ter; Highland Ter; Romar Ter; Bonner Ter; Mulvey Ter; Osgood Ct; Harrington Ave; Eliot Ter; Vale Ct; John Eliot Sq; Bonnel Ter; Chicamauga Park; Willis Ter; Thornton Pl; Putnam Pl; Gay St.
Highland Park neighborhood detailed profile
Kenmore neighborhood in Boston statistics: (Find on map)
Area: 0.299 square miles
Population: 6,217
Population density:
Median household income in 2021:
Median rent in in 2021:
Male vs Females
Median age
Most popular occupations of males: service occupations (20.9%); education, training, and library occupations (16.1%); management occupations (except farmers) (12.7%); legal occupations (11.5%); sales and office occupations (10.9%); computer and mathematical occupations (10.4%); business and financial operations occupations (6.2%)
Most popular occupations of females: service occupations (19.6%); sales and office occupations (19.5%); education, training, and library occupations (14.4%); management occupations (except farmers) (13.4%); business and financial operations occupations (11.8%); legal occupations (6.7%); life, physical, and social science occupations (5.3%)
Highways in this neighborhood: Commonwealth Ave (US Hwy 20); US Hwy 20 (Commonwealth Ave, Saint Marys St).
Roads and streets: Saint Marys St (St Marys St).
Limited-access highways (interstate or state) in this neighborhood: Massachusetts Tpke (I- 90).
Highways in this neighborhood: Commonwealth Ave (US Hwy 20); State Hwy 2 (Beacon St); Commonwealth Ave (Saint Marys St, US Hwy 20).
Roads and streets: Storrow Memorial Dr; Bay State Rd; Back St; Brookline Ave; Park Dr; Cummington St; Newbury St; Mountfort St; Charlesgate W; Fullerton St; Overland St; Buswell St; Burlington Ave; Deerfield St; N389; Sherborn St; Medfield St; Kenmore St; Maitland St; Granby St; Blandford St; Aberdeen St; Raleigh St; Miner St; Fenway Plz; University Rd; Riverway; Hinsdale St; Arundel St; Keswick St; Munson St.
Railroad features: Mbta Commuter Rail (Amtrak RR).
Mass transit rail lines: Mbta Green Line Trolley.
Kenmore neighborhood detailed profile
Area: 0.299 square miles
Population: 6,217
Population density:
| Kenmore: | 20,819 people per square mile |
| Boston: | 13,511 people per square mile |
Median household income in 2021:
| Kenmore: | $85,645 |
| Boston: | $79,283 |
Median rent in in 2021:
| Kenmore: | $2,282 |
| Boston: | $1,696 |
Male vs Females
| Males: | 2,177 |
| Females: | 4,040 |
Median age
| Males: | 21.2 years |
| Females: | 22.3 years |
Most popular occupations of males: service occupations (20.9%); education, training, and library occupations (16.1%); management occupations (except farmers) (12.7%); legal occupations (11.5%); sales and office occupations (10.9%); computer and mathematical occupations (10.4%); business and financial operations occupations (6.2%)
Most popular occupations of females: service occupations (19.6%); sales and office occupations (19.5%); education, training, and library occupations (14.4%); management occupations (except farmers) (13.4%); business and financial operations occupations (11.8%); legal occupations (6.7%); life, physical, and social science occupations (5.3%)
Highways in this neighborhood: Commonwealth Ave (US Hwy 20); US Hwy 20 (Commonwealth Ave, Saint Marys St).
Roads and streets: Saint Marys St (St Marys St).
Limited-access highways (interstate or state) in this neighborhood: Massachusetts Tpke (I- 90).
Highways in this neighborhood: Commonwealth Ave (US Hwy 20); State Hwy 2 (Beacon St); Commonwealth Ave (Saint Marys St, US Hwy 20).
Roads and streets: Storrow Memorial Dr; Bay State Rd; Back St; Brookline Ave; Park Dr; Cummington St; Newbury St; Mountfort St; Charlesgate W; Fullerton St; Overland St; Buswell St; Burlington Ave; Deerfield St; N389; Sherborn St; Medfield St; Kenmore St; Maitland St; Granby St; Blandford St; Aberdeen St; Raleigh St; Miner St; Fenway Plz; University Rd; Riverway; Hinsdale St; Arundel St; Keswick St; Munson St.
Railroad features: Mbta Commuter Rail (Amtrak RR).
Mass transit rail lines: Mbta Green Line Trolley.
Kenmore neighborhood detailed profile
Leather District neighborhood in Boston statistics: (Find on map)
Area: 0.019 square miles
Roads and streets: Atlantic Ave; South St; Utica St; East St; Beach St; Kneeland St; East Pl; Tufts St.
Leather District neighborhood detailed profile
Area: 0.019 square miles
Roads and streets: Atlantic Ave; South St; Utica St; East St; Beach St; Kneeland St; East Pl; Tufts St.
Leather District neighborhood detailed profile
Longwood neighborhood in Boston statistics: (Find on map)
Area: 0.309 square miles
Population: 6,878
Population density:
Median household income in 2021:
Median rent in in 2021:
Male vs Females
Median age
Most popular occupations of males: service occupations (36.8%); sales and office occupations (27.0%); education, training, and library occupations (8.0%); life, physical, and social science occupations (6.5%); management occupations (except farmers) (6.2%); arts, design, entertainment, sports, and media occupations (5.1%); computer and mathematical occupations (3.4%)
Most popular occupations of females: service occupations (33.1%); sales and office occupations (31.8%); education, training, and library occupations (10.8%); management occupations (except farmers) (6.6%); life, physical, and social science occupations (5.0%); healthcare practitioners and technical occupations (3.3%); business and financial operations occupations (2.8%)
Highways in this neighborhood: State Hwy 9 (Huntington Ave); State Hwy 9 (Mbta Green Line Trolley, Huntington Ave).
Roads and streets: Longwood Ave; Brookline Ave; Francis St; Fenway; Fenwood Rd; Binney St; Pilgrim Rd; New Whitney St; Ave Louis Pasteur; Palace Rd; Mission Park Dr; Deaconess Rd; Shattuck St; St Albans Rd; Short St; Blackfan St; Vining St; Evans Way; Joslin Pl; Kempton St; Children's Rd; Vancouver St; Tetlow St; Jimmy Fund Way; Louis Prang St; Brookwood Ter; Riverway.
Longwood neighborhood detailed profile
Area: 0.309 square miles
Population: 6,878
Population density:
| Longwood (LMA): | 22,255 people per square mile |
| Boston: | 13,511 people per square mile |
Median household income in 2021:
| Longwood (LMA): | $77,012 |
| Boston: | $79,283 |
Median rent in in 2021:
| Longwood (LMA): | $1,966 |
| Boston: | $1,696 |
Male vs Females
| Males: | 2,239 |
| Females: | 4,639 |
Median age
| Males: | 20.5 years |
| Females: | 21.4 years |
Most popular occupations of males: service occupations (36.8%); sales and office occupations (27.0%); education, training, and library occupations (8.0%); life, physical, and social science occupations (6.5%); management occupations (except farmers) (6.2%); arts, design, entertainment, sports, and media occupations (5.1%); computer and mathematical occupations (3.4%)
Most popular occupations of females: service occupations (33.1%); sales and office occupations (31.8%); education, training, and library occupations (10.8%); management occupations (except farmers) (6.6%); life, physical, and social science occupations (5.0%); healthcare practitioners and technical occupations (3.3%); business and financial operations occupations (2.8%)
Highways in this neighborhood: State Hwy 9 (Huntington Ave); State Hwy 9 (Mbta Green Line Trolley, Huntington Ave).
Roads and streets: Longwood Ave; Brookline Ave; Francis St; Fenway; Fenwood Rd; Binney St; Pilgrim Rd; New Whitney St; Ave Louis Pasteur; Palace Rd; Mission Park Dr; Deaconess Rd; Shattuck St; St Albans Rd; Short St; Blackfan St; Vining St; Evans Way; Joslin Pl; Kempton St; Children's Rd; Vancouver St; Tetlow St; Jimmy Fund Way; Louis Prang St; Brookwood Ter; Riverway.
Longwood neighborhood detailed profile
Lower Roxbury neighborhood in Boston statistics: (Find on map)
Area: 0.393 square miles
Population: 7,832
Population density:
Median household income in 2021:
Median rent in in 2021:
Male vs Females
Median age
Housing prices:
Average estimated value of detached houses in 2021 (7.0% of all units):
Average estimated value of townhouses or other attached units in 2021 (5.8% of all units):
Average estimated value of housing units in 2-unit structures in 2021 (5.6% of all units):
Average estimated '21 value of housing units in 3-to-4-unit structures (29.9% of all units):
Average estimated '21 value of housing units in 5-or-more-unit structures (22.4% of all units):
Most popular occupations of males: service occupations (26.4%); material moving occupations (9.9%); management occupations (except farmers) (9.0%); sales and office occupations (9.0%); healthcare practitioners and technical occupations (8.6%); transportation occupations (7.6%); legal occupations (6.8%)
Most popular occupations of females: service occupations (53.9%); sales and office occupations (17.1%); community and social services occupations (8.6%); management occupations (except farmers) (5.8%); transportation occupations (5.0%); healthcare practitioners and technical occupations (4.2%); education, training, and library occupations (2.7%)
Highways in this neighborhood: Tremont St (State Hwy 28).
Roads and streets: Eustis St; Dudley St; New Dudley St; Magazine St; Washington St; Dewitt Dr; Ziegler St; Gerard St; Kemble St; Ruggles St; Shawmut Ave; Harrison Ave; Hampden St; Norfolk Ave; Allerton St; Farnham St; Howard St; Whittier St; N447; Yeoman St; Adams St; George St; Island St; Mall St; Albany St; Linden Park St; Massachusetts Ave; Warren St; Reading St; Melnea Cass Blvd; Madison Park Ct; Dade St; Degautier Way; Williams St; Ambrose St; Dearborn St; Dunmore St; Shabazz Way; Crosby Sq; Kerr Pl; Bethune Way; Prescott St; Palmer St; Chadwick St; Estabrook Rd; Cabot St; Webber St; Vernon St; Alther St; Marvin St; Kerr Way; Taber St; Renfrew St; Wheatley Way; Raynor Cir; Renfrew Ct; Woodrow Wilson Ct; Sojourner Truth Ct; Hunneman St; Winslow St; Ruggles Ct; Orchard Park St; Gary St; Roxbury St; Hubbard Ter; E Campbell Pl; Station St.
Lower Roxbury neighborhood detailed profile
Area: 0.393 square miles
Population: 7,832
Population density:
| Lower Roxbury: | 19,935 people per square mile |
| Boston: | 13,511 people per square mile |
Median household income in 2021:
| Lower Roxbury: | $51,397 |
| Boston: | $79,283 |
Median rent in in 2021:
| Lower Roxbury: | $991 |
| Boston: | $1,696 |
Male vs Females
| Males: | 3,358 |
| Females: | 4,474 |
Median age
| Males: | 29.2 years |
| Females: | 36.5 years |
Housing prices:
Average estimated value of detached houses in 2021 (7.0% of all units):
| Lower Roxbury: | $487,267 |
| Boston: | $683,896 |
Average estimated value of townhouses or other attached units in 2021 (5.8% of all units):
| This neighborhood: | $773,338 |
| city: | $1,097,292 |
Average estimated value of housing units in 2-unit structures in 2021 (5.6% of all units):
| This neighborhood: | $1,110,362 |
| Boston: | $639,493 |
Average estimated '21 value of housing units in 3-to-4-unit structures (29.9% of all units):
| Lower Roxbury: | $709,481 |
| city: | $745,440 |
Average estimated '21 value of housing units in 5-or-more-unit structures (22.4% of all units):
| Lower Roxbury: | $268,047 |
| Boston: | $986,433 |
Most popular occupations of males: service occupations (26.4%); material moving occupations (9.9%); management occupations (except farmers) (9.0%); sales and office occupations (9.0%); healthcare practitioners and technical occupations (8.6%); transportation occupations (7.6%); legal occupations (6.8%)
Most popular occupations of females: service occupations (53.9%); sales and office occupations (17.1%); community and social services occupations (8.6%); management occupations (except farmers) (5.8%); transportation occupations (5.0%); healthcare practitioners and technical occupations (4.2%); education, training, and library occupations (2.7%)
Highways in this neighborhood: Tremont St (State Hwy 28).
Roads and streets: Eustis St; Dudley St; New Dudley St; Magazine St; Washington St; Dewitt Dr; Ziegler St; Gerard St; Kemble St; Ruggles St; Shawmut Ave; Harrison Ave; Hampden St; Norfolk Ave; Allerton St; Farnham St; Howard St; Whittier St; N447; Yeoman St; Adams St; George St; Island St; Mall St; Albany St; Linden Park St; Massachusetts Ave; Warren St; Reading St; Melnea Cass Blvd; Madison Park Ct; Dade St; Degautier Way; Williams St; Ambrose St; Dearborn St; Dunmore St; Shabazz Way; Crosby Sq; Kerr Pl; Bethune Way; Prescott St; Palmer St; Chadwick St; Estabrook Rd; Cabot St; Webber St; Vernon St; Alther St; Marvin St; Kerr Way; Taber St; Renfrew St; Wheatley Way; Raynor Cir; Renfrew Ct; Woodrow Wilson Ct; Sojourner Truth Ct; Hunneman St; Winslow St; Ruggles Ct; Orchard Park St; Gary St; Roxbury St; Hubbard Ter; E Campbell Pl; Station St.
Lower Roxbury neighborhood detailed profile
Maverick Sq neighborhood in Boston statistics: (Find on map)
Area: 0.381 square miles
Population: 11,829
Population density:
Median household income in 2021:
Median rent in in 2021:
Male vs Females
Median age
Housing prices:
Average estimated value of detached houses in 2021 (8.4% of all units):
Average estimated value of townhouses or other attached units in 2021 (6.9% of all units):
Average estimated value of housing units in 2-unit structures in 2021 (11.4% of all units):
Average estimated '21 value of housing units in 3-to-4-unit structures (68.3% of all units):
Average estimated '21 value of housing units in 5-or-more-unit structures (14.9% of all units):
Most popular occupations of males: service occupations (44.0%); construction, extraction, and maintenance occupations (8.4%); sales and office occupations (8.3%); management occupations (except farmers) (6.8%); transportation occupations (6.5%); production occupations (6.0%); computer and mathematical occupations (4.1%)
Most popular occupations of females: service occupations (39.1%); sales and office occupations (20.1%); production occupations (6.5%); healthcare practitioners and technical occupations (5.4%); education, training, and library occupations (5.0%); management occupations (except farmers) (4.8%); business and financial operations occupations (4.6%)
Highways in this neighborhood: State Hwy 1 Alt (William F McClellan Hwy).
Roads and streets: Bremen St; Bennington St; Chelsea St; Paris St; Havre St; Border St; London St; Porter St; Sumner St; Maverick St; Meridian St; Morris St; Liverpool St; Marion St; Gove St; Brooks St; Decatur St; Putnam St; Prescott St; Maverick Sq; New St; Clipper Ship Ln; N348; Marginal St; Emmons St; Lewis St; Elbow St; S Bremen St; Grady Ct; Neptune Rd; Marion Ct; Drake Pl; Anthony J Grieco Ter; Henry St; Washington Ave; Coppersmith Way; Central Sq; Winthrop St; Msgr Albert A Jacobbe Rd; Chelsea Ter; Davis Ct; Appian Pl; Paris Pl; London Ct; Porter Pl; Paris Ct; Bremen Pl; Sharon Ct; Clyde St.
Railroad features: Penn Central RR.
Maverick Sq neighborhood detailed profile
Area: 0.381 square miles
Population: 11,829
Population density:
| Maverick Sq: | 31,040 people per square mile |
| Boston: | 13,511 people per square mile |
Median household income in 2021:
| Maverick Sq: | $70,930 |
| Boston: | $79,283 |
Median rent in in 2021:
| Maverick Sq: | $1,483 |
| Boston: | $1,696 |
Male vs Females
| Males: | 6,378 |
| Females: | 5,450 |
Median age
| Males: | 34.3 years |
| Females: | 31.7 years |
Housing prices:
Average estimated value of detached houses in 2021 (8.4% of all units):
| Maverick Sq: | $548,060 |
| Boston: | $683,896 |
Average estimated value of townhouses or other attached units in 2021 (6.9% of all units):
| This neighborhood: | $389,429 |
| city: | $1,097,292 |
Average estimated value of housing units in 2-unit structures in 2021 (11.4% of all units):
| This neighborhood: | $1,653,676 |
| Boston: | $639,493 |
Average estimated '21 value of housing units in 3-to-4-unit structures (68.3% of all units):
| Maverick Sq: | $505,399 |
| city: | $745,440 |
Average estimated '21 value of housing units in 5-or-more-unit structures (14.9% of all units):
| Maverick Sq: | $491,224 |
| Boston: | $986,433 |
Most popular occupations of males: service occupations (44.0%); construction, extraction, and maintenance occupations (8.4%); sales and office occupations (8.3%); management occupations (except farmers) (6.8%); transportation occupations (6.5%); production occupations (6.0%); computer and mathematical occupations (4.1%)
Most popular occupations of females: service occupations (39.1%); sales and office occupations (20.1%); production occupations (6.5%); healthcare practitioners and technical occupations (5.4%); education, training, and library occupations (5.0%); management occupations (except farmers) (4.8%); business and financial operations occupations (4.6%)
Highways in this neighborhood: State Hwy 1 Alt (William F McClellan Hwy).
Roads and streets: Bremen St; Bennington St; Chelsea St; Paris St; Havre St; Border St; London St; Porter St; Sumner St; Maverick St; Meridian St; Morris St; Liverpool St; Marion St; Gove St; Brooks St; Decatur St; Putnam St; Prescott St; Maverick Sq; New St; Clipper Ship Ln; N348; Marginal St; Emmons St; Lewis St; Elbow St; S Bremen St; Grady Ct; Neptune Rd; Marion Ct; Drake Pl; Anthony J Grieco Ter; Henry St; Washington Ave; Coppersmith Way; Central Sq; Winthrop St; Msgr Albert A Jacobbe Rd; Chelsea Ter; Davis Ct; Appian Pl; Paris Pl; London Ct; Porter Pl; Paris Ct; Bremen Pl; Sharon Ct; Clyde St.
Railroad features: Penn Central RR.
Maverick Sq neighborhood detailed profile
Medical Center Area neighborhood in Boston statistics: (Find on map)
Area: 0.352 square miles
Population: 6,925
Population density:
Median household income in 2021:
Median rent in in 2021:
Male vs Females
Median age
Most popular occupations of males: service occupations (35.6%); sales and office occupations (28.3%); education, training, and library occupations (7.8%); life, physical, and social science occupations (6.2%); management occupations (except farmers) (5.8%); arts, design, entertainment, sports, and media occupations (4.4%); computer and mathematical occupations (4.0%)
Most popular occupations of females: service occupations (32.7%); sales and office occupations (32.0%); education, training, and library occupations (10.5%); management occupations (except farmers) (6.7%); life, physical, and social science occupations (5.0%); healthcare practitioners and technical occupations (3.2%); business and financial operations occupations (3.1%)
Highways in this neighborhood: Huntington Ave (State Hwy 9).
Roads and streets: Riverway; Longwood Ave; Brookline Ave; Fenway; Pilgrim Rd; Evans Way; Ave Louis Pasteur; Saint Alphonsus St; Palace Rd; Binney St; Deaconess Rd; Shattuck St; Annunciation Rd; Short St; Plymouth St; Blackfan St; Autumn St; Louis Prang St; Parker St; Joslin Pl; Children's Rd; Vancouver St; Tetlow St; Worthington St; Jimmy Fund Way; Smith St; Tremont St; Fenway St; Ruggles St; Ward St; Brookwood Ter.
Medical Center Area neighborhood detailed profile
Area: 0.352 square miles
Population: 6,925
Population density:
| Medical Center Area: | 19,667 people per square mile |
| Boston: | 13,511 people per square mile |
Median household income in 2021:
| Medical Center Area: | $79,069 |
| Boston: | $79,283 |
Median rent in in 2021:
| Medical Center Area: | $1,878 |
| Boston: | $1,696 |
Male vs Females
| Males: | 2,421 |
| Females: | 4,504 |
Median age
| Males: | 20.9 years |
| Females: | 22.7 years |
Most popular occupations of males: service occupations (35.6%); sales and office occupations (28.3%); education, training, and library occupations (7.8%); life, physical, and social science occupations (6.2%); management occupations (except farmers) (5.8%); arts, design, entertainment, sports, and media occupations (4.4%); computer and mathematical occupations (4.0%)
Most popular occupations of females: service occupations (32.7%); sales and office occupations (32.0%); education, training, and library occupations (10.5%); management occupations (except farmers) (6.7%); life, physical, and social science occupations (5.0%); healthcare practitioners and technical occupations (3.2%); business and financial operations occupations (3.1%)
Highways in this neighborhood: Huntington Ave (State Hwy 9).
Roads and streets: Riverway; Longwood Ave; Brookline Ave; Fenway; Pilgrim Rd; Evans Way; Ave Louis Pasteur; Saint Alphonsus St; Palace Rd; Binney St; Deaconess Rd; Shattuck St; Annunciation Rd; Short St; Plymouth St; Blackfan St; Autumn St; Louis Prang St; Parker St; Joslin Pl; Children's Rd; Vancouver St; Tetlow St; Worthington St; Jimmy Fund Way; Smith St; Tremont St; Fenway St; Ruggles St; Ward St; Brookwood Ter.
Medical Center Area neighborhood detailed profile
Meeting Housing Hill neighborhood in Boston statistics: (Find on map)
Area: 0.264 square miles
Population: 7,472
Population density:
Median household income in 2021:
Median rent in in 2021:
Male vs Females
Median age
Housing prices:
Average estimated value of detached houses in 2021 (6.8% of all units):
Average estimated value of townhouses or other attached units in 2021 (4.2% of all units):
Average estimated value of housing units in 2-unit structures in 2021 (15.2% of all units):
Average estimated '21 value of housing units in 3-to-4-unit structures (67.0% of all units):
Average estimated '21 value of housing units in 5-or-more-unit structures (10.8% of all units):
Most popular occupations of males: service occupations (24.9%); sales and office occupations (12.8%); transportation occupations (10.4%); production occupations (9.9%); construction, extraction, and maintenance occupations (8.5%); business and financial operations occupations (8.4%); computer and mathematical occupations (4.5%)
Most popular occupations of females: service occupations (36.7%); sales and office occupations (24.0%); education, training, and library occupations (14.9%); healthcare practitioners and technical occupations (8.1%); business and financial operations occupations (5.4%); management occupations (except farmers) (3.9%); community and social services occupations (2.4%)
Roads and streets: Dorchester Ave; Geneva Ave; Adams St; Homes Ave; Westville St; Charles St; Mount Ida Rd; Linden St; Ridgewood St; Longfellow St; Hecla St; Lyon St; Robinson St; Topliff St; Arcadia St; Draper St; Orchardfield St; Fox St; Speedwell St; Leroy St; Freeport St; Stonehurst St; Levant St; Kimball St; Josephine St; Leedsville St; Percival St; Hamilton St; Ditson St; Ellsworth St; Holiday St; Juliette St; Arcadia Park; Greenwich St; Potosi St; Marie St; Ellet St; Montello St; Bentham Rd; Corwin St; Toledo Ter; Norton St; Marlin Way; Arcadia Ter; Delano St; Linden Ct.
Meeting Housing Hill neighborhood detailed profile
Area: 0.264 square miles
Population: 7,472
Population density:
| Meeting Housing Hill: | 28,261 people per square mile |
| Boston: | 13,511 people per square mile |
Median household income in 2021:
| Meeting Housing Hill: | $60,129 |
| Boston: | $79,283 |
Median rent in in 2021:
| Meeting Housing Hill: | $1,511 |
| Boston: | $1,696 |
Male vs Females
| Males: | 3,684 |
| Females: | 3,788 |
Median age
| Males: | 34.8 years |
| Females: | 36.9 years |
Housing prices:
Average estimated value of detached houses in 2021 (6.8% of all units):
| Meeting Housing Hill: | $501,224 |
| Boston: | $683,896 |
Average estimated value of townhouses or other attached units in 2021 (4.2% of all units):
| This neighborhood: | $564,329 |
| city: | $1,097,292 |
Average estimated value of housing units in 2-unit structures in 2021 (15.2% of all units):
| This neighborhood: | $265,980 |
| Boston: | $639,493 |
Average estimated '21 value of housing units in 3-to-4-unit structures (67.0% of all units):
| Meeting Housing Hill: | $497,615 |
| city: | $745,440 |
Average estimated '21 value of housing units in 5-or-more-unit structures (10.8% of all units):
| Meeting Housing Hill: | $359,052 |
| Boston: | $986,433 |
Most popular occupations of males: service occupations (24.9%); sales and office occupations (12.8%); transportation occupations (10.4%); production occupations (9.9%); construction, extraction, and maintenance occupations (8.5%); business and financial operations occupations (8.4%); computer and mathematical occupations (4.5%)
Most popular occupations of females: service occupations (36.7%); sales and office occupations (24.0%); education, training, and library occupations (14.9%); healthcare practitioners and technical occupations (8.1%); business and financial operations occupations (5.4%); management occupations (except farmers) (3.9%); community and social services occupations (2.4%)
Roads and streets: Dorchester Ave; Geneva Ave; Adams St; Homes Ave; Westville St; Charles St; Mount Ida Rd; Linden St; Ridgewood St; Longfellow St; Hecla St; Lyon St; Robinson St; Topliff St; Arcadia St; Draper St; Orchardfield St; Fox St; Speedwell St; Leroy St; Freeport St; Stonehurst St; Levant St; Kimball St; Josephine St; Leedsville St; Percival St; Hamilton St; Ditson St; Ellsworth St; Holiday St; Juliette St; Arcadia Park; Greenwich St; Potosi St; Marie St; Ellet St; Montello St; Bentham Rd; Corwin St; Toledo Ter; Norton St; Marlin Way; Arcadia Ter; Delano St; Linden Ct.
Meeting Housing Hill neighborhood detailed profile
Mission Hill neighborhood in Boston statistics: (Find on map)
Area: 0.817 square miles
Population: 17,805
Population density:
Median household income in 2021:
Median rent in in 2021:
Male vs Females
Median age
Housing prices:
Average estimated value of detached houses in 2021 (4.8% of all units):
Average estimated value of townhouses or other attached units in 2021 (10.0% of all units):
Average estimated value of housing units in 2-unit structures in 2021 (17.3% of all units):
Average estimated '21 value of housing units in 3-to-4-unit structures (35.4% of all units):
Average estimated '21 value of housing units in 5-or-more-unit structures (42.4% of all units):
Most popular occupations of males: sales and office occupations (24.8%); service occupations (14.7%); computer and mathematical occupations (11.2%); life, physical, and social science occupations (8.1%); education, training, and library occupations (7.9%); management occupations (except farmers) (6.6%); business and financial operations occupations (4.4%)
Most popular occupations of females: sales and office occupations (19.7%); service occupations (15.2%); healthcare practitioners and technical occupations (14.1%); business and financial operations occupations (10.1%); education, training, and library occupations (9.1%); management occupations (except farmers) (8.2%); life, physical, and social science occupations (5.4%)
Highways in this neighborhood: State Hwy 9 (Huntington Ave); Columbus Ave (State Hwy 28); State Hwy 9 (Mbta Green Line Trolley, Huntington Ave); Melnea Cass Blvd (State Hwy 28).
Roads and streets: Tremont St; Parker St; Parker Hill Ave; Hillside St; Fisher Ave; Calumet St; Alleghany St; Terrace St; Ruggles St; Saint Alphonsus St; Heath St; Smith St; Wensley St; Iroquois St; Iroquois St (Sachem St); Ward St; Horadan Way; Annunciation Rd; McGreevey Way; Lawn St; Gainsborough St; St Botolph St; Camden St; Delle Ave; Prentiss St; Pontiac St; Field St; Forsyth St; Northampton St; Vancouver St; Leon St; Alton Ct (Turquoise Way); Worthington St; Wait St; Ellingwood St; Greenleaf St; Cherokee St; Darling St; Station St; Tavern Rd; Gurney St; Cedar St; Mindoro St; Whittier St; Ave of the Arts; New Heath St; Huban Ct; San Juan Way (Oregon Ct); Halleck St; Tobin Ct; Stockwell St; Eldora St; Frawley St; Wigglesworth St; Newcastle Ct; Douglas Park; Longwood Ave; Watson St; Cornelia Ct; Elmwood St; Sunset St; Davenport St; Newark St; Benton St; Parker Hill Pl; Burke St; Bucknam St; Mission St; Coventry St; Cunard St; St Cyprians Pl; Sewall St; Bromley St; Bickford Ave; Dilworth St; Gore St; Oswald St; Oscar St; Estey St; Burney St; Folsom Ave; Massachusetts Ave; Hayden St; Fencourt Rd; Museum Rd; Melvina Patton Way; Carmel St; Parker Hill Ter; New Dudley St; Copenger St; Waymount St; Evans Way; Harleston St; Judge St; Louis Prang St; Anita Ter; Hemenway St; Pequot St; Bills Ct; Centre St; Clout St; Forsyth Way; Morton Pl; Twombley Pl; Roxbury St; Vitale Pl; S Whitney St; Torpie St; Lenox St; Faxon St; Hammond St; Decatur Ave.
Railroad features: Mbta Orange Line RR (Amtrak RR, Mbta Commuter Rail).
Mission Hill neighborhood detailed profile
Area: 0.817 square miles
Population: 17,805
Population density:
| Mission Hill: | 21,787 people per square mile |
| Boston: | 13,511 people per square mile |
Median household income in 2021:
| Mission Hill: | $71,004 |
| Boston: | $79,283 |
Median rent in in 2021:
| Mission Hill: | $1,689 |
| Boston: | $1,696 |
Male vs Females
| Males: | 9,390 |
| Females: | 8,414 |
Median age
| Males: | 25.0 years |
| Females: | 28.9 years |
Housing prices:
Average estimated value of detached houses in 2021 (4.8% of all units):
| Mission Hill: | $379,519 |
| Boston: | $683,896 |
Average estimated value of townhouses or other attached units in 2021 (10.0% of all units):
| This neighborhood: | $591,022 |
| city: | $1,097,292 |
Average estimated value of housing units in 2-unit structures in 2021 (17.3% of all units):
| This neighborhood: | $751,643 |
| Boston: | $639,493 |
Average estimated '21 value of housing units in 3-to-4-unit structures (35.4% of all units):
| Mission Hill: | $573,294 |
| city: | $745,440 |
Average estimated '21 value of housing units in 5-or-more-unit structures (42.4% of all units):
| Mission Hill: | $733,684 |
| Boston: | $986,433 |
Most popular occupations of males: sales and office occupations (24.8%); service occupations (14.7%); computer and mathematical occupations (11.2%); life, physical, and social science occupations (8.1%); education, training, and library occupations (7.9%); management occupations (except farmers) (6.6%); business and financial operations occupations (4.4%)
Most popular occupations of females: sales and office occupations (19.7%); service occupations (15.2%); healthcare practitioners and technical occupations (14.1%); business and financial operations occupations (10.1%); education, training, and library occupations (9.1%); management occupations (except farmers) (8.2%); life, physical, and social science occupations (5.4%)
Highways in this neighborhood: State Hwy 9 (Huntington Ave); Columbus Ave (State Hwy 28); State Hwy 9 (Mbta Green Line Trolley, Huntington Ave); Melnea Cass Blvd (State Hwy 28).
Roads and streets: Tremont St; Parker St; Parker Hill Ave; Hillside St; Fisher Ave; Calumet St; Alleghany St; Terrace St; Ruggles St; Saint Alphonsus St; Heath St; Smith St; Wensley St; Iroquois St; Iroquois St (Sachem St); Ward St; Horadan Way; Annunciation Rd; McGreevey Way; Lawn St; Gainsborough St; St Botolph St; Camden St; Delle Ave; Prentiss St; Pontiac St; Field St; Forsyth St; Northampton St; Vancouver St; Leon St; Alton Ct (Turquoise Way); Worthington St; Wait St; Ellingwood St; Greenleaf St; Cherokee St; Darling St; Station St; Tavern Rd; Gurney St; Cedar St; Mindoro St; Whittier St; Ave of the Arts; New Heath St; Huban Ct; San Juan Way (Oregon Ct); Halleck St; Tobin Ct; Stockwell St; Eldora St; Frawley St; Wigglesworth St; Newcastle Ct; Douglas Park; Longwood Ave; Watson St; Cornelia Ct; Elmwood St; Sunset St; Davenport St; Newark St; Benton St; Parker Hill Pl; Burke St; Bucknam St; Mission St; Coventry St; Cunard St; St Cyprians Pl; Sewall St; Bromley St; Bickford Ave; Dilworth St; Gore St; Oswald St; Oscar St; Estey St; Burney St; Folsom Ave; Massachusetts Ave; Hayden St; Fencourt Rd; Museum Rd; Melvina Patton Way; Carmel St; Parker Hill Ter; New Dudley St; Copenger St; Waymount St; Evans Way; Harleston St; Judge St; Louis Prang St; Anita Ter; Hemenway St; Pequot St; Bills Ct; Centre St; Clout St; Forsyth Way; Morton Pl; Twombley Pl; Roxbury St; Vitale Pl; S Whitney St; Torpie St; Lenox St; Faxon St; Hammond St; Decatur Ave.
Railroad features: Mbta Orange Line RR (Amtrak RR, Mbta Commuter Rail).
Mission Hill neighborhood detailed profile
Mission Hill Projects neighborhood in Boston statistics: (Find on map)
Area: 0.100 square miles
Population: 896
Population density:
Median household income in 2021:
Median rent in in 2021:
Male vs Females
Median age
Housing prices:
Average estimated value of detached houses in 2021 (2.4% of all units):
Average estimated value of townhouses or other attached units in 2021 (80.5% of all units):
Average estimated value of housing units in 2-unit structures in 2021 (167.1% of all units):
Average estimated '21 value of housing units in 3-to-4-unit structures (19.5% of all units):
Average estimated '21 value of housing units in 5-or-more-unit structures (29.3% of all units):
Most popular occupations of males: sales and office occupations (40.2%); service occupations (32.9%); education, training, and library occupations (7.2%); computer and mathematical occupations (5.7%); life, physical, and social science occupations (4.6%); management occupations (except farmers) (3.6%); business and financial operations occupations (3.0%)
Most popular occupations of females: sales and office occupations (39.7%); service occupations (32.9%); business and financial operations occupations (9.0%); education, training, and library occupations (5.9%); construction, extraction, and maintenance occupations (5.3%); life, physical, and social science occupations (4.6%); arts, design, entertainment, sports, and media occupations (1.8%)
Roads and streets: McGreevey Way; Smith St; Horadan Way; Parker St; Tremont St; Alton Ct (Turquoise Way); Prentiss St; Ward St; Gurney St; Mindoro St; Huban Ct; San Juan Way (Oregon Ct); Halleck St; Tobin Ct; Station St; Cornelia Ct; Faxon St.
Railroad features: Mbta Commuter Rail (Mbta Orange Line RR, Amtrak RR).
Mission Hill Projects neighborhood detailed profile
Area: 0.100 square miles
Population: 896
Population density:
| Mission Hill Projects: | 8,997 people per square mile |
| Boston: | 13,511 people per square mile |
Median household income in 2021:
| Mission Hill Projects: | $43,871 |
| Boston: | $79,283 |
Median rent in in 2021:
| Mission Hill Projects: | $1,174 |
| Boston: | $1,696 |
Male vs Females
| Males: | 520 |
| Females: | 376 |
Median age
| Males: | 30.9 years |
| Females: | 32.0 years |
Housing prices:
Average estimated value of detached houses in 2021 (2.4% of all units):
| Mission Hill Projects: | $331,454 |
| Boston: | $683,896 |
Average estimated value of townhouses or other attached units in 2021 (80.5% of all units):
| This neighborhood: | $516,780 |
| city: | $1,097,292 |
Average estimated value of housing units in 2-unit structures in 2021 (167.1% of all units):
| This neighborhood: | $663,449 |
| Boston: | $639,493 |
Average estimated '21 value of housing units in 3-to-4-unit structures (19.5% of all units):
| Mission Hill Projects: | $502,199 |
| city: | $745,440 |
Average estimated '21 value of housing units in 5-or-more-unit structures (29.3% of all units):
| Mission Hill Projects: | $733,684 |
| Boston: | $986,433 |
Most popular occupations of males: sales and office occupations (40.2%); service occupations (32.9%); education, training, and library occupations (7.2%); computer and mathematical occupations (5.7%); life, physical, and social science occupations (4.6%); management occupations (except farmers) (3.6%); business and financial operations occupations (3.0%)
Most popular occupations of females: sales and office occupations (39.7%); service occupations (32.9%); business and financial operations occupations (9.0%); education, training, and library occupations (5.9%); construction, extraction, and maintenance occupations (5.3%); life, physical, and social science occupations (4.6%); arts, design, entertainment, sports, and media occupations (1.8%)
Roads and streets: McGreevey Way; Smith St; Horadan Way; Parker St; Tremont St; Alton Ct (Turquoise Way); Prentiss St; Ward St; Gurney St; Mindoro St; Huban Ct; San Juan Way (Oregon Ct); Halleck St; Tobin Ct; Station St; Cornelia Ct; Faxon St.
Railroad features: Mbta Commuter Rail (Mbta Orange Line RR, Amtrak RR).
Mission Hill Projects neighborhood detailed profile
Neponset neighborhood in Boston statistics: (Find on map)
Area: 0.846 square miles
Population: 6,150
Population density:
Median household income in 2021:
Median rent in in 2021:
Male vs Females
Median age
Housing prices:
Average estimated value of detached houses in 2021 (17.0% of all units):
Average estimated value of housing units in 2-unit structures in 2021 (46.4% of all units):
Average estimated '21 value of housing units in 3-to-4-unit structures (20.6% of all units):
Most popular occupations of males: sales and office occupations (23.5%); service occupations (17.3%); business and financial operations occupations (11.8%); management occupations (except farmers) (11.3%); construction, extraction, and maintenance occupations (11.0%); computer and mathematical occupations (7.4%); architecture and engineering occupations (4.1%)
Most popular occupations of females: sales and office occupations (27.1%); service occupations (12.5%); education, training, and library occupations (9.7%); business and financial operations occupations (9.4%); healthcare practitioners and technical occupations (8.8%); management occupations (except farmers) (8.6%); production occupations (5.9%)
Limited-access highways (interstate or state) in this neighborhood: State Hwy 3 (Southeast Expy, US Hwy 1, I- 93).
Highways in this neighborhood: Gallivan Blvd (State Hwy 203).
Roads and streets: William T Morrissey Blvd; Neponset Ave; Minot St; Walnut St; Conley St; Tenean St; Train St; Ashmont St; Chickatawbut St; Westglow St; Nahant Ave; Quincy Shore Dr; King St; Boutwell St; Coffey St; Taylor St; S Munroe Ter; Norwood St; N Munroe Ter; Freeport St; Port Norfolk St; Tolman St; Lawley St; Manor St; Oakton Ave; Redfield St; McKone St; Garner Rd; Water St; Worrell St; Glide St; Franklin St; Pierce Ave; Houghton St; Popes Hill St; Rosemont St; Plain St; Auriga St; Charlemont St; Thelma Rd; Daly St; Salina Rd; Newhall St; Bowman St; Clover St; Arbroth St; Spaulding St; Rosselerin Rd; Rev Robert M Costello Pl; Ericsson St; Agawam St; Claymont Ter; Flavia St; Woodworth St; Rosaria St; Lorenzo St; Southwick St; Blackwell St; Laban Pratt Rd; Bloomington St; Frost Ave; Woodfield St; Humes Rd; Oakman St; Tilesboro St; Queen St; Branton St; Ross Rd; Walnut Ct; Morrissey Blvd (Quincy Shore Dr, William T Morrissey Blvd); Dunns Ter; O Donnell Sq; Narragansett St; Rowley St; Holbrook Ave; Matigon Rd; Ainsley St; Payne St; Ann St; N119; St Clare Rd; Elmdale St; Hallet St; Henderson Rd; Ashmont Ct; Rice St; Wm E Doucette Sq; Berry St; St Jude Ter; Philip St; Newhall Pl.
Railroad features: Braintree Train (Mbta Red Line RR); Penn Central RR.
Neponset neighborhood detailed profile
Area: 0.846 square miles
Population: 6,150
Population density:
| Neponset (Port Norfolk): | 7,270 people per square mile |
| Boston: | 13,511 people per square mile |
Median household income in 2021:
| Neponset (Port Norfolk): | $128,828 |
| Boston: | $79,283 |
Median rent in in 2021:
| Neponset (Port Norfolk): | $1,371 |
| Boston: | $1,696 |
Male vs Females
| Males: | 2,920 |
| Females: | 3,230 |
Median age
| Males: | 38.1 years |
| Females: | 40.0 years |
Housing prices:
Average estimated value of detached houses in 2021 (17.0% of all units):
| Neponset (Port Norfolk): | $640,909 |
| Boston: | $683,896 |
Average estimated value of housing units in 2-unit structures in 2021 (46.4% of all units):
| This neighborhood: | $680,000 |
| Boston: | $639,493 |
Average estimated '21 value of housing units in 3-to-4-unit structures (20.6% of all units):
| Neponset (Port Norfolk): | $560,472 |
| city: | $745,440 |
Most popular occupations of males: sales and office occupations (23.5%); service occupations (17.3%); business and financial operations occupations (11.8%); management occupations (except farmers) (11.3%); construction, extraction, and maintenance occupations (11.0%); computer and mathematical occupations (7.4%); architecture and engineering occupations (4.1%)
Most popular occupations of females: sales and office occupations (27.1%); service occupations (12.5%); education, training, and library occupations (9.7%); business and financial operations occupations (9.4%); healthcare practitioners and technical occupations (8.8%); management occupations (except farmers) (8.6%); production occupations (5.9%)
Limited-access highways (interstate or state) in this neighborhood: State Hwy 3 (Southeast Expy, US Hwy 1, I- 93).
Highways in this neighborhood: Gallivan Blvd (State Hwy 203).
Roads and streets: William T Morrissey Blvd; Neponset Ave; Minot St; Walnut St; Conley St; Tenean St; Train St; Ashmont St; Chickatawbut St; Westglow St; Nahant Ave; Quincy Shore Dr; King St; Boutwell St; Coffey St; Taylor St; S Munroe Ter; Norwood St; N Munroe Ter; Freeport St; Port Norfolk St; Tolman St; Lawley St; Manor St; Oakton Ave; Redfield St; McKone St; Garner Rd; Water St; Worrell St; Glide St; Franklin St; Pierce Ave; Houghton St; Popes Hill St; Rosemont St; Plain St; Auriga St; Charlemont St; Thelma Rd; Daly St; Salina Rd; Newhall St; Bowman St; Clover St; Arbroth St; Spaulding St; Rosselerin Rd; Rev Robert M Costello Pl; Ericsson St; Agawam St; Claymont Ter; Flavia St; Woodworth St; Rosaria St; Lorenzo St; Southwick St; Blackwell St; Laban Pratt Rd; Bloomington St; Frost Ave; Woodfield St; Humes Rd; Oakman St; Tilesboro St; Queen St; Branton St; Ross Rd; Walnut Ct; Morrissey Blvd (Quincy Shore Dr, William T Morrissey Blvd); Dunns Ter; O Donnell Sq; Narragansett St; Rowley St; Holbrook Ave; Matigon Rd; Ainsley St; Payne St; Ann St; N119; St Clare Rd; Elmdale St; Hallet St; Henderson Rd; Ashmont Ct; Rice St; Wm E Doucette Sq; Berry St; St Jude Ter; Philip St; Newhall Pl.
Railroad features: Braintree Train (Mbta Red Line RR); Penn Central RR.
Neponset neighborhood detailed profile
North Dorchester neighborhood in Boston statistics: (Find on map)
Area: 2.094 square miles
Population: 38,853
Population density:
Median household income in 2021:
Median rent in in 2021:
Male vs Females
Median age
Housing prices:
Average estimated value of detached houses in 2021 (10.3% of all units):
Average estimated value of townhouses or other attached units in 2021 (5.5% of all units):
Average estimated value of housing units in 2-unit structures in 2021 (15.0% of all units):
Average estimated '21 value of housing units in 3-to-4-unit structures (51.3% of all units):
Average estimated '21 value of housing units in 5-or-more-unit structures (12.3% of all units):
Most popular occupations of males: service occupations (18.2%); sales and office occupations (17.3%); management occupations (except farmers) (10.5%); computer and mathematical occupations (7.4%); construction, extraction, and maintenance occupations (7.4%); business and financial operations occupations (6.7%); transportation occupations (6.4%)
Most popular occupations of females: sales and office occupations (22.4%); service occupations (20.4%); management occupations (except farmers) (12.3%); business and financial operations occupations (8.0%); healthcare practitioners and technical occupations (7.2%); education, training, and library occupations (7.1%); community and social services occupations (5.0%)
Limited-access highways (interstate or state) in this neighborhood: US Hwy 1 (State Hwy 3, I- 93, John F Fitzgerald Expy, General Pulaski Skwy).
Roads and streets: William T Morrissey Blvd; Mount Vernon St; Savin Hill Ave; Columbia Rd; Dorchester Ave; Massachusetts Ave; E Cottage St; Hancock St; Newmarket Sq; Sydney St; Pleasant St; Grampian Way; Auckland St; Boston St; Cushing Ave; Southampton St; Harbor Point Blvd; Sawyer Ave; Freeport St; Quincy St; N Point Dr; Stoughton St; Ocean View Dr; Bowdoin St; S Bay Ave; Church St; Bird St; Glendale St; Westwind Rd; Buttonwood St; Roseclair St; Beach Point Pl; Edison Green; Mayfield St; Sumner St; Monadnock St; Humphreys St; Romsey St; Virginia St; Harbor View St; Sudan St; Sagamore St; Crescent Ave; Bay St; N120; Belden St; Downer Ave; Saxton St; N433; Enterprise St; St Margaret St; Harvest St; Tuttle St; Island View Pl; Clapp St; Dudley St; Mayhew St; Elder St; Pearl St; Dorset St; Thornley St; Trull St; Victoria St; Locust St; Von Hillern St; Bakersfield St; Peninsula Pl; Belfort St; Bradston St; Bellevue St; Moseley St; Willis St; Bellflower St; Topeka St; Norfolk Ave; Wendover St; S Point Dr; Jerome St; Theodore Glynn Way; Taft St; Windermere Rd; Harbor Crest Ct; Washburn St; East St; Winter St; Salcombe St; Doris St; Payson Ave; Howell St; Howes St; Rill St; Deer St; Howe St; Upham Ave; Eastman St; Spring Garden St; Denny St; Elton St; Hendry St; Bodwell St; Newport St; Cameron St; W Howell St; Annabel St; Alpine Way; Fernald Ter; Rowell St; Greenmount St; Carson St; Roach St; Dewar St; Fifield St; Peverell St; Pond St; Southview St; Baker Ave; Atkinson St; Everett Ave; Grant St; High St; Hinckley St; Morrill St; Hamlet St; Trescott St; Sayward St; Caspian Way; Holden St; Willow Ct; Maryland St; Arion St; Glen St; Drayton Ave; Davern Ave; Oyster Bay Rd; Ware St; Ramsey St; Ronan St; St William St; Dawes St; Castlerock St; Hallam St; Moore St; Rockmere St; Midland St; Raven St; Hartland St; Stanley St; Gene St; Annapolis St; Springdale St; Downer Ct; Mount Cushing Ter; Groom St; Hubbardston Rd; Nonquit St; Dewolf St; Howard Johnson Plz; Evandale Ter; S Sydney St; Cawfield St; Wilbur St; Playstead Rd; Clarkson St; Whitby Ter; Coleman St; Fox Point Rd; Treadway Rd; Parish St; Rawson St; Humphreys Pl; Quincefield St; Cedar Pl; Grafton St; Chase St; Hillsboro St; Navillus Ter; Cottrell St; Cummings St; Conrad St; W Bellflower St; Wheelock Ave; Whittemore Ter; Bayside St; Baker Ct; Melvinside Ter; Lasalle Park; Hesston Ter; Dunn St; Trent St; Buttonwood Ct; Howe Ter; Old Colony Ter; Greenhalge St; Sumner Park; Graham Ct; Harrow St; Davitt St; Stoughton Ter; Fields Ct; Tovar St; Sumner Ter; Kevin Rd; Alvan Ter; Wedmore St; Allstate Rd; Savin Hill Ct; Service Pl; Sumner Sq; Romsey Cir; Franklin Ct; Sea View Ter; Columbia Pl; Thatcher Ter; Adams St; Glover Pl; Wave Ave; Dudley Ter; Savin Hill Ln; Sexton Ct; Stoughton Street Pl; N380; Harvest Ter; Dawes Ter; Power St; Quincefield Pl; Romsey Ter; Philips Pl; Savin Hill Ter; Fruean Pl; Beckwith St; Uphams Ct; Belden Sq; Napier Park.
Railroad features: Mbta Red Line RR; Penn Central RR; Mbta Commuter Rail.
North Dorchester neighborhood detailed profile
Area: 2.094 square miles
Population: 38,853
Population density:
| North Dorchester: | 18,557 people per square mile |
| Boston: | 13,511 people per square mile |
Median household income in 2021:
| North Dorchester: | $71,886 |
| Boston: | $79,283 |
Median rent in in 2021:
| North Dorchester: | $1,412 |
| Boston: | $1,696 |
Male vs Females
| Males: | 19,153 |
| Females: | 19,700 |
Median age
| Males: | 35.6 years |
| Females: | 37.6 years |
Housing prices:
Average estimated value of detached houses in 2021 (10.3% of all units):
| North Dorchester: | $646,729 |
| Boston: | $683,896 |
Average estimated value of townhouses or other attached units in 2021 (5.5% of all units):
| This neighborhood: | $307,267 |
| city: | $1,097,292 |
Average estimated value of housing units in 2-unit structures in 2021 (15.0% of all units):
| This neighborhood: | $521,633 |
| Boston: | $639,493 |
Average estimated '21 value of housing units in 3-to-4-unit structures (51.3% of all units):
| North Dorchester: | $586,975 |
| city: | $745,440 |
Average estimated '21 value of housing units in 5-or-more-unit structures (12.3% of all units):
| North Dorchester: | $417,670 |
| Boston: | $986,433 |
Most popular occupations of males: service occupations (18.2%); sales and office occupations (17.3%); management occupations (except farmers) (10.5%); computer and mathematical occupations (7.4%); construction, extraction, and maintenance occupations (7.4%); business and financial operations occupations (6.7%); transportation occupations (6.4%)
Most popular occupations of females: sales and office occupations (22.4%); service occupations (20.4%); management occupations (except farmers) (12.3%); business and financial operations occupations (8.0%); healthcare practitioners and technical occupations (7.2%); education, training, and library occupations (7.1%); community and social services occupations (5.0%)
Limited-access highways (interstate or state) in this neighborhood: US Hwy 1 (State Hwy 3, I- 93, John F Fitzgerald Expy, General Pulaski Skwy).
Roads and streets: William T Morrissey Blvd; Mount Vernon St; Savin Hill Ave; Columbia Rd; Dorchester Ave; Massachusetts Ave; E Cottage St; Hancock St; Newmarket Sq; Sydney St; Pleasant St; Grampian Way; Auckland St; Boston St; Cushing Ave; Southampton St; Harbor Point Blvd; Sawyer Ave; Freeport St; Quincy St; N Point Dr; Stoughton St; Ocean View Dr; Bowdoin St; S Bay Ave; Church St; Bird St; Glendale St; Westwind Rd; Buttonwood St; Roseclair St; Beach Point Pl; Edison Green; Mayfield St; Sumner St; Monadnock St; Humphreys St; Romsey St; Virginia St; Harbor View St; Sudan St; Sagamore St; Crescent Ave; Bay St; N120; Belden St; Downer Ave; Saxton St; N433; Enterprise St; St Margaret St; Harvest St; Tuttle St; Island View Pl; Clapp St; Dudley St; Mayhew St; Elder St; Pearl St; Dorset St; Thornley St; Trull St; Victoria St; Locust St; Von Hillern St; Bakersfield St; Peninsula Pl; Belfort St; Bradston St; Bellevue St; Moseley St; Willis St; Bellflower St; Topeka St; Norfolk Ave; Wendover St; S Point Dr; Jerome St; Theodore Glynn Way; Taft St; Windermere Rd; Harbor Crest Ct; Washburn St; East St; Winter St; Salcombe St; Doris St; Payson Ave; Howell St; Howes St; Rill St; Deer St; Howe St; Upham Ave; Eastman St; Spring Garden St; Denny St; Elton St; Hendry St; Bodwell St; Newport St; Cameron St; W Howell St; Annabel St; Alpine Way; Fernald Ter; Rowell St; Greenmount St; Carson St; Roach St; Dewar St; Fifield St; Peverell St; Pond St; Southview St; Baker Ave; Atkinson St; Everett Ave; Grant St; High St; Hinckley St; Morrill St; Hamlet St; Trescott St; Sayward St; Caspian Way; Holden St; Willow Ct; Maryland St; Arion St; Glen St; Drayton Ave; Davern Ave; Oyster Bay Rd; Ware St; Ramsey St; Ronan St; St William St; Dawes St; Castlerock St; Hallam St; Moore St; Rockmere St; Midland St; Raven St; Hartland St; Stanley St; Gene St; Annapolis St; Springdale St; Downer Ct; Mount Cushing Ter; Groom St; Hubbardston Rd; Nonquit St; Dewolf St; Howard Johnson Plz; Evandale Ter; S Sydney St; Cawfield St; Wilbur St; Playstead Rd; Clarkson St; Whitby Ter; Coleman St; Fox Point Rd; Treadway Rd; Parish St; Rawson St; Humphreys Pl; Quincefield St; Cedar Pl; Grafton St; Chase St; Hillsboro St; Navillus Ter; Cottrell St; Cummings St; Conrad St; W Bellflower St; Wheelock Ave; Whittemore Ter; Bayside St; Baker Ct; Melvinside Ter; Lasalle Park; Hesston Ter; Dunn St; Trent St; Buttonwood Ct; Howe Ter; Old Colony Ter; Greenhalge St; Sumner Park; Graham Ct; Harrow St; Davitt St; Stoughton Ter; Fields Ct; Tovar St; Sumner Ter; Kevin Rd; Alvan Ter; Wedmore St; Allstate Rd; Savin Hill Ct; Service Pl; Sumner Sq; Romsey Cir; Franklin Ct; Sea View Ter; Columbia Pl; Thatcher Ter; Adams St; Glover Pl; Wave Ave; Dudley Ter; Savin Hill Ln; Sexton Ct; Stoughton Street Pl; N380; Harvest Ter; Dawes Ter; Power St; Quincefield Pl; Romsey Ter; Philips Pl; Savin Hill Ter; Fruean Pl; Beckwith St; Uphams Ct; Belden Sq; Napier Park.
Railroad features: Mbta Red Line RR; Penn Central RR; Mbta Commuter Rail.
North Dorchester neighborhood detailed profile
Point Shirley neighborhood in Boston statistics: (Find on map)
Area: 0.832 square miles
Population: 2,161
Population density:
Median household income in 2021:
Median rent in in 2021:
Male vs Females
Median age
Housing prices:
Average estimated value of detached houses in 2021 (52.5% of all units):
Average estimated value of townhouses or other attached units in 2021 (2.2% of all units):
Average estimated value of housing units in 2-unit structures in 2021 (27.5% of all units):
Average estimated '21 value of housing units in 3-to-4-unit structures (6.4% of all units):
Most popular occupations of males: construction, extraction, and maintenance occupations (12.5%); management occupations (except farmers) (11.2%); transportation occupations (11.0%); sales and office occupations (10.9%); business and financial operations occupations (10.7%); education, training, and library occupations (9.9%); computer and mathematical occupations (6.2%)
Most popular occupations of females: management occupations (except farmers) (26.2%); sales and office occupations (20.9%); business and financial operations occupations (19.7%); service occupations (9.9%); healthcare practitioners and technical occupations (8.1%); computer and mathematical occupations (6.4%); education, training, and library occupations (3.3%)
Roads and streets: Tafts Ave; Deer Island Rd; Taft Ave; Grand View Ave; Shirley St; Bay View Ave; Correction House Rd; Undine Ave; Triton Ave; Brewster Ave (Strandway, The Strand); Otis St; Brewster Ave; Fort Dawes Rd; Siren St; Pebble Ave; Foam St (Anderson St); Townsend St; Mugford St; Hale Ave; Billows St; Elliot St; Maryland Ave; Nerious St; Whittier St; Surfside Ave; Deepwater St; Pratt St; Andrew St; Wyman St; Petrel St; Bayview Ave; Pontos St; The Strand.
Point Shirley neighborhood detailed profile
Area: 0.832 square miles
Population: 2,161
Population density:
| Point Shirley (Deer Island): | 2,599 people per square mile |
| Boston: | 13,511 people per square mile |
Median household income in 2021:
| Point Shirley (Deer Island): | $105,237 |
| Boston: | $79,283 |
Median rent in in 2021:
| Point Shirley (Deer Island): | $1,556 |
| Boston: | $1,696 |
Male vs Females
| Males: | 970 |
| Females: | 1,190 |
Median age
| Males: | 42.8 years |
| Females: | 39.1 years |
Housing prices:
Average estimated value of detached houses in 2021 (52.5% of all units):
| Point Shirley (Deer Island): | $306,169 |
| Boston: | $683,896 |
Average estimated value of townhouses or other attached units in 2021 (2.2% of all units):
| This neighborhood: | $307,941 |
| city: | $1,097,292 |
Average estimated value of housing units in 2-unit structures in 2021 (27.5% of all units):
| This neighborhood: | $382,215 |
| Boston: | $639,493 |
Average estimated '21 value of housing units in 3-to-4-unit structures (6.4% of all units):
| Point Shirley (Deer Island): | $413,800 |
| city: | $745,440 |
Most popular occupations of males: construction, extraction, and maintenance occupations (12.5%); management occupations (except farmers) (11.2%); transportation occupations (11.0%); sales and office occupations (10.9%); business and financial operations occupations (10.7%); education, training, and library occupations (9.9%); computer and mathematical occupations (6.2%)
Most popular occupations of females: management occupations (except farmers) (26.2%); sales and office occupations (20.9%); business and financial operations occupations (19.7%); service occupations (9.9%); healthcare practitioners and technical occupations (8.1%); computer and mathematical occupations (6.4%); education, training, and library occupations (3.3%)
Roads and streets: Tafts Ave; Deer Island Rd; Taft Ave; Grand View Ave; Shirley St; Bay View Ave; Correction House Rd; Undine Ave; Triton Ave; Brewster Ave (Strandway, The Strand); Otis St; Brewster Ave; Fort Dawes Rd; Siren St; Pebble Ave; Foam St (Anderson St); Townsend St; Mugford St; Hale Ave; Billows St; Elliot St; Maryland Ave; Nerious St; Whittier St; Surfside Ave; Deepwater St; Pratt St; Andrew St; Wyman St; Petrel St; Bayview Ave; Pontos St; The Strand.
Point Shirley neighborhood detailed profile
Prudential neighborhood in Boston statistics: (Find on map)
Area: 0.160 square miles
Population: 4,685
Population density:
Median household income in 2021:
Median rent in in 2021:
Male vs Females
Median age
Average estimated '21 value of housing units in 5-or-more-unit structures (61.3% of all units):
Most popular occupations of males: management occupations (except farmers) (23.7%); business and financial operations occupations (16.8%); service occupations (13.8%); sales and office occupations (12.1%); computer and mathematical occupations (6.4%); healthcare practitioners and technical occupations (5.3%); life, physical, and social science occupations (5.0%)
Most popular occupations of females: sales and office occupations (18.6%); business and financial operations occupations (17.1%); management occupations (except farmers) (14.4%); education, training, and library occupations (14.1%); healthcare practitioners and technical occupations (9.6%); service occupations (9.5%); arts, design, entertainment, sports, and media occupations (4.5%)
Limited-access highways (interstate or state) in this neighborhood: I- 90 (Massachusetts Tpke).
Highways in this neighborhood: State Hwy 9 (Huntington Ave); State Hwy 9 (Stuart St); State Hwy 28 (Columbus Ave); Clarendon St (State Hwy 28).
Roads and streets: St Botolph St; Chambers Pl; Stanhope St; Harcourt St; W Newton St; Belvidere St; Cumberland St; Garrison St; Dartmouth St; Berkeley St; Follen St; Blackwood St; Durham St; Exeter St; Albemarle Ct; Ave of the Arts; Trinity Pl.
Railroad features: Mbta Commuter Rail (Amtrak RR); Amtrak RR (Mbta Orange Line RR, Mbta Commuter Rail).
Prudential neighborhood detailed profile
Area: 0.160 square miles
Population: 4,685
Population density:
| Prudential (The Pru): | 29,355 people per square mile |
| Boston: | 13,511 people per square mile |
Median household income in 2021:
| Prudential (The Pru): | $94,625 |
| Boston: | $79,283 |
Median rent in in 2021:
| Prudential (The Pru): | $2,461 |
| Boston: | $1,696 |
Male vs Females
| Males: | 2,243 |
| Females: | 2,441 |
Median age
| Males: | 33.7 years |
| Females: | 33.7 years |
Average estimated '21 value of housing units in 5-or-more-unit structures (61.3% of all units):
| Prudential (The Pru): | $5,386,441 |
| Boston: | $986,433 |
Most popular occupations of males: management occupations (except farmers) (23.7%); business and financial operations occupations (16.8%); service occupations (13.8%); sales and office occupations (12.1%); computer and mathematical occupations (6.4%); healthcare practitioners and technical occupations (5.3%); life, physical, and social science occupations (5.0%)
Most popular occupations of females: sales and office occupations (18.6%); business and financial operations occupations (17.1%); management occupations (except farmers) (14.4%); education, training, and library occupations (14.1%); healthcare practitioners and technical occupations (9.6%); service occupations (9.5%); arts, design, entertainment, sports, and media occupations (4.5%)
Limited-access highways (interstate or state) in this neighborhood: I- 90 (Massachusetts Tpke).
Highways in this neighborhood: State Hwy 9 (Huntington Ave); State Hwy 9 (Stuart St); State Hwy 28 (Columbus Ave); Clarendon St (State Hwy 28).
Roads and streets: St Botolph St; Chambers Pl; Stanhope St; Harcourt St; W Newton St; Belvidere St; Cumberland St; Garrison St; Dartmouth St; Berkeley St; Follen St; Blackwood St; Durham St; Exeter St; Albemarle Ct; Ave of the Arts; Trinity Pl.
Railroad features: Mbta Commuter Rail (Amtrak RR); Amtrak RR (Mbta Orange Line RR, Mbta Commuter Rail).
Prudential neighborhood detailed profile
Roxbury neighborhood in Boston statistics: (Find on map)
Area: 3.915 square miles
Population: 90,931
Population density:
Median household income in 2021:
Median rent in in 2021:
Male vs Females
Median age
Housing prices:
Average estimated value of detached houses in 2021 (12.2% of all units):
Average estimated value of townhouses or other attached units in 2021 (10.7% of all units):
Average estimated value of housing units in 2-unit structures in 2021 (16.7% of all units):
Average estimated '21 value of housing units in 3-to-4-unit structures (36.0% of all units):
Average estimated '21 value of housing units in 5-or-more-unit structures (10.9% of all units):
Most popular occupations of males: service occupations (22.7%); sales and office occupations (20.0%); transportation occupations (11.8%); construction, extraction, and maintenance occupations (6.1%); management occupations (except farmers) (5.5%); material moving occupations (4.8%); education, training, and library occupations (4.0%)
Most popular occupations of females: service occupations (34.8%); sales and office occupations (23.4%); management occupations (except farmers) (7.3%); education, training, and library occupations (7.0%); healthcare practitioners and technical occupations (5.7%); business and financial operations occupations (5.5%); community and social services occupations (4.0%)
Highways in this neighborhood: Blue Hill Ave (State Hwy 28); State Hwy 28 (Seaver St); Columbus Ave (State Hwy 28); Tremont St (State Hwy 28); Morton St (State Hwy 203).
Roads and streets: Washington St; Warren St; N Jewish War Vets Dr (Circuit Dr); Dudley St; Walnut Ave; Martin Luther King Blvd; Columbia Rd; Amory St; Glen Ln; Humboldt Ave; Quincy St; Townsend St; Crawford St; Highland St; Magnolia St; Eustis St; Roxbury St; Winthrop St; Moreland St; Harold St; Intervale St; Normandy St; Talbot Ave; Norfolk Ave; Devon St; Howard Ave; Cedar St; Centre St; Dale St; Waumbeck St; Howland St; Ruthven St; Homestead St; Glenway St; Elm Hill Ave; School St; Thornton St; Harvard St; Magazine St; Shirley St; Geneva Ave; Brunswick St; Marcella St; Melnea Cass Blvd; Mount Pleasant Ave; Circuit St; American Legion Hwy; Wales St; Greenwood St; Ellington St; New Dudley St; Brookside Ave; Clifton St; Regent St; Stanwood St; Hutchings St; Alexander St; Wayland St; Montebello Rd; Harrishof St; Lawrence Ave; Erie St; Pierpont Rd; Dewitt Dr; W Cottage St; Harrison Ave; George St; Ziegler St; Shawmut Ave; Rockland St; Nightingale St; Gerard St; Playstead Rd; Brook Ave; Hartford St; Kemble St; Ruggles St; Hampden St; Esmond St; Peter Parley Rd; Burrell St; Bartlett St; Lambert Ave; Forest St; Dacia St; Langdon St; Kingsdale St; Waverly St; Fowler St; Fayston St; Dimock St; Massachusetts Ave; Maple St; Fort Ave; Savin St; Maywood St; Walnut Park; Holborn St; Clifford St; St James St; Julian St; Bragdon St; Munroe St; Adams St; Bernard St; N Jewish War Vets Dr; Cheney St; Boylston St; Schuyler St; W Walnut Park; Gaston St; Beech Glen St; Ceylon St; Georgia St; Edgewood St; Wyoming St; Allerton St; Glen Rd; Farnham St; Woodbine St; Vaughan Ave; Westminster Ave; Brookledge St; McLellan St; Forest Hills St; Atherton St; Copeland St; Holworthy St; Whiting St; Deckard St; Robeson St; Island St; Supple Rd; E Cottage St; Iffley Rd; Brookford St; Woodcliff St; Perrin St; Howard St; Proctor St; Franklin Park Rd; Whittier St; Hazelwood St; Sargent St; Dewey St; Cobden St; Dennis St; Sigourney St; Ritchie St; Cornwall St; Wabon St; Bradshaw St; N447; Alpine St; Yeoman St; Pasadena Rd; Fulda St; Codman Park; Elmore St; Marshfield St; Elm Hill Park; Browning Ave; Batchelder St; Charlotte St; Montrose St; Robin Hood St; Albany St; Woodville St; Hollander St; Folsom St; Haverford St; Hawthorne St; Linwood St; Abbot St; Marmion St; Guild St; Abbotsford St; Gleason St; Michigan Ave; Robey St; Green St; Nazing St; Dalrymple St; Greenville St; Mall St; Kerwin St; Bicknell St; Woodward Ave; Hewins St; Clarence St; Woodford St; Warner St; Creston St; Judson St; Dunreath St; Standish St; Dabney St; Millmont St; Wayne St; Lambert St; Wolcott St; Crestwood Park; Linden Park St; Fairland St; Rockford St; Juniper St; Dennison St; Harlem St; Leyland St; Norfolk St; Weaver Way; Brinsley St; Lingard St; Charlame St; Kenilworth St; Akron St; Notre Dame St; Cedric St; Chilcott Pl; Gayland St; Bismarck St; Glenarm St; Rockville Park; Academy Rd; Hartwell St; Dorr St; Kearsarge Ave; Vale St; Ophir St; Cunningham St; Park Ln; Westcott St; Shetland St; Alaska St; Reading St; Southwood St; Old Rd; Vine St; Dean St; Burgess St; Pier Pt Rd; Wilder St; Harlow St; Madison Park Ct; Wenonah St; Albion St; Mascoma St; Dade St; Highland Park Ave; Degautier Way; Catawba St; Laurel St; Olmstead St; Danube St; Canterbury St; Williams St; Egleston St; Sonoma St; Castlegate Rd; Ambrose St; Valentine St; Chamblet St; Paulding St; Dearborn St; Vesta Rd; Beethoven St; York St; Oldfields Rd; Minton St; Linwood Sq; N Walnut Entrance; Hewes St; Dimock Pl; Merrill St; North Ave; Woodside Ave; Weld Ave; Crispus Attucks Pl; Fernboro St; Logan St; Thwing St; Dunmore St; Shabazz Way; Beauford Ln; Warren Pl; Copley St; Maybrook St; Crosby Sq; Otisfield St; Half Moon St; Rockledge St; Bower St; Highland Ave; Huckins St; Carlisle St; Ingleside St; Merriam St; Dixwell St; Napa St; Page St; Woodward Park St; Helen St; Amory Ave; Greenheys St; Kerr Pl; Gannett St; Ellis St; Elbert St; Roxton St; Greenley Pl; Fountain St; Bethune Way; W Park St; Coleus Park; Germania St; Arcadia St; Murray Ave; Prescott St; Rockland Ave; Porter St; Park View St; Wabeno St; Strathcona Rd; Granada Park; Sunderland St; Hulbert St; Saint Richard St; Marbury Ter; Elmwood St; Mills St; Brenton St; N Peabody Cir; Wakullah St; Irwin Ave; Palmer St; Sherman St; Newark St; Chadwick St; Estabrook Rd; King St; Fenelon St; Bird St; Stafford St; Pleasanton St; Bray St; Wyola Pl; Wardman Rd; Morse St; Longmeadow St; Cabot St; Ennis Rd; Powellton Rd; Dove St; Oakland St; Webber St; Laredo St; Cleveland St; Aspen St; Westminster Ct; Loyola St; Waldren Rd; Vernon St; Drummond St; Highland Park St; Bard Ave; Ernst St; Slayton Way; Gardner St; Alther St; Maybury St; Marvin St; Weldon St; Bancroft St; Balfour St; Kerr Way; Taber St; Tupelo St; Mayfair St; Adrain St; Wellington Ct; Brinton St; Rand St; Woodville Park; Ronald St; Segel St; Herman St; Sylvia St; Renfrew St; Miles St; Magnolia Sq; Willoughby Pl; Mendell Way; Amory Ter; Putnam St; Haley St; Kensington Park; Merton Pl; Fort Avenue Ter; Dalkeith St; Boylston Pl; Bilodeau Rd; Roswell St; Lester St; Blanchard St; Pevear Pl; Dunkeld St; Pickering Ave; Cedar Park; Wheatley Way; Leslie Park; Gouldville Ter; Dalin Pl; Dromey St; Ackley Pl; Rocky Nook Ter; Fenno St; Raynor Cir; Marksdale St; Renfrew Ct; Rock St; Humboldt Ct; Magnolia Pl; Alvah Kittredge Park; Alpine Pl; St James Pl; Emrose Ter; Perth St; St James Ter; Page Ter; Morley St; Fenwick Pl; Montana St; Anita Ter; Cleaves St; Woodrow Wilson Ct; Sojourner Truth Ct; Woodledge St; Rand Pl; Atherton Pl; Cedar Sq; Victor St; Hestia Park; Jess St; Hunneman St; Kensington St; Winslow St; School Street Pl; Oleander St; Mount Pleasant Ter; Copeland Pl; Langford Park; Cardington St; Partridge Pl; Hartford Ter; Ruggles Ct; Oakville Ave; Lebanon St; Orchard Park St; Vine Ave; Howard Pl; Erie Pl; Elmore Park; Dove Ct; Burton Ave; Dunford St; Hartford Ct; Sherwood Ct; N Morton Ln; Quincy Ter; Mahnis Ter; Roucemont Pl; Nathan St; Lewis Pl; Dolans Ct; Centre Street Ter; Holborn Park; Langdon Ter; Hazelwood Ct; Centre Pl; Newman Pl; Hazel Park; Westminster Ter; Creston Park; Miller Park; Readfield Pl; Glenburne St; Maywood Park; Sweetfern Ter; la Grange Pl; Copeland Park; Archer Ter; Kearsarge Ter; Highland Ter; Stanwood Ter; Gary St; Nazing Ct; Rollins Ct; Romar Ter; Mount Pleasant Pl; Cleveland Park; Forest Pl; S Charlame Ter; Hansford Pl; Harold Park; Holborn Ter; Letterfine Ter; Cottage Ct; Academy Ter; S Charlame Ct; Dunreath Ter; Hubbard Ter; Charlame Pl; E Campbell Pl; Danforth Pl; Bonner Ter; Mulvey Ter; Mulberry Pl; Guild Row; Downey Ct; Maple Ct; Maywood Ter; Osgood Ct; Columbia Ter; Harrington Ave; Academy Ct; Obierne Pl; Presby Pl; Quincy Pl; Randlett Pl; Hilton Ter; Forest Hills Dr; Eliot Ter; Walnut Ct; N Charlame Ct; Silva Pl; N Charlame Ter; Regent Sq; Vale Ct; Greenville Park; Akron Pl; Toland Ct; Ruthven Park; Glines Ave; Weaver Ct; John Eliot Sq; Bonnel Ter; Intervale Ter; Circuit Sq; Fairbury St; Chicamauga Park; Kalada Park; Jarvis Pl; Willis Ter; Regent Pl; Dewey Ter; Thornton Pl; Putnam Pl; Hall Ave.
Railroad features: Mbta Commuter Rail; Penn Central RR.
Roxbury neighborhood detailed profile
Area: 3.915 square miles
Population: 90,931
Population density:
| Roxbury: | 23,227 people per square mile |
| Boston: | 13,511 people per square mile |
Median household income in 2021:
| Roxbury: | $46,191 |
| Boston: | $79,283 |
Median rent in in 2021:
| Roxbury: | $1,088 |
| Boston: | $1,696 |
Male vs Females
| Males: | 41,237 |
| Females: | 49,693 |
Median age
| Males: | 31.5 years |
| Females: | 36.3 years |
Housing prices:
Average estimated value of detached houses in 2021 (12.2% of all units):
| Roxbury: | $533,371 |
| Boston: | $683,896 |
Average estimated value of townhouses or other attached units in 2021 (10.7% of all units):
| This neighborhood: | $727,754 |
| city: | $1,097,292 |
Average estimated value of housing units in 2-unit structures in 2021 (16.7% of all units):
| This neighborhood: | $650,475 |
| Boston: | $639,493 |
Average estimated '21 value of housing units in 3-to-4-unit structures (36.0% of all units):
| Roxbury: | $492,563 |
| city: | $745,440 |
Average estimated '21 value of housing units in 5-or-more-unit structures (10.9% of all units):
| Roxbury: | $325,847 |
| Boston: | $986,433 |
Most popular occupations of males: service occupations (22.7%); sales and office occupations (20.0%); transportation occupations (11.8%); construction, extraction, and maintenance occupations (6.1%); management occupations (except farmers) (5.5%); material moving occupations (4.8%); education, training, and library occupations (4.0%)
Most popular occupations of females: service occupations (34.8%); sales and office occupations (23.4%); management occupations (except farmers) (7.3%); education, training, and library occupations (7.0%); healthcare practitioners and technical occupations (5.7%); business and financial operations occupations (5.5%); community and social services occupations (4.0%)
Highways in this neighborhood: Blue Hill Ave (State Hwy 28); State Hwy 28 (Seaver St); Columbus Ave (State Hwy 28); Tremont St (State Hwy 28); Morton St (State Hwy 203).
Roads and streets: Washington St; Warren St; N Jewish War Vets Dr (Circuit Dr); Dudley St; Walnut Ave; Martin Luther King Blvd; Columbia Rd; Amory St; Glen Ln; Humboldt Ave; Quincy St; Townsend St; Crawford St; Highland St; Magnolia St; Eustis St; Roxbury St; Winthrop St; Moreland St; Harold St; Intervale St; Normandy St; Talbot Ave; Norfolk Ave; Devon St; Howard Ave; Cedar St; Centre St; Dale St; Waumbeck St; Howland St; Ruthven St; Homestead St; Glenway St; Elm Hill Ave; School St; Thornton St; Harvard St; Magazine St; Shirley St; Geneva Ave; Brunswick St; Marcella St; Melnea Cass Blvd; Mount Pleasant Ave; Circuit St; American Legion Hwy; Wales St; Greenwood St; Ellington St; New Dudley St; Brookside Ave; Clifton St; Regent St; Stanwood St; Hutchings St; Alexander St; Wayland St; Montebello Rd; Harrishof St; Lawrence Ave; Erie St; Pierpont Rd; Dewitt Dr; W Cottage St; Harrison Ave; George St; Ziegler St; Shawmut Ave; Rockland St; Nightingale St; Gerard St; Playstead Rd; Brook Ave; Hartford St; Kemble St; Ruggles St; Hampden St; Esmond St; Peter Parley Rd; Burrell St; Bartlett St; Lambert Ave; Forest St; Dacia St; Langdon St; Kingsdale St; Waverly St; Fowler St; Fayston St; Dimock St; Massachusetts Ave; Maple St; Fort Ave; Savin St; Maywood St; Walnut Park; Holborn St; Clifford St; St James St; Julian St; Bragdon St; Munroe St; Adams St; Bernard St; N Jewish War Vets Dr; Cheney St; Boylston St; Schuyler St; W Walnut Park; Gaston St; Beech Glen St; Ceylon St; Georgia St; Edgewood St; Wyoming St; Allerton St; Glen Rd; Farnham St; Woodbine St; Vaughan Ave; Westminster Ave; Brookledge St; McLellan St; Forest Hills St; Atherton St; Copeland St; Holworthy St; Whiting St; Deckard St; Robeson St; Island St; Supple Rd; E Cottage St; Iffley Rd; Brookford St; Woodcliff St; Perrin St; Howard St; Proctor St; Franklin Park Rd; Whittier St; Hazelwood St; Sargent St; Dewey St; Cobden St; Dennis St; Sigourney St; Ritchie St; Cornwall St; Wabon St; Bradshaw St; N447; Alpine St; Yeoman St; Pasadena Rd; Fulda St; Codman Park; Elmore St; Marshfield St; Elm Hill Park; Browning Ave; Batchelder St; Charlotte St; Montrose St; Robin Hood St; Albany St; Woodville St; Hollander St; Folsom St; Haverford St; Hawthorne St; Linwood St; Abbot St; Marmion St; Guild St; Abbotsford St; Gleason St; Michigan Ave; Robey St; Green St; Nazing St; Dalrymple St; Greenville St; Mall St; Kerwin St; Bicknell St; Woodward Ave; Hewins St; Clarence St; Woodford St; Warner St; Creston St; Judson St; Dunreath St; Standish St; Dabney St; Millmont St; Wayne St; Lambert St; Wolcott St; Crestwood Park; Linden Park St; Fairland St; Rockford St; Juniper St; Dennison St; Harlem St; Leyland St; Norfolk St; Weaver Way; Brinsley St; Lingard St; Charlame St; Kenilworth St; Akron St; Notre Dame St; Cedric St; Chilcott Pl; Gayland St; Bismarck St; Glenarm St; Rockville Park; Academy Rd; Hartwell St; Dorr St; Kearsarge Ave; Vale St; Ophir St; Cunningham St; Park Ln; Westcott St; Shetland St; Alaska St; Reading St; Southwood St; Old Rd; Vine St; Dean St; Burgess St; Pier Pt Rd; Wilder St; Harlow St; Madison Park Ct; Wenonah St; Albion St; Mascoma St; Dade St; Highland Park Ave; Degautier Way; Catawba St; Laurel St; Olmstead St; Danube St; Canterbury St; Williams St; Egleston St; Sonoma St; Castlegate Rd; Ambrose St; Valentine St; Chamblet St; Paulding St; Dearborn St; Vesta Rd; Beethoven St; York St; Oldfields Rd; Minton St; Linwood Sq; N Walnut Entrance; Hewes St; Dimock Pl; Merrill St; North Ave; Woodside Ave; Weld Ave; Crispus Attucks Pl; Fernboro St; Logan St; Thwing St; Dunmore St; Shabazz Way; Beauford Ln; Warren Pl; Copley St; Maybrook St; Crosby Sq; Otisfield St; Half Moon St; Rockledge St; Bower St; Highland Ave; Huckins St; Carlisle St; Ingleside St; Merriam St; Dixwell St; Napa St; Page St; Woodward Park St; Helen St; Amory Ave; Greenheys St; Kerr Pl; Gannett St; Ellis St; Elbert St; Roxton St; Greenley Pl; Fountain St; Bethune Way; W Park St; Coleus Park; Germania St; Arcadia St; Murray Ave; Prescott St; Rockland Ave; Porter St; Park View St; Wabeno St; Strathcona Rd; Granada Park; Sunderland St; Hulbert St; Saint Richard St; Marbury Ter; Elmwood St; Mills St; Brenton St; N Peabody Cir; Wakullah St; Irwin Ave; Palmer St; Sherman St; Newark St; Chadwick St; Estabrook Rd; King St; Fenelon St; Bird St; Stafford St; Pleasanton St; Bray St; Wyola Pl; Wardman Rd; Morse St; Longmeadow St; Cabot St; Ennis Rd; Powellton Rd; Dove St; Oakland St; Webber St; Laredo St; Cleveland St; Aspen St; Westminster Ct; Loyola St; Waldren Rd; Vernon St; Drummond St; Highland Park St; Bard Ave; Ernst St; Slayton Way; Gardner St; Alther St; Maybury St; Marvin St; Weldon St; Bancroft St; Balfour St; Kerr Way; Taber St; Tupelo St; Mayfair St; Adrain St; Wellington Ct; Brinton St; Rand St; Woodville Park; Ronald St; Segel St; Herman St; Sylvia St; Renfrew St; Miles St; Magnolia Sq; Willoughby Pl; Mendell Way; Amory Ter; Putnam St; Haley St; Kensington Park; Merton Pl; Fort Avenue Ter; Dalkeith St; Boylston Pl; Bilodeau Rd; Roswell St; Lester St; Blanchard St; Pevear Pl; Dunkeld St; Pickering Ave; Cedar Park; Wheatley Way; Leslie Park; Gouldville Ter; Dalin Pl; Dromey St; Ackley Pl; Rocky Nook Ter; Fenno St; Raynor Cir; Marksdale St; Renfrew Ct; Rock St; Humboldt Ct; Magnolia Pl; Alvah Kittredge Park; Alpine Pl; St James Pl; Emrose Ter; Perth St; St James Ter; Page Ter; Morley St; Fenwick Pl; Montana St; Anita Ter; Cleaves St; Woodrow Wilson Ct; Sojourner Truth Ct; Woodledge St; Rand Pl; Atherton Pl; Cedar Sq; Victor St; Hestia Park; Jess St; Hunneman St; Kensington St; Winslow St; School Street Pl; Oleander St; Mount Pleasant Ter; Copeland Pl; Langford Park; Cardington St; Partridge Pl; Hartford Ter; Ruggles Ct; Oakville Ave; Lebanon St; Orchard Park St; Vine Ave; Howard Pl; Erie Pl; Elmore Park; Dove Ct; Burton Ave; Dunford St; Hartford Ct; Sherwood Ct; N Morton Ln; Quincy Ter; Mahnis Ter; Roucemont Pl; Nathan St; Lewis Pl; Dolans Ct; Centre Street Ter; Holborn Park; Langdon Ter; Hazelwood Ct; Centre Pl; Newman Pl; Hazel Park; Westminster Ter; Creston Park; Miller Park; Readfield Pl; Glenburne St; Maywood Park; Sweetfern Ter; la Grange Pl; Copeland Park; Archer Ter; Kearsarge Ter; Highland Ter; Stanwood Ter; Gary St; Nazing Ct; Rollins Ct; Romar Ter; Mount Pleasant Pl; Cleveland Park; Forest Pl; S Charlame Ter; Hansford Pl; Harold Park; Holborn Ter; Letterfine Ter; Cottage Ct; Academy Ter; S Charlame Ct; Dunreath Ter; Hubbard Ter; Charlame Pl; E Campbell Pl; Danforth Pl; Bonner Ter; Mulvey Ter; Mulberry Pl; Guild Row; Downey Ct; Maple Ct; Maywood Ter; Osgood Ct; Columbia Ter; Harrington Ave; Academy Ct; Obierne Pl; Presby Pl; Quincy Pl; Randlett Pl; Hilton Ter; Forest Hills Dr; Eliot Ter; Walnut Ct; N Charlame Ct; Silva Pl; N Charlame Ter; Regent Sq; Vale Ct; Greenville Park; Akron Pl; Toland Ct; Ruthven Park; Glines Ave; Weaver Ct; John Eliot Sq; Bonnel Ter; Intervale Ter; Circuit Sq; Fairbury St; Chicamauga Park; Kalada Park; Jarvis Pl; Willis Ter; Regent Pl; Dewey Ter; Thornton Pl; Putnam Pl; Hall Ave.
Railroad features: Mbta Commuter Rail; Penn Central RR.
Roxbury neighborhood detailed profile
Sav-mor neighborhood in Boston statistics: (Find on map)
Area: 0.312 square miles
Population: 7,043
Population density:
Median household income in 2021:
Median rent in in 2021:
Male vs Females
Median age
Housing prices:
Average estimated value of detached houses in 2021 (15.9% of all units):
Average estimated value of townhouses or other attached units in 2021 (5.5% of all units):
Average estimated value of housing units in 2-unit structures in 2021 (15.7% of all units):
Average estimated '21 value of housing units in 3-to-4-unit structures (39.1% of all units):
Most popular occupations of males: sales and office occupations (30.5%); service occupations (27.7%); transportation occupations (12.9%); management occupations (except farmers) (5.3%); construction, extraction, and maintenance occupations (4.1%); production occupations (3.7%); community and social services occupations (3.0%)
Most popular occupations of females: service occupations (34.5%); sales and office occupations (15.7%); management occupations (except farmers) (13.9%); healthcare practitioners and technical occupations (10.2%); community and social services occupations (6.2%); education, training, and library occupations (5.3%); business and financial operations occupations (4.0%)
Roads and streets: Blue Hill Ave; Moreland St; Winthrop St; Mount Pleasant Ave; Warren St; Forest St; Waverly St; Clifford St; Copeland St; Whiting St; Maywood St; Perrin St; Edgewood St; Holborn St; Quincy St; Savin St; Montrose St; Elm Hill Park; Dunreath St; Fairland St; Rockville Park; Kearsarge Ave; Southwood St; Gaston St; Greenville St; Otisfield St; Gannett St; Murray Ave; Irwin Ave; Dudley St; Cleveland St; Aspen St; Loyola St; Maybury St; Weldon St; Vine St; Tupelo St; Mount Pleasant Ter; Copeland Pl; Langford Park; Vine Ave; Burton Ave; Quincy Ter; Holborn Park; Hazel Park; Glenburne St; Maywood Park; la Grange Pl; Copeland Park; Kearsarge Ter; Cleveland Park; Forest Pl; Holborn Ter; Dunreath Ter; Maywood Ter; Presby Pl; Quincy Pl; Greenville Park; Kalada Park; Edgewood Park.
Sav-mor neighborhood detailed profile
Area: 0.312 square miles
Population: 7,043
Population density:
| Sav-mor: | 22,609 people per square mile |
| Boston: | 13,511 people per square mile |
Median household income in 2021:
| Sav-mor: | $48,327 |
| Boston: | $79,283 |
Median rent in in 2021:
| Sav-mor: | $1,175 |
| Boston: | $1,696 |
Male vs Females
| Males: | 3,394 |
| Females: | 3,649 |
Median age
| Males: | 30.4 years |
| Females: | 37.0 years |
Housing prices:
Average estimated value of detached houses in 2021 (15.9% of all units):
| Sav-mor: | $1,877,643 |
| Boston: | $683,896 |
Average estimated value of townhouses or other attached units in 2021 (5.5% of all units):
| This neighborhood: | $2,346,992 |
| city: | $1,097,292 |
Average estimated value of housing units in 2-unit structures in 2021 (15.7% of all units):
| This neighborhood: | $710,855 |
| Boston: | $639,493 |
Average estimated '21 value of housing units in 3-to-4-unit structures (39.1% of all units):
| Sav-mor: | $484,810 |
| city: | $745,440 |
Most popular occupations of males: sales and office occupations (30.5%); service occupations (27.7%); transportation occupations (12.9%); management occupations (except farmers) (5.3%); construction, extraction, and maintenance occupations (4.1%); production occupations (3.7%); community and social services occupations (3.0%)
Most popular occupations of females: service occupations (34.5%); sales and office occupations (15.7%); management occupations (except farmers) (13.9%); healthcare practitioners and technical occupations (10.2%); community and social services occupations (6.2%); education, training, and library occupations (5.3%); business and financial operations occupations (4.0%)
Roads and streets: Blue Hill Ave; Moreland St; Winthrop St; Mount Pleasant Ave; Warren St; Forest St; Waverly St; Clifford St; Copeland St; Whiting St; Maywood St; Perrin St; Edgewood St; Holborn St; Quincy St; Savin St; Montrose St; Elm Hill Park; Dunreath St; Fairland St; Rockville Park; Kearsarge Ave; Southwood St; Gaston St; Greenville St; Otisfield St; Gannett St; Murray Ave; Irwin Ave; Dudley St; Cleveland St; Aspen St; Loyola St; Maybury St; Weldon St; Vine St; Tupelo St; Mount Pleasant Ter; Copeland Pl; Langford Park; Vine Ave; Burton Ave; Quincy Ter; Holborn Park; Hazel Park; Glenburne St; Maywood Park; la Grange Pl; Copeland Park; Kearsarge Ter; Cleveland Park; Forest Pl; Holborn Ter; Dunreath Ter; Maywood Ter; Presby Pl; Quincy Pl; Greenville Park; Kalada Park; Edgewood Park.
Sav-mor neighborhood detailed profile
South Boston neighborhood in Boston statistics: (Find on map)
Area: 3.072 square miles
Population: 89,307
Population density:
Median household income in 2021:
Median rent in in 2021:
Male vs Females
Median age
Housing prices:
Average estimated value of detached houses in 2021 (11.8% of all units):
Average estimated value of townhouses or other attached units in 2021 (12.6% of all units):
Average estimated value of housing units in 2-unit structures in 2021 (17.6% of all units):
Average estimated '21 value of housing units in 3-to-4-unit structures (36.5% of all units):
Average estimated '21 value of housing units in 5-or-more-unit structures (7.8% of all units):
Most popular occupations of males: sales and office occupations (26.8%); management occupations (except farmers) (16.4%); business and financial operations occupations (12.4%); computer and mathematical occupations (9.3%); service occupations (9.1%); architecture and engineering occupations (4.5%); construction, extraction, and maintenance occupations (4.0%)
Most popular occupations of females: sales and office occupations (19.2%); management occupations (except farmers) (17.9%); business and financial operations occupations (16.9%); service occupations (10.1%); healthcare practitioners and technical occupations (8.5%); education, training, and library occupations (6.5%); computer and mathematical occupations (5.9%)
Limited-access highways (interstate or state) in this neighborhood: Massachusetts Tpke (I- 90); State Hwy 3 (I- 93, US Hwy 1, Southeast Expy).
Roads and streets: Columbia Rd; William J Day Blvd; N380; Summer St; E 8th St; E Broadway; E 4th St; D St; E 1st St; E 5th St; E 6th St; Old Colony Ave; Dorchester Ave; E St; E 3rd St; B St; Dorchester St; E 7th St; E 2nd St; W Broadway; W 2nd St; Frontage Rd; Northern Ave; Athens St; A St; W 3rd St; C St; Bolton St; W 4th St; Dry Dock Ave; Silver St; Widett Cir; Emerson St; K St; W 1st St; N118; Fid Kennedy Ave; O St; Seaport Blvd (Northern Ave); Cypher St; L St; W 7th St; M St; F St; Marine Rd; Black Falcon Ave; Fargo St; I St; Gold St; H St; Thomas Park; W 5th St; N St; Bullock St; G St; Southampton St; W 6th St; P St; Msgr O'Callaghan Way; Sleeper St; W 8th St; Bowen St; Farragut Rd; Tudor St; Joyce Hayes Way; Dalessio Ct; Mercer St; Dresser St; Granite St; Old Harbor St; W 9th St; Devine Way; Preble St; Harbor St; Crowley Rogers Way; Flaherty Way; Orton Marotta Way; Channel St; Baxter St; Damrell St; Gillette Park; Telegraph St; Viaduct St; Alger St; Logan Way; Foundry St; Patterson Way; Boston Fish Pier; Congress St; Ellery St; Midway St; Foodmart Rd; Middle St; Gates St; Trilling Way; Binford St; Murray Way; Story St; Rev Richard A Burke St (Burke St); Necco St; E 9th St; Richards St; Tide St; Ewer St; Vinton St; Gavin Way; Woodward St; Melcher St; Ward St; Pittsburgh St; Columbia Rd Rotary; Necco Ct; Farnsworth St; Thomson Pl (Stillings St); Power House St; Swallow St; Elkins St; Fish Pier Rd; Oconnor Way; Butler St; Baldwin St; Dolphin Way; Inman St; Rogers St; Claflin St; Sterling Sq; Wormwood St; Jenkins St; Baldwin Pl; Mitchell St; National St; Pilsudski Way; Colebrook St; Access Rd; Leeds St; Gustin St; Boston St; Kemp St; McDonough Way; Louis St; Tuckerman St; Covington St; Humboldt Pl; Dexter St; Grimes St; Loring St; Dixfield St; Frederick St; Goodwin Ct; Carmody Ct; Mt Washington Ave; Lark St; Greenbaum St; N113; Darius Ct; Seaport Ln; Ticknor St; Bantry Way; New Broadway Brg; Trimount Pl; Linden St; Atlantic St; Cottage St; Father Songin Way; Kemble Pl; Sherman Ct; Ward Ct; Milhender Pl; Pacific St; Knowlton St; Capstan Way; Deady Ln; Lennon Ct; Ballard Way; Anchor Way; Carpenter St; Winfield St; Hatch St; Broadway; Sanger St; Courthouse Way; Hamlin St; Acadia St; Brewster St; Hart Pl; Douglas St; Springer St; Vicksburg St; Twomey Ct; Peters St; Monks St; Emmet St; Burrill Pl; Hardy St; Design Center Pl; Andrew Sq; Beckler Ave; Yard Way; Butland Ct; Mohawk St; Newhill Pl; Glover Ct; Earl St; Wendeller St; N124; Wadleigh Pl; H Street Pl; Wrights Ct; Payson Ct; Lawrence Ct; M Street Pl; Church Ave; Calvin Pl; Gifford Pl; Pulaski Ave; Dyer Ave; 3rd Pl; Bell Ct; Linley Ter; Ross Pl; Barrett Ave; O Street Pl; Locke Pl; Mount Washington Pl; Jason Ter; Mount Washington Ave; Paige Ave; Dean Way; Lilly St; Transit St; Balmoral Park; Liberty Pl; Lovis St; Burnham Pl; Washington Pl; Bernard Pl; Plummer Pl; Lauten Pl; Flint Pl; K Street Pl; Minnie Ct; Schrepel Pl; Barnard Pl; Viking St; Scott Pl; Leonard Pl; City Point Ct; Doolin Pl; Norcross Pl; Bay State Pl; Cutler Ct; Webb Park; Woodward Pl; Wendell Pl; Hall Pl; Sayward Pl; 4th Street Pl; Necco Pl.
Railroad features: Penn Central RR.
South Boston neighborhood detailed profile
Area: 3.072 square miles
Population: 89,307
Population density:
| South Boston: | 29,071 people per square mile |
| Boston: | 13,511 people per square mile |
Median household income in 2021:
| South Boston: | $117,895 |
| Boston: | $79,283 |
Median rent in in 2021:
| South Boston: | $2,168 |
| Boston: | $1,696 |
Male vs Females
| Males: | 42,059 |
| Females: | 47,247 |
Median age
| Males: | 31.0 years |
| Females: | 35.0 years |
Housing prices:
Average estimated value of detached houses in 2021 (11.8% of all units):
| South Boston: | $654,993 |
| Boston: | $683,896 |
Average estimated value of townhouses or other attached units in 2021 (12.6% of all units):
| This neighborhood: | $623,966 |
| city: | $1,097,292 |
Average estimated value of housing units in 2-unit structures in 2021 (17.6% of all units):
| This neighborhood: | $709,335 |
| Boston: | $639,493 |
Average estimated '21 value of housing units in 3-to-4-unit structures (36.5% of all units):
| South Boston: | $579,806 |
| city: | $745,440 |
Average estimated '21 value of housing units in 5-or-more-unit structures (7.8% of all units):
| South Boston: | $620,159 |
| Boston: | $986,433 |
Most popular occupations of males: sales and office occupations (26.8%); management occupations (except farmers) (16.4%); business and financial operations occupations (12.4%); computer and mathematical occupations (9.3%); service occupations (9.1%); architecture and engineering occupations (4.5%); construction, extraction, and maintenance occupations (4.0%)
Most popular occupations of females: sales and office occupations (19.2%); management occupations (except farmers) (17.9%); business and financial operations occupations (16.9%); service occupations (10.1%); healthcare practitioners and technical occupations (8.5%); education, training, and library occupations (6.5%); computer and mathematical occupations (5.9%)
Limited-access highways (interstate or state) in this neighborhood: Massachusetts Tpke (I- 90); State Hwy 3 (I- 93, US Hwy 1, Southeast Expy).
Roads and streets: Columbia Rd; William J Day Blvd; N380; Summer St; E 8th St; E Broadway; E 4th St; D St; E 1st St; E 5th St; E 6th St; Old Colony Ave; Dorchester Ave; E St; E 3rd St; B St; Dorchester St; E 7th St; E 2nd St; W Broadway; W 2nd St; Frontage Rd; Northern Ave; Athens St; A St; W 3rd St; C St; Bolton St; W 4th St; Dry Dock Ave; Silver St; Widett Cir; Emerson St; K St; W 1st St; N118; Fid Kennedy Ave; O St; Seaport Blvd (Northern Ave); Cypher St; L St; W 7th St; M St; F St; Marine Rd; Black Falcon Ave; Fargo St; I St; Gold St; H St; Thomas Park; W 5th St; N St; Bullock St; G St; Southampton St; W 6th St; P St; Msgr O'Callaghan Way; Sleeper St; W 8th St; Bowen St; Farragut Rd; Tudor St; Joyce Hayes Way; Dalessio Ct; Mercer St; Dresser St; Granite St; Old Harbor St; W 9th St; Devine Way; Preble St; Harbor St; Crowley Rogers Way; Flaherty Way; Orton Marotta Way; Channel St; Baxter St; Damrell St; Gillette Park; Telegraph St; Viaduct St; Alger St; Logan Way; Foundry St; Patterson Way; Boston Fish Pier; Congress St; Ellery St; Midway St; Foodmart Rd; Middle St; Gates St; Trilling Way; Binford St; Murray Way; Story St; Rev Richard A Burke St (Burke St); Necco St; E 9th St; Richards St; Tide St; Ewer St; Vinton St; Gavin Way; Woodward St; Melcher St; Ward St; Pittsburgh St; Columbia Rd Rotary; Necco Ct; Farnsworth St; Thomson Pl (Stillings St); Power House St; Swallow St; Elkins St; Fish Pier Rd; Oconnor Way; Butler St; Baldwin St; Dolphin Way; Inman St; Rogers St; Claflin St; Sterling Sq; Wormwood St; Jenkins St; Baldwin Pl; Mitchell St; National St; Pilsudski Way; Colebrook St; Access Rd; Leeds St; Gustin St; Boston St; Kemp St; McDonough Way; Louis St; Tuckerman St; Covington St; Humboldt Pl; Dexter St; Grimes St; Loring St; Dixfield St; Frederick St; Goodwin Ct; Carmody Ct; Mt Washington Ave; Lark St; Greenbaum St; N113; Darius Ct; Seaport Ln; Ticknor St; Bantry Way; New Broadway Brg; Trimount Pl; Linden St; Atlantic St; Cottage St; Father Songin Way; Kemble Pl; Sherman Ct; Ward Ct; Milhender Pl; Pacific St; Knowlton St; Capstan Way; Deady Ln; Lennon Ct; Ballard Way; Anchor Way; Carpenter St; Winfield St; Hatch St; Broadway; Sanger St; Courthouse Way; Hamlin St; Acadia St; Brewster St; Hart Pl; Douglas St; Springer St; Vicksburg St; Twomey Ct; Peters St; Monks St; Emmet St; Burrill Pl; Hardy St; Design Center Pl; Andrew Sq; Beckler Ave; Yard Way; Butland Ct; Mohawk St; Newhill Pl; Glover Ct; Earl St; Wendeller St; N124; Wadleigh Pl; H Street Pl; Wrights Ct; Payson Ct; Lawrence Ct; M Street Pl; Church Ave; Calvin Pl; Gifford Pl; Pulaski Ave; Dyer Ave; 3rd Pl; Bell Ct; Linley Ter; Ross Pl; Barrett Ave; O Street Pl; Locke Pl; Mount Washington Pl; Jason Ter; Mount Washington Ave; Paige Ave; Dean Way; Lilly St; Transit St; Balmoral Park; Liberty Pl; Lovis St; Burnham Pl; Washington Pl; Bernard Pl; Plummer Pl; Lauten Pl; Flint Pl; K Street Pl; Minnie Ct; Schrepel Pl; Barnard Pl; Viking St; Scott Pl; Leonard Pl; City Point Ct; Doolin Pl; Norcross Pl; Bay State Pl; Cutler Ct; Webb Park; Woodward Pl; Wendell Pl; Hall Pl; Sayward Pl; 4th Street Pl; Necco Pl.
Railroad features: Penn Central RR.
South Boston neighborhood detailed profile
South End neighborhood in Boston statistics: (Find on map)
Area: 1.034 square miles
Population: 37,366
Population density:
Median household income in 2021:
Median rent in in 2021:
Male vs Females
Median age
Housing prices:
Average estimated value of detached houses in 2021 (8.2% of all units):
Average estimated value of townhouses or other attached units in 2021 (11.7% of all units):
Average estimated value of housing units in 2-unit structures in 2021 (6.6% of all units):
Average estimated '21 value of housing units in 3-to-4-unit structures (42.6% of all units):
Average estimated '21 value of housing units in 5-or-more-unit structures (17.6% of all units):
Most popular occupations of males: management occupations (except farmers) (16.0%); business and financial operations occupations (16.0%); sales and office occupations (14.5%); service occupations (12.2%); healthcare practitioners and technical occupations (9.9%); computer and mathematical occupations (9.3%); legal occupations (5.5%)
Most popular occupations of females: management occupations (except farmers) (19.9%); sales and office occupations (18.5%); business and financial operations occupations (14.7%); healthcare practitioners and technical occupations (11.5%); service occupations (11.1%); education, training, and library occupations (8.5%); arts, design, entertainment, sports, and media occupations (4.1%)
Limited-access highways (interstate or state) in this neighborhood: General Pulaski Skwy (State Hwy 3, US Hwy 1, John F Fitzgerald Expy, I- 93).
Highways in this neighborhood: State Hwy 28 (Tremont St); State Hwy 28 (Columbus Ave).
Roads and streets: Melnea Cass Blvd; Washington St; Shawmut Ave; Albany St; Harrison Ave; Massachusetts Ave; General Pulaski Skwy; Northampton St; W Newton St; E Berkeley St; Warren Ave; Appleton St; Camden St; Newland St; W Canton St; Worcester St; W Springfield St; N433; Union Park St; W Brookline St; Waltham St; Chandler St; Lenox St; Dartmouth St; E Concord St; E Newton St; E Brookline St; Lawrence St; Mystic St; W Concord St; Rutland St; Thorn St; Clarendon St; Worcester Sq; Reed St; Traveler St; Herald St; Hammond St; W Dedham St; Montgomery St; E Lenox St; Yarmouth St; Millicent Way; Kendall St; Pembroke St; San Juan St; Carleton St; Father Francis Gilday St (Saint George St); Randolph St; Malden St; Windsor St; Union Park; Emerald Ct; Sharon St; Dwight St; Plympton St; E Dedham St; E Canton St; Rutland Sq; Fellows St; Claremont St; Thayer St; Milford St; Wareham St; E Springfield St; Concord Sq; Village Ct; Stoughton St; Paul Sullivan Way; Upton St; Newcomb St; Hanson St; Gray St; Thorndike St; Monsignor Reynolds Way; Randall St; Bradford St; Berkeley St; Paul Pl; Newland Pl; Trask St; W Rutland Sq; Warwick St; Dartmouth Pl; Alley 516; Yarmouth Pl; W Haven St; Al St; Holyoke St; Massachusetts Ave (Chester Sq); Braddock Park; Greenwich Park; Wellington St; Claremont Park; Aguadilla St; Trotter Ct; Ruggles St; Concord Pl; Newcastle Ct; Douglas Park; Boriken St; Greenwich St; Watson St; Laconia St; Waterford St; Savoy St; Perry St; Castle Ct; William E Mullins Way; Davenport St; Westminster St; Groton St; Orange Ct; Benton St; Rollins St; Pelham St; Burke St; Comet Pl; Sussex St; Hampden St; Haven St; Fay St; Draper's Ln; Coventry St; Lattimore Ct; Cunard St; St Cyprians Pl; W Warren Ave; Ivanhoe St; Branwin Harris Way; Dilworth St; Pike St; Northampton Pl; Aquadilla St; Connolly St; Parmelee St; Lincoln Pl; Andrews St; Deacon St; Andrews Pl; Cumston St; Cazenove St; Ringgold St; Bond St; James St; Deblois St; Ditmus Ct; Wheatley Way; St Charles St; Taylor St; Bethune Way; Island St; W Andrews Pl; Canton Pl; Clout St; Pelham Ter; Cumston Pl; Savoy Pl; Northfield St; Leland Pl; Boston Medical Center Pl; Harrison Archway; Gage St; Greenwich Ct; W Malden St.
Railroad features: Mbta Commuter Rail (Mbta Orange Line RR, Amtrak RR).
South End neighborhood detailed profile
Area: 1.034 square miles
Population: 37,366
Population density:
| South End: | 36,138 people per square mile |
| Boston: | 13,511 people per square mile |
Median household income in 2021:
| South End: | $104,919 |
| Boston: | $79,283 |
Median rent in in 2021:
| South End: | $2,388 |
| Boston: | $1,696 |
Male vs Females
| Males: | 18,924 |
| Females: | 18,442 |
Median age
| Males: | 36.6 years |
| Females: | 36.4 years |
Housing prices:
Average estimated value of detached houses in 2021 (8.2% of all units):
| South End: | $418,314 |
| Boston: | $683,896 |
Average estimated value of townhouses or other attached units in 2021 (11.7% of all units):
| This neighborhood: | $4,161,397 |
| city: | $1,097,292 |
Average estimated value of housing units in 2-unit structures in 2021 (6.6% of all units):
| This neighborhood: | $2,760,000 |
| Boston: | $639,493 |
Average estimated '21 value of housing units in 3-to-4-unit structures (42.6% of all units):
| South End: | $1,285,496 |
| city: | $745,440 |
Average estimated '21 value of housing units in 5-or-more-unit structures (17.6% of all units):
| South End: | $541,116 |
| Boston: | $986,433 |
Most popular occupations of males: management occupations (except farmers) (16.0%); business and financial operations occupations (16.0%); sales and office occupations (14.5%); service occupations (12.2%); healthcare practitioners and technical occupations (9.9%); computer and mathematical occupations (9.3%); legal occupations (5.5%)
Most popular occupations of females: management occupations (except farmers) (19.9%); sales and office occupations (18.5%); business and financial operations occupations (14.7%); healthcare practitioners and technical occupations (11.5%); service occupations (11.1%); education, training, and library occupations (8.5%); arts, design, entertainment, sports, and media occupations (4.1%)
Limited-access highways (interstate or state) in this neighborhood: General Pulaski Skwy (State Hwy 3, US Hwy 1, John F Fitzgerald Expy, I- 93).
Highways in this neighborhood: State Hwy 28 (Tremont St); State Hwy 28 (Columbus Ave).
Roads and streets: Melnea Cass Blvd; Washington St; Shawmut Ave; Albany St; Harrison Ave; Massachusetts Ave; General Pulaski Skwy; Northampton St; W Newton St; E Berkeley St; Warren Ave; Appleton St; Camden St; Newland St; W Canton St; Worcester St; W Springfield St; N433; Union Park St; W Brookline St; Waltham St; Chandler St; Lenox St; Dartmouth St; E Concord St; E Newton St; E Brookline St; Lawrence St; Mystic St; W Concord St; Rutland St; Thorn St; Clarendon St; Worcester Sq; Reed St; Traveler St; Herald St; Hammond St; W Dedham St; Montgomery St; E Lenox St; Yarmouth St; Millicent Way; Kendall St; Pembroke St; San Juan St; Carleton St; Father Francis Gilday St (Saint George St); Randolph St; Malden St; Windsor St; Union Park; Emerald Ct; Sharon St; Dwight St; Plympton St; E Dedham St; E Canton St; Rutland Sq; Fellows St; Claremont St; Thayer St; Milford St; Wareham St; E Springfield St; Concord Sq; Village Ct; Stoughton St; Paul Sullivan Way; Upton St; Newcomb St; Hanson St; Gray St; Thorndike St; Monsignor Reynolds Way; Randall St; Bradford St; Berkeley St; Paul Pl; Newland Pl; Trask St; W Rutland Sq; Warwick St; Dartmouth Pl; Alley 516; Yarmouth Pl; W Haven St; Al St; Holyoke St; Massachusetts Ave (Chester Sq); Braddock Park; Greenwich Park; Wellington St; Claremont Park; Aguadilla St; Trotter Ct; Ruggles St; Concord Pl; Newcastle Ct; Douglas Park; Boriken St; Greenwich St; Watson St; Laconia St; Waterford St; Savoy St; Perry St; Castle Ct; William E Mullins Way; Davenport St; Westminster St; Groton St; Orange Ct; Benton St; Rollins St; Pelham St; Burke St; Comet Pl; Sussex St; Hampden St; Haven St; Fay St; Draper's Ln; Coventry St; Lattimore Ct; Cunard St; St Cyprians Pl; W Warren Ave; Ivanhoe St; Branwin Harris Way; Dilworth St; Pike St; Northampton Pl; Aquadilla St; Connolly St; Parmelee St; Lincoln Pl; Andrews St; Deacon St; Andrews Pl; Cumston St; Cazenove St; Ringgold St; Bond St; James St; Deblois St; Ditmus Ct; Wheatley Way; St Charles St; Taylor St; Bethune Way; Island St; W Andrews Pl; Canton Pl; Clout St; Pelham Ter; Cumston Pl; Savoy Pl; Northfield St; Leland Pl; Boston Medical Center Pl; Harrison Archway; Gage St; Greenwich Ct; W Malden St.
Railroad features: Mbta Commuter Rail (Mbta Orange Line RR, Amtrak RR).
South End neighborhood detailed profile
St. Marks neighborhood in Boston statistics: (Find on map)
Area: 0.366 square miles
Population: 9,581
Population density:
Median household income in 2021:
Median rent in in 2021:
Male vs Females
Median age
Housing prices:
Average estimated value of detached houses in 2021 (18.6% of all units):
Average estimated value of townhouses or other attached units in 2021 (2.9% of all units):
Average estimated value of housing units in 2-unit structures in 2021 (17.3% of all units):
Average estimated '21 value of housing units in 3-to-4-unit structures (27.8% of all units):
Average estimated '21 value of housing units in 5-or-more-unit structures (45.0% of all units):
Most popular occupations of males: service occupations (22.9%); sales and office occupations (19.1%); farming, fishing, and forestry occupations (13.3%); management occupations (except farmers) (10.8%); production occupations (6.8%); transportation occupations (6.8%); education, training, and library occupations (5.0%)
Most popular occupations of females: service occupations (30.1%); sales and office occupations (21.4%); education, training, and library occupations (12.2%); management occupations (except farmers) (9.3%); arts, design, entertainment, sports, and media occupations (6.5%); transportation occupations (6.5%); healthcare practitioners and technical occupations (5.5%)
Roads and streets: Centre St; Dorchester Ave; Wrentham St; Welles Ave; Msgr Patrick J Lydon Way; Lonsdale St; St Marks Rd; Whitten St; King St; Dix St; Adams St; Mather St; Edwin St; Florida St; Shepton St; Talbot Ave; Mallet St; Semont Rd; Brent St; Lithgow St; Samoset St; Melbourne St; Wainwright St; Kenwood St; Glenrose Rd; Moultrie St; Roseland St; Nixon St; Centre Ave; Endicott Ter; Cheverus Rd; Seaborn St; Allston St; Clementine Park; Leslie St; Santuit St; Lafield St; Sharp St; Banton St; Argyle St; Mather Ct; Remington St; Althea St; Clematis St; Redwood St; Joseph St; Victory Rd; Dawson St; Templeton Way; Tilman St; Elm Lawn St; Dayton St; Argyle Ter; Denvir St; O Donnell Ter; Carlotta St; Centre Ct; Ginita St; Adams Ter; Centre Pl.
Railroad features: Ashmont Train (Mbta Red Line RR).
St. Marks neighborhood detailed profile
Area: 0.366 square miles
Population: 9,581
Population density:
| St. Marks: | 26,182 people per square mile |
| Boston: | 13,511 people per square mile |
Median household income in 2021:
| St. Marks: | $89,801 |
| Boston: | $79,283 |
Median rent in in 2021:
| St. Marks: | $1,403 |
| Boston: | $1,696 |
Male vs Females
| Males: | 4,441 |
| Females: | 5,140 |
Median age
| Males: | 39.1 years |
| Females: | 41.4 years |
Housing prices:
Average estimated value of detached houses in 2021 (18.6% of all units):
| St. Marks: | $940,789 |
| Boston: | $683,896 |
Average estimated value of townhouses or other attached units in 2021 (2.9% of all units):
| This neighborhood: | $276,735 |
| city: | $1,097,292 |
Average estimated value of housing units in 2-unit structures in 2021 (17.3% of all units):
| This neighborhood: | $466,991 |
| Boston: | $639,493 |
Average estimated '21 value of housing units in 3-to-4-unit structures (27.8% of all units):
| St. Marks: | $848,125 |
| city: | $745,440 |
Average estimated '21 value of housing units in 5-or-more-unit structures (45.0% of all units):
| St. Marks: | $556,800 |
| Boston: | $986,433 |
Most popular occupations of males: service occupations (22.9%); sales and office occupations (19.1%); farming, fishing, and forestry occupations (13.3%); management occupations (except farmers) (10.8%); production occupations (6.8%); transportation occupations (6.8%); education, training, and library occupations (5.0%)
Most popular occupations of females: service occupations (30.1%); sales and office occupations (21.4%); education, training, and library occupations (12.2%); management occupations (except farmers) (9.3%); arts, design, entertainment, sports, and media occupations (6.5%); transportation occupations (6.5%); healthcare practitioners and technical occupations (5.5%)
Roads and streets: Centre St; Dorchester Ave; Wrentham St; Welles Ave; Msgr Patrick J Lydon Way; Lonsdale St; St Marks Rd; Whitten St; King St; Dix St; Adams St; Mather St; Edwin St; Florida St; Shepton St; Talbot Ave; Mallet St; Semont Rd; Brent St; Lithgow St; Samoset St; Melbourne St; Wainwright St; Kenwood St; Glenrose Rd; Moultrie St; Roseland St; Nixon St; Centre Ave; Endicott Ter; Cheverus Rd; Seaborn St; Allston St; Clementine Park; Leslie St; Santuit St; Lafield St; Sharp St; Banton St; Argyle St; Mather Ct; Remington St; Althea St; Clematis St; Redwood St; Joseph St; Victory Rd; Dawson St; Templeton Way; Tilman St; Elm Lawn St; Dayton St; Argyle Ter; Denvir St; O Donnell Ter; Carlotta St; Centre Ct; Ginita St; Adams Ter; Centre Pl.
Railroad features: Ashmont Train (Mbta Red Line RR).
St. Marks neighborhood detailed profile
Telegraph Hill neighborhood in Boston statistics: (Find on map)
Area: 0.264 square miles
Population: 6,441
Population density:
Median household income in 2021:
Median rent in in 2021:
Male vs Females
Median age
Housing prices:
Average estimated value of detached houses in 2021 (10.4% of all units):
Average estimated value of townhouses or other attached units in 2021 (11.8% of all units):
Average estimated value of housing units in 2-unit structures in 2021 (33.5% of all units):
Average estimated '21 value of housing units in 3-to-4-unit structures (36.3% of all units):
Average estimated '21 value of housing units in 5-or-more-unit structures (15.2% of all units):
Most popular occupations of males: sales and office occupations (29.6%); management occupations (except farmers) (18.5%); business and financial operations occupations (10.1%); computer and mathematical occupations (8.8%); legal occupations (8.4%); education, training, and library occupations (7.2%); life, physical, and social science occupations (5.1%)
Most popular occupations of females: management occupations (except farmers) (26.6%); business and financial operations occupations (16.3%); sales and office occupations (14.1%); education, training, and library occupations (10.7%); healthcare practitioners and technical occupations (9.8%); computer and mathematical occupations (5.1%); material moving occupations (4.8%)
Roads and streets: E 4th St; E 5th St; E 6th St; E 8th St; William J Day Blvd; Columbia Rd; E 7th St; Thomas Park; K St; G St; I St; Marine Rd; H St; Emerson St; Story St; L St; Colebrook St; Ticknor St; Linden St; Atlantic St; Pacific St; Deady Ln; Winfield St; Hatch St; Sanger St; Hamlin St; Brewster St; Hart Pl; Douglas St; Springer St; M St; Burrill Pl; Beckler Ave; M Street Pl; Locke Pl; Mount Washington Pl; Jason Ter; Paige Ave; Minnie Ct; Norcross Pl; Cutler Ct; Webb Park; Hall Pl; 4th Street Pl; Henderson Ave.
Telegraph Hill neighborhood detailed profile
Area: 0.264 square miles
Population: 6,441
Population density:
| Telegraph Hill: | 24,406 people per square mile |
| Boston: | 13,511 people per square mile |
Median household income in 2021:
| Telegraph Hill: | $162,513 |
| Boston: | $79,283 |
Median rent in in 2021:
| Telegraph Hill: | $2,456 |
| Boston: | $1,696 |
Male vs Females
| Males: | 3,273 |
| Females: | 3,168 |
Median age
| Males: | 29.7 years |
| Females: | 31.9 years |
Housing prices:
Average estimated value of detached houses in 2021 (10.4% of all units):
| Telegraph Hill: | $379,790 |
| Boston: | $683,896 |
Average estimated value of townhouses or other attached units in 2021 (11.8% of all units):
| This neighborhood: | $474,806 |
| city: | $1,097,292 |
Average estimated value of housing units in 2-unit structures in 2021 (33.5% of all units):
| This neighborhood: | $438,404 |
| Boston: | $639,493 |
Average estimated '21 value of housing units in 3-to-4-unit structures (36.3% of all units):
| Telegraph Hill: | $116,038 |
| city: | $745,440 |
Average estimated '21 value of housing units in 5-or-more-unit structures (15.2% of all units):
| Telegraph Hill: | $219,849 |
| Boston: | $986,433 |
Most popular occupations of males: sales and office occupations (29.6%); management occupations (except farmers) (18.5%); business and financial operations occupations (10.1%); computer and mathematical occupations (8.8%); legal occupations (8.4%); education, training, and library occupations (7.2%); life, physical, and social science occupations (5.1%)
Most popular occupations of females: management occupations (except farmers) (26.6%); business and financial operations occupations (16.3%); sales and office occupations (14.1%); education, training, and library occupations (10.7%); healthcare practitioners and technical occupations (9.8%); computer and mathematical occupations (5.1%); material moving occupations (4.8%)
Roads and streets: E 4th St; E 5th St; E 6th St; E 8th St; William J Day Blvd; Columbia Rd; E 7th St; Thomas Park; K St; G St; I St; Marine Rd; H St; Emerson St; Story St; L St; Colebrook St; Ticknor St; Linden St; Atlantic St; Pacific St; Deady Ln; Winfield St; Hatch St; Sanger St; Hamlin St; Brewster St; Hart Pl; Douglas St; Springer St; M St; Burrill Pl; Beckler Ave; M Street Pl; Locke Pl; Mount Washington Pl; Jason Ter; Paige Ave; Minnie Ct; Norcross Pl; Cutler Ct; Webb Park; Hall Pl; 4th Street Pl; Henderson Ave.
Telegraph Hill neighborhood detailed profile
Theatre District neighborhood in Boston statistics: (Find on map)
Area: 0.030 square miles
Roads and streets: Tremont St; Boylston St; Stuart St; Charles St S; Warrenton St; Seaver Pl; Warrenton Pl; Lyndeboro Pl; Eliot St.
Theatre District neighborhood detailed profile
Area: 0.030 square miles
Roads and streets: Tremont St; Boylston St; Stuart St; Charles St S; Warrenton St; Seaver Pl; Warrenton Pl; Lyndeboro Pl; Eliot St.
Theatre District neighborhood detailed profile
Uphams Corner neighborhood in Boston statistics: (Find on map)
Area: 0.448 square miles
Population: 12,144
Population density:
Median household income in 2021:
Median rent in in 2021:
Male vs Females
Median age
Housing prices:
Average estimated value of detached houses in 2021 (9.1% of all units):
Average estimated value of townhouses or other attached units in 2021 (6.7% of all units):
Average estimated value of housing units in 2-unit structures in 2021 (18.1% of all units):
Average estimated '21 value of housing units in 3-to-4-unit structures (46.6% of all units):
Average estimated '21 value of housing units in 5-or-more-unit structures (6.9% of all units):
Most popular occupations of males: service occupations (24.6%); sales and office occupations (19.9%); transportation occupations (9.8%); management occupations (except farmers) (7.5%); business and financial operations occupations (5.8%); education, training, and library occupations (4.8%); construction, extraction, and maintenance occupations (4.6%)
Most popular occupations of females: sales and office occupations (28.0%); service occupations (23.7%); management occupations (except farmers) (11.6%); healthcare practitioners and technical occupations (6.9%); education, training, and library occupations (6.4%); community and social services occupations (5.9%); business and financial operations occupations (4.8%)
Roads and streets: Columbia Rd; Hancock St; Cushing Ave; Sawyer Ave; Pleasant St; Quincy St; Stoughton St; Bowdoin St; Church St; Bird St; Glendale St; Sumner St; Monadnock St; Virginia St; Belden St; Downer Ave; Humphreys St; Dudley St; East St; Elder St; Trull St; Bakersfield St; Bellevue St; Willis St; Wendover St; Jerome St; Windermere Rd; Winter St; Salcombe St; Payson Ave; Rill St; Howe St; Upham Ave; Eastman St; Hendry St; Bodwell St; Cameron St; Annabel St; Fernald Ter; Rowell St; Fifield St; Peverell St; Baker Ave; Everett Ave; Mayfield St; High St; Hinckley St; Morrill St; Hamlet St; Trescott St; Sayward St; Holden St; Arion St; Glen St; Drayton Ave; Davern Ave; Ware St; Ramsey St; Ronan St; Stanley St; Gene St; Annapolis St; Downer Ct; Mount Cushing Ter; Groom St; Nonquit St; Dewolf St; Cawfield St; Wilbur St; Clarkson St; Whitby Ter; Coleman St; Parish St; Humphreys Pl; Quincefield St; Cedar Pl; Hillsboro St; Navillus Ter; Dawes St; Conrad St; Wheelock Ave; Whittemore Ter; Hesston Ter; Trent St; Howe Ter; Sumner Park; Harrow St; Stoughton Ter; Tovar St; Sumner Ter; Kevin Rd; Alvan Ter; Sumner Sq; Columbia Pl; Thatcher Ter; Adams St; Glover Pl; Dudley Ter; Stoughton Street Pl; E Cottage St; Dawes Ter; Quincefield Pl; Philips Pl; Fruean Pl; Beckwith St; Uphams Ct; Belden Sq.
Uphams Corner neighborhood detailed profile
Area: 0.448 square miles
Population: 12,144
Population density:
| Uphams Corner (Jones Hill): | 27,129 people per square mile |
| Boston: | 13,511 people per square mile |
Median household income in 2021:
| Uphams Corner (Jones Hill): | $59,091 |
| Boston: | $79,283 |
Median rent in in 2021:
| Uphams Corner (Jones Hill): | $1,140 |
| Boston: | $1,696 |
Male vs Females
| Males: | 6,005 |
| Females: | 6,139 |
Median age
| Males: | 35.4 years |
| Females: | 36.9 years |
Housing prices:
Average estimated value of detached houses in 2021 (9.1% of all units):
| Uphams Corner (Jones Hill): | $658,021 |
| Boston: | $683,896 |
Average estimated value of townhouses or other attached units in 2021 (6.7% of all units):
| This neighborhood: | $307,267 |
| city: | $1,097,292 |
Average estimated value of housing units in 2-unit structures in 2021 (18.1% of all units):
| This neighborhood: | $520,328 |
| Boston: | $639,493 |
Average estimated '21 value of housing units in 3-to-4-unit structures (46.6% of all units):
| Uphams Corner (Jones Hill): | $610,207 |
| city: | $745,440 |
Average estimated '21 value of housing units in 5-or-more-unit structures (6.9% of all units):
| Uphams Corner (Jones Hill): | $417,226 |
| Boston: | $986,433 |
Most popular occupations of males: service occupations (24.6%); sales and office occupations (19.9%); transportation occupations (9.8%); management occupations (except farmers) (7.5%); business and financial operations occupations (5.8%); education, training, and library occupations (4.8%); construction, extraction, and maintenance occupations (4.6%)
Most popular occupations of females: sales and office occupations (28.0%); service occupations (23.7%); management occupations (except farmers) (11.6%); healthcare practitioners and technical occupations (6.9%); education, training, and library occupations (6.4%); community and social services occupations (5.9%); business and financial operations occupations (4.8%)
Roads and streets: Columbia Rd; Hancock St; Cushing Ave; Sawyer Ave; Pleasant St; Quincy St; Stoughton St; Bowdoin St; Church St; Bird St; Glendale St; Sumner St; Monadnock St; Virginia St; Belden St; Downer Ave; Humphreys St; Dudley St; East St; Elder St; Trull St; Bakersfield St; Bellevue St; Willis St; Wendover St; Jerome St; Windermere Rd; Winter St; Salcombe St; Payson Ave; Rill St; Howe St; Upham Ave; Eastman St; Hendry St; Bodwell St; Cameron St; Annabel St; Fernald Ter; Rowell St; Fifield St; Peverell St; Baker Ave; Everett Ave; Mayfield St; High St; Hinckley St; Morrill St; Hamlet St; Trescott St; Sayward St; Holden St; Arion St; Glen St; Drayton Ave; Davern Ave; Ware St; Ramsey St; Ronan St; Stanley St; Gene St; Annapolis St; Downer Ct; Mount Cushing Ter; Groom St; Nonquit St; Dewolf St; Cawfield St; Wilbur St; Clarkson St; Whitby Ter; Coleman St; Parish St; Humphreys Pl; Quincefield St; Cedar Pl; Hillsboro St; Navillus Ter; Dawes St; Conrad St; Wheelock Ave; Whittemore Ter; Hesston Ter; Trent St; Howe Ter; Sumner Park; Harrow St; Stoughton Ter; Tovar St; Sumner Ter; Kevin Rd; Alvan Ter; Sumner Sq; Columbia Pl; Thatcher Ter; Adams St; Glover Pl; Dudley Ter; Stoughton Street Pl; E Cottage St; Dawes Ter; Quincefield Pl; Philips Pl; Fruean Pl; Beckwith St; Uphams Ct; Belden Sq.
Uphams Corner neighborhood detailed profile
Washington Park neighborhood in Boston statistics: (Find on map)
Area: 0.815 square miles
Population: 19,978
Population density:
Median household income in 2021:
Median rent in in 2021:
Male vs Females
Median age
Housing prices:
Average estimated value of detached houses in 2021 (11.5% of all units):
Average estimated value of townhouses or other attached units in 2021 (16.3% of all units):
Average estimated value of housing units in 2-unit structures in 2021 (17.1% of all units):
Average estimated '21 value of housing units in 3-to-4-unit structures (23.7% of all units):
Average estimated '21 value of housing units in 5-or-more-unit structures (16.6% of all units):
Most popular occupations of males: service occupations (17.7%); sales and office occupations (17.5%); transportation occupations (13.5%); construction, extraction, and maintenance occupations (9.3%); community and social services occupations (6.3%); education, training, and library occupations (6.1%); computer and mathematical occupations (6.0%)
Most popular occupations of females: service occupations (32.7%); sales and office occupations (23.0%); education, training, and library occupations (8.0%); computer and mathematical occupations (7.9%); business and financial operations occupations (7.1%); management occupations (except farmers) (6.5%); healthcare practitioners and technical occupations (3.8%)
Highways in this neighborhood: State Hwy 28 (Seaver St); State Hwy 28 (Columbus Ave).
Roads and streets: Warren St; Martin Luther King Blvd; Walnut Ave; Humboldt Ave; Townsend St; Crawford St; Harold St; Waumbeck St; Howland St; Ruthven St; Homestead St; Elm Hill Ave; Dale St; Blue Hill Ave; Regent St; Hutchings St; Washington St; Harrishof St; Rockland St; Circuit St; Maple St; Walnut Park; Munroe St; Cheney St; Schuyler St; St James St; Georgia St; Wyoming St; Westminster Ave; Brookledge St; Holworthy St; Deckard St; Hazelwood St; Cobden St; Wabon St; Alpine St; Codman Park; Dimock St; Hollander St; Abbotsford St; Nazing St; Dabney St; Wayne St; Crestwood Park; Dennison St; Elmore St; Charlame St; Akron St; Notre Dame St; Hartwell St; Wenonah St; Catawba St; Laurel St; Sonoma St; Paulding St; Hewes St; Brunswick St; Dimock Pl; Academy Rd; Bower St; Elbert St; Fountain St; Rockland Ave; Park View St; Wabeno St; Hulbert St; Saint Richard St; Mills St; Wakullah St; Sherman St; Pleasanton St; Wardman Rd; Westminster Ct; Waldren Rd; Mayfair St; Wellington Ct; Segel St; Herman St; Haley St; Pickering Ave; Leslie Park; Fenno St; Marksdale St; Rock St; Humboldt Ct; Alpine Pl; St James Pl; St James Ter; Kensington Park; Bragdon St; Fenwick Pl; Montana St; Hestia Park; Kensington St; Cardington St; Weaver Way; Oakville Ave; Elmore Park; Dunford St; Hazelwood Ct; Westminster Ter; Nazing Ct; S Charlame Ter; Hansford Pl; Harold Park; Academy Ter; S Charlame Ct; Charlame Pl; Danforth Pl; Maple Ct; Academy Ct; Obierne Pl; Hilton Ter; Walnut Ct; N Charlame Ct; Silva Pl; N Charlame Ter; Regent Sq; Akron Pl; Ruthven Park; Weaver Ct; Circuit Sq; Brinton St; Regent Pl; Hommagen Ct.
Washington Park neighborhood detailed profile
Area: 0.815 square miles
Population: 19,978
Population density:
| Washington Park: | 24,498 people per square mile |
| Boston: | 13,511 people per square mile |
Median household income in 2021:
| Washington Park: | $45,324 |
| Boston: | $79,283 |
Median rent in in 2021:
| Washington Park: | $891 |
| Boston: | $1,696 |
Male vs Females
| Males: | 7,996 |
| Females: | 11,982 |
Median age
| Males: | 36.0 years |
| Females: | 37.7 years |
Housing prices:
Average estimated value of detached houses in 2021 (11.5% of all units):
| Washington Park: | $514,654 |
| Boston: | $683,896 |
Average estimated value of townhouses or other attached units in 2021 (16.3% of all units):
| This neighborhood: | $620,753 |
| city: | $1,097,292 |
Average estimated value of housing units in 2-unit structures in 2021 (17.1% of all units):
| This neighborhood: | $323,224 |
| Boston: | $639,493 |
Average estimated '21 value of housing units in 3-to-4-unit structures (23.7% of all units):
| Washington Park: | $3,389,893 |
| city: | $745,440 |
Average estimated '21 value of housing units in 5-or-more-unit structures (16.6% of all units):
| Washington Park: | $215,601 |
| Boston: | $986,433 |
Most popular occupations of males: service occupations (17.7%); sales and office occupations (17.5%); transportation occupations (13.5%); construction, extraction, and maintenance occupations (9.3%); community and social services occupations (6.3%); education, training, and library occupations (6.1%); computer and mathematical occupations (6.0%)
Most popular occupations of females: service occupations (32.7%); sales and office occupations (23.0%); education, training, and library occupations (8.0%); computer and mathematical occupations (7.9%); business and financial operations occupations (7.1%); management occupations (except farmers) (6.5%); healthcare practitioners and technical occupations (3.8%)
Highways in this neighborhood: State Hwy 28 (Seaver St); State Hwy 28 (Columbus Ave).
Roads and streets: Warren St; Martin Luther King Blvd; Walnut Ave; Humboldt Ave; Townsend St; Crawford St; Harold St; Waumbeck St; Howland St; Ruthven St; Homestead St; Elm Hill Ave; Dale St; Blue Hill Ave; Regent St; Hutchings St; Washington St; Harrishof St; Rockland St; Circuit St; Maple St; Walnut Park; Munroe St; Cheney St; Schuyler St; St James St; Georgia St; Wyoming St; Westminster Ave; Brookledge St; Holworthy St; Deckard St; Hazelwood St; Cobden St; Wabon St; Alpine St; Codman Park; Dimock St; Hollander St; Abbotsford St; Nazing St; Dabney St; Wayne St; Crestwood Park; Dennison St; Elmore St; Charlame St; Akron St; Notre Dame St; Hartwell St; Wenonah St; Catawba St; Laurel St; Sonoma St; Paulding St; Hewes St; Brunswick St; Dimock Pl; Academy Rd; Bower St; Elbert St; Fountain St; Rockland Ave; Park View St; Wabeno St; Hulbert St; Saint Richard St; Mills St; Wakullah St; Sherman St; Pleasanton St; Wardman Rd; Westminster Ct; Waldren Rd; Mayfair St; Wellington Ct; Segel St; Herman St; Haley St; Pickering Ave; Leslie Park; Fenno St; Marksdale St; Rock St; Humboldt Ct; Alpine Pl; St James Pl; St James Ter; Kensington Park; Bragdon St; Fenwick Pl; Montana St; Hestia Park; Kensington St; Cardington St; Weaver Way; Oakville Ave; Elmore Park; Dunford St; Hazelwood Ct; Westminster Ter; Nazing Ct; S Charlame Ter; Hansford Pl; Harold Park; Academy Ter; S Charlame Ct; Charlame Pl; Danforth Pl; Maple Ct; Academy Ct; Obierne Pl; Hilton Ter; Walnut Ct; N Charlame Ct; Silva Pl; N Charlame Ter; Regent Sq; Akron Pl; Ruthven Park; Weaver Ct; Circuit Sq; Brinton St; Regent Pl; Hommagen Ct.
Washington Park neighborhood detailed profile
Waterfront neighborhood in Boston statistics: (Find on map)
Area: 0.272 square miles
Population: 9,433
Population density:
Median household income in 2021:
Median rent in in 2021:
Male vs Females
Median age
Housing prices:
Average estimated '21 value of housing units in 3-to-4-unit structures (37.3% of all units):
Average estimated '21 value of housing units in 5-or-more-unit structures (14.5% of all units):
Most popular occupations of males: business and financial operations occupations (24.4%); sales and office occupations (16.1%); management occupations (except farmers) (13.3%); service occupations (13.0%); computer and mathematical occupations (8.2%); legal occupations (7.1%); healthcare practitioners and technical occupations (3.5%)
Most popular occupations of females: business and financial operations occupations (22.0%); sales and office occupations (19.7%); management occupations (except farmers) (13.7%); computer and mathematical occupations (9.0%); life, physical, and social science occupations (5.4%); healthcare practitioners and technical occupations (5.4%); arts, design, entertainment, sports, and media occupations (5.1%)
Limited-access highways (interstate or state) in this neighborhood: US Hwy 1 (I- 93, John F Fitzgerald Expy, State Hwy 3).
Highways in this neighborhood: State Hwy 1 Alt (William F McClellan Hwy).
Roads and streets: Commercial St; Atlantic Ave; North St; Hanover St; Prince St; Cross St; Charter St; Salem St; Endicott St; Richmond St; Commercial Wharf; Hull St; Surface Artery; Long Wharf; N Margin St; Cooper St; Battery St; Fulton St; Fleet St; N Commercial Wharf; Tileston St; Snow Hill St; N Bennet St; Clark St; Stillman St; E India Row; Union Wharf; Battery Wharf; Sheafe St; Thacher St; Moon St; Salutation St; Eastern Ave; Lewis St; Lombard Pl; Hanover Ave; Morton St; State St; Harris St; Central Wharf; Unity St; Bartlett Pl; N415; North Sq; Jerusalem Pl; Rowes Wharf; Parmenter St; India Wharf; Wiget St; Milk St; Cleveland Pl; Greenough Ln; N Hudson St; Stillman Pl; Hanover St Exd; Lynn St; Margaret St; Commercial Wharf N (N Commercial Wharf); Powers Ct; Noyes Pl; Henchman St; Garden Ct St (Garden Ct); Richmond Pl; Foster St; Charlestown Brg (N Washington St); Sumner Tunl; Baldwin Pl; N Bennett Ct; Bakers Aly; Phipps Pl; Causeway St; Foster Wharf; N Hanover Ct; Jackson Ave; Callahan Tunl; Central St; Hanover Pl; Lafayette Ave; Lewis Wharf; Murphy Ct; Sun Court St; Anthony Pl; Langdon Pl; Salem Ct; Lathrop Pl; Wesley Pl; Snelling Pl; Copps Hill Ter; Walsh Pl; Unity Ct; Thacher Ct; Endicott Ct; Wharf St; Michelangelo St; Arch Way; Wiggin St; Lincoln Wharf; Fulton Pl; Quincy Ct; India St; Pond Street Pl; Board Aly; Whitlers Aly; Douglas Ct; Revere Pl; Holden Ct; N382.
Waterfront neighborhood detailed profile
Area: 0.272 square miles
Population: 9,433
Population density:
| Waterfront (North End): | 34,724 people per square mile |
| Boston: | 13,511 people per square mile |
Median household income in 2021:
| Waterfront (North End): | $107,950 |
| Boston: | $79,283 |
Median rent in in 2021:
| Waterfront (North End): | $2,155 |
| Boston: | $1,696 |
Male vs Females
| Males: | 4,374 |
| Females: | 5,058 |
Median age
| Males: | 31.8 years |
| Females: | 31.1 years |
Housing prices:
Average estimated '21 value of housing units in 3-to-4-unit structures (37.3% of all units):
| Waterfront (North End): | $1,078,304 |
| city: | $745,440 |
Average estimated '21 value of housing units in 5-or-more-unit structures (14.5% of all units):
| Waterfront (North End): | $419,715 |
| Boston: | $986,433 |
Most popular occupations of males: business and financial operations occupations (24.4%); sales and office occupations (16.1%); management occupations (except farmers) (13.3%); service occupations (13.0%); computer and mathematical occupations (8.2%); legal occupations (7.1%); healthcare practitioners and technical occupations (3.5%)
Most popular occupations of females: business and financial operations occupations (22.0%); sales and office occupations (19.7%); management occupations (except farmers) (13.7%); computer and mathematical occupations (9.0%); life, physical, and social science occupations (5.4%); healthcare practitioners and technical occupations (5.4%); arts, design, entertainment, sports, and media occupations (5.1%)
Limited-access highways (interstate or state) in this neighborhood: US Hwy 1 (I- 93, John F Fitzgerald Expy, State Hwy 3).
Highways in this neighborhood: State Hwy 1 Alt (William F McClellan Hwy).
Roads and streets: Commercial St; Atlantic Ave; North St; Hanover St; Prince St; Cross St; Charter St; Salem St; Endicott St; Richmond St; Commercial Wharf; Hull St; Surface Artery; Long Wharf; N Margin St; Cooper St; Battery St; Fulton St; Fleet St; N Commercial Wharf; Tileston St; Snow Hill St; N Bennet St; Clark St; Stillman St; E India Row; Union Wharf; Battery Wharf; Sheafe St; Thacher St; Moon St; Salutation St; Eastern Ave; Lewis St; Lombard Pl; Hanover Ave; Morton St; State St; Harris St; Central Wharf; Unity St; Bartlett Pl; N415; North Sq; Jerusalem Pl; Rowes Wharf; Parmenter St; India Wharf; Wiget St; Milk St; Cleveland Pl; Greenough Ln; N Hudson St; Stillman Pl; Hanover St Exd; Lynn St; Margaret St; Commercial Wharf N (N Commercial Wharf); Powers Ct; Noyes Pl; Henchman St; Garden Ct St (Garden Ct); Richmond Pl; Foster St; Charlestown Brg (N Washington St); Sumner Tunl; Baldwin Pl; N Bennett Ct; Bakers Aly; Phipps Pl; Causeway St; Foster Wharf; N Hanover Ct; Jackson Ave; Callahan Tunl; Central St; Hanover Pl; Lafayette Ave; Lewis Wharf; Murphy Ct; Sun Court St; Anthony Pl; Langdon Pl; Salem Ct; Lathrop Pl; Wesley Pl; Snelling Pl; Copps Hill Ter; Walsh Pl; Unity Ct; Thacher Ct; Endicott Ct; Wharf St; Michelangelo St; Arch Way; Wiggin St; Lincoln Wharf; Fulton Pl; Quincy Ct; India St; Pond Street Pl; Board Aly; Whitlers Aly; Douglas Ct; Revere Pl; Holden Ct; N382.
Waterfront neighborhood detailed profile
West Broadway neighborhood in Boston statistics: (Find on map)
Area: 1.694 square miles
Population: 57,963
Population density:
Median household income in 2021:
Median rent in in 2021:
Male vs Females
Median age
Housing prices:
Average estimated value of detached houses in 2021 (11.8% of all units):
Average estimated value of townhouses or other attached units in 2021 (11.8% of all units):
Average estimated value of housing units in 2-unit structures in 2021 (7.4% of all units):
Average estimated '21 value of housing units in 3-to-4-unit structures (34.5% of all units):
Average estimated '21 value of housing units in 5-or-more-unit structures (2.1% of all units):
Most popular occupations of males: sales and office occupations (26.1%); management occupations (except farmers) (16.4%); business and financial operations occupations (15.5%); service occupations (12.2%); computer and mathematical occupations (11.1%); material moving occupations (4.0%); healthcare practitioners and technical occupations (3.8%)
Most popular occupations of females: sales and office occupations (21.0%); management occupations (except farmers) (16.9%); business and financial operations occupations (15.9%); service occupations (10.7%); community and social services occupations (7.6%); computer and mathematical occupations (6.9%); healthcare practitioners and technical occupations (6.9%)
Limited-access highways (interstate or state) in this neighborhood: Massachusetts Tpke (I- 90).
Roads and streets: Summer St; N380; E 1st St; D St; E St; B St; W 2nd St; Northern Ave; Athens St; A St; W 3rd St; Dorchester St; Bolton St; Dry Dock Ave; W Broadway; C St; William J Day Blvd; W 1st St; Fid Kennedy Ave; Seaport Blvd (Northern Ave); Cypher St; W 7th St; F St; Black Falcon Ave; Fargo St; Silver St; W 4th St; Gold St; Bullock St; W 5th St; W 6th St; Sleeper St; W 8th St; Bowen St; Tudor St; Joyce Hayes Way; Dresser St; Granite St; W 9th St; N118; Dalessio Ct; Harbor St; Crowley Rogers Way; Flaherty Way; Orton Marotta Way; Channel St; Baxter St; Viaduct St; Boston Fish Pier; Congress St; O St; Midway St; Trilling Way; Binford St; Necco St; Richards St; Tide St; Melcher St; Pittsburgh St; Necco Ct; Farnsworth St; Thomson Pl (Stillings St); Power House St; Elkins St; Fish Pier Rd; Butler St; Baldwin St; Dolphin Way; Inman St; Claflin St; K St; Wormwood St; Baldwin Pl; Mitchell St; Gustin St; Louis St; Grimes St; Loring St; Mt Washington Ave; Lark St; Seaport Ln; Frederick St; Cottage St; Sherman Ct; Capstan Way; Ballard Way; Anchor Way; Courthouse Way; Design Center Pl; Yard Way; Earl St; Wrights Ct; Payson Ct; Lawrence Ct; Church Ave; Calvin Pl; Pulaski Ave; Dyer Ave; 3rd Pl; Bell Ct; Ewer St; Mount Washington Ave; Lilly St; Lovis St; Washington Pl; Doolin Pl; Necco Pl.
Railroad features: Penn Central RR.
West Broadway neighborhood detailed profile
Area: 1.694 square miles
Population: 57,963
Population density:
| West Broadway (D Street): | 34,226 people per square mile |
| Boston: | 13,511 people per square mile |
Median household income in 2021:
| West Broadway (D Street): | $101,740 |
| Boston: | $79,283 |
Median rent in in 2021:
| West Broadway (D Street): | $2,007 |
| Boston: | $1,696 |
Male vs Females
| Males: | 24,578 |
| Females: | 33,384 |
Median age
| Males: | 30.7 years |
| Females: | 37.7 years |
Housing prices:
Average estimated value of detached houses in 2021 (11.8% of all units):
| West Broadway (D Street): | $238,274 |
| Boston: | $683,896 |
Average estimated value of townhouses or other attached units in 2021 (11.8% of all units):
| This neighborhood: | $189,999 |
| city: | $1,097,292 |
Average estimated value of housing units in 2-unit structures in 2021 (7.4% of all units):
| This neighborhood: | $183,675 |
| Boston: | $639,493 |
Average estimated '21 value of housing units in 3-to-4-unit structures (34.5% of all units):
| West Broadway (D Street): | $691,471 |
| city: | $745,440 |
Average estimated '21 value of housing units in 5-or-more-unit structures (2.1% of all units):
| West Broadway (D Street): | $620,159 |
| Boston: | $986,433 |
Most popular occupations of males: sales and office occupations (26.1%); management occupations (except farmers) (16.4%); business and financial operations occupations (15.5%); service occupations (12.2%); computer and mathematical occupations (11.1%); material moving occupations (4.0%); healthcare practitioners and technical occupations (3.8%)
Most popular occupations of females: sales and office occupations (21.0%); management occupations (except farmers) (16.9%); business and financial operations occupations (15.9%); service occupations (10.7%); community and social services occupations (7.6%); computer and mathematical occupations (6.9%); healthcare practitioners and technical occupations (6.9%)
Limited-access highways (interstate or state) in this neighborhood: Massachusetts Tpke (I- 90).
Roads and streets: Summer St; N380; E 1st St; D St; E St; B St; W 2nd St; Northern Ave; Athens St; A St; W 3rd St; Dorchester St; Bolton St; Dry Dock Ave; W Broadway; C St; William J Day Blvd; W 1st St; Fid Kennedy Ave; Seaport Blvd (Northern Ave); Cypher St; W 7th St; F St; Black Falcon Ave; Fargo St; Silver St; W 4th St; Gold St; Bullock St; W 5th St; W 6th St; Sleeper St; W 8th St; Bowen St; Tudor St; Joyce Hayes Way; Dresser St; Granite St; W 9th St; N118; Dalessio Ct; Harbor St; Crowley Rogers Way; Flaherty Way; Orton Marotta Way; Channel St; Baxter St; Viaduct St; Boston Fish Pier; Congress St; O St; Midway St; Trilling Way; Binford St; Necco St; Richards St; Tide St; Melcher St; Pittsburgh St; Necco Ct; Farnsworth St; Thomson Pl (Stillings St); Power House St; Elkins St; Fish Pier Rd; Butler St; Baldwin St; Dolphin Way; Inman St; Claflin St; K St; Wormwood St; Baldwin Pl; Mitchell St; Gustin St; Louis St; Grimes St; Loring St; Mt Washington Ave; Lark St; Seaport Ln; Frederick St; Cottage St; Sherman Ct; Capstan Way; Ballard Way; Anchor Way; Courthouse Way; Design Center Pl; Yard Way; Earl St; Wrights Ct; Payson Ct; Lawrence Ct; Church Ave; Calvin Pl; Pulaski Ave; Dyer Ave; 3rd Pl; Bell Ct; Ewer St; Mount Washington Ave; Lilly St; Lovis St; Washington Pl; Doolin Pl; Necco Pl.
Railroad features: Penn Central RR.
West Broadway neighborhood detailed profile
West Fens neighborhood in Boston statistics: (Find on map)
Area: 0.216 square miles
Population: 3,041
Population density:
Median household income in 2021:
Median rent in in 2021:
Male vs Females
Median age
Most popular occupations of males: service occupations (34.9%); sales and office occupations (33.8%); education, training, and library occupations (7.6%); life, physical, and social science occupations (5.5%); management occupations (except farmers) (4.9%); computer and mathematical occupations (4.5%); arts, design, entertainment, sports, and media occupations (2.5%)
Most popular occupations of females: sales and office occupations (33.9%); service occupations (33.2%); education, training, and library occupations (9.5%); management occupations (except farmers) (4.9%); life, physical, and social science occupations (4.9%); business and financial operations occupations (4.4%); healthcare practitioners and technical occupations (2.4%)
Roads and streets: Park Dr; Boylston St; Peterborough St; Queensberry St; Van Ness St; Ipswich St; Kilmarnock St; Jersey St; Charlesgate; Agassiz Rd.
Other features: Muddy Riv.
West Fens neighborhood detailed profile
Area: 0.216 square miles
Population: 3,041
Population density:
| West Fens: | 14,075 people per square mile |
| Boston: | 13,511 people per square mile |
Median household income in 2021:
| West Fens: | $71,582 |
| Boston: | $79,283 |
Median rent in in 2021:
| West Fens: | $1,479 |
| Boston: | $1,696 |
Male vs Females
| Males: | 1,293 |
| Females: | 1,747 |
Median age
| Males: | 20.0 years |
| Females: | 19.9 years |
Most popular occupations of males: service occupations (34.9%); sales and office occupations (33.8%); education, training, and library occupations (7.6%); life, physical, and social science occupations (5.5%); management occupations (except farmers) (4.9%); computer and mathematical occupations (4.5%); arts, design, entertainment, sports, and media occupations (2.5%)
Most popular occupations of females: sales and office occupations (33.9%); service occupations (33.2%); education, training, and library occupations (9.5%); management occupations (except farmers) (4.9%); life, physical, and social science occupations (4.9%); business and financial operations occupations (4.4%); healthcare practitioners and technical occupations (2.4%)
Roads and streets: Park Dr; Boylston St; Peterborough St; Queensberry St; Van Ness St; Ipswich St; Kilmarnock St; Jersey St; Charlesgate; Agassiz Rd.
Other features: Muddy Riv.
West Fens neighborhood detailed profile
West Lower Mills neighborhood in Boston statistics: (Find on map)
Area: 0.382 square miles
Population: 7,828
Population density:
Median household income in 2021:
Median rent in in 2021:
Male vs Females
Median age
Housing prices:
Average estimated value of detached houses in 2021 (26.1% of all units):
Average estimated value of townhouses or other attached units in 2021 (30.4% of all units):
Average estimated value of housing units in 2-unit structures in 2021 (27.3% of all units):
Average estimated '21 value of housing units in 3-to-4-unit structures (24.7% of all units):
Average estimated '21 value of housing units in 5-or-more-unit structures (19.8% of all units):
Most popular occupations of males: service occupations (24.3%); sales and office occupations (20.7%); transportation occupations (11.9%); material moving occupations (6.9%); healthcare practitioners and technical occupations (6.4%); community and social services occupations (6.2%); construction, extraction, and maintenance occupations (4.7%)
Most popular occupations of females: service occupations (34.7%); sales and office occupations (22.2%); healthcare practitioners and technical occupations (10.6%); management occupations (except farmers) (10.0%); education, training, and library occupations (4.5%); community and social services occupations (3.2%); material moving occupations (3.2%)
Other features: Neponset Riv.
Highways in this neighborhood: Morton St (State Hwy 203); State Hwy 203 (Gallivan Blvd).
Roads and streets: Milton Ave; Evans St; Norfolk St; River St; Selden St; Capen St; Maxwell St; Fuller St; Fairmount St; Manchester St; Clearwater Dr; Thetford Ave; Wilmington Ave; Sanford St; Corbet St; Edson St; Stanton St; Nelson St; Old Morton St; Temple St; Cedar St; Caryll St; Idaho St; Pleasant Hill Ave; Sturbridge St; Oakridge St; Groveland St; Druid St; Monson St; Crowell St; Dyer St; Maryknoll St; Hopkins St; Countryside Dr; Caddy Rd; Vera St; Rock Ave; Capen Pl; Dyer Ct; Arbella Rd; Charles Rd; Norfolk Ter; Paula Rd; Balina Pl; Matthew St; Taylor Ter; Ufford St.
Other features: Neponset Riv (Neponset Riv).
West Lower Mills neighborhood detailed profile
Area: 0.382 square miles
Population: 7,828
Population density:
| West Lower Mills (W. Codman Hill): | 20,488 people per square mile |
| Boston: | 13,511 people per square mile |
Median household income in 2021:
| West Lower Mills (W. Codman Hill): | $71,278 |
| Boston: | $79,283 |
Median rent in in 2021:
| West Lower Mills (W. Codman Hill): | $1,587 |
| Boston: | $1,696 |
Male vs Females
| Males: | 3,867 |
| Females: | 3,960 |
Median age
| Males: | 32.3 years |
| Females: | 36.7 years |
Housing prices:
Average estimated value of detached houses in 2021 (26.1% of all units):
| West Lower Mills (W. Codman Hill): | $521,305 |
| Boston: | $683,896 |
Average estimated value of townhouses or other attached units in 2021 (30.4% of all units):
| This neighborhood: | $394,661 |
| city: | $1,097,292 |
Average estimated value of housing units in 2-unit structures in 2021 (27.3% of all units):
| This neighborhood: | $342,309 |
| Boston: | $639,493 |
Average estimated '21 value of housing units in 3-to-4-unit structures (24.7% of all units):
| West Lower Mills (W. Codman Hill): | $152,339 |
| city: | $745,440 |
Average estimated '21 value of housing units in 5-or-more-unit structures (19.8% of all units):
| West Lower Mills (W. Codman Hill): | $530,424 |
| Boston: | $986,433 |
Most popular occupations of males: service occupations (24.3%); sales and office occupations (20.7%); transportation occupations (11.9%); material moving occupations (6.9%); healthcare practitioners and technical occupations (6.4%); community and social services occupations (6.2%); construction, extraction, and maintenance occupations (4.7%)
Most popular occupations of females: service occupations (34.7%); sales and office occupations (22.2%); healthcare practitioners and technical occupations (10.6%); management occupations (except farmers) (10.0%); education, training, and library occupations (4.5%); community and social services occupations (3.2%); material moving occupations (3.2%)
Other features: Neponset Riv.
Highways in this neighborhood: Morton St (State Hwy 203); State Hwy 203 (Gallivan Blvd).
Roads and streets: Milton Ave; Evans St; Norfolk St; River St; Selden St; Capen St; Maxwell St; Fuller St; Fairmount St; Manchester St; Clearwater Dr; Thetford Ave; Wilmington Ave; Sanford St; Corbet St; Edson St; Stanton St; Nelson St; Old Morton St; Temple St; Cedar St; Caryll St; Idaho St; Pleasant Hill Ave; Sturbridge St; Oakridge St; Groveland St; Druid St; Monson St; Crowell St; Dyer St; Maryknoll St; Hopkins St; Countryside Dr; Caddy Rd; Vera St; Rock Ave; Capen Pl; Dyer Ct; Arbella Rd; Charles Rd; Norfolk Ter; Paula Rd; Balina Pl; Matthew St; Taylor Ter; Ufford St.
Other features: Neponset Riv (Neponset Riv).
West Lower Mills neighborhood detailed profile