Sav-mor neighborhood in Boston, Massachusetts (MA), 02119, 02121 detailed profile
Settings
X

Business Search - 14 Million verified businesses
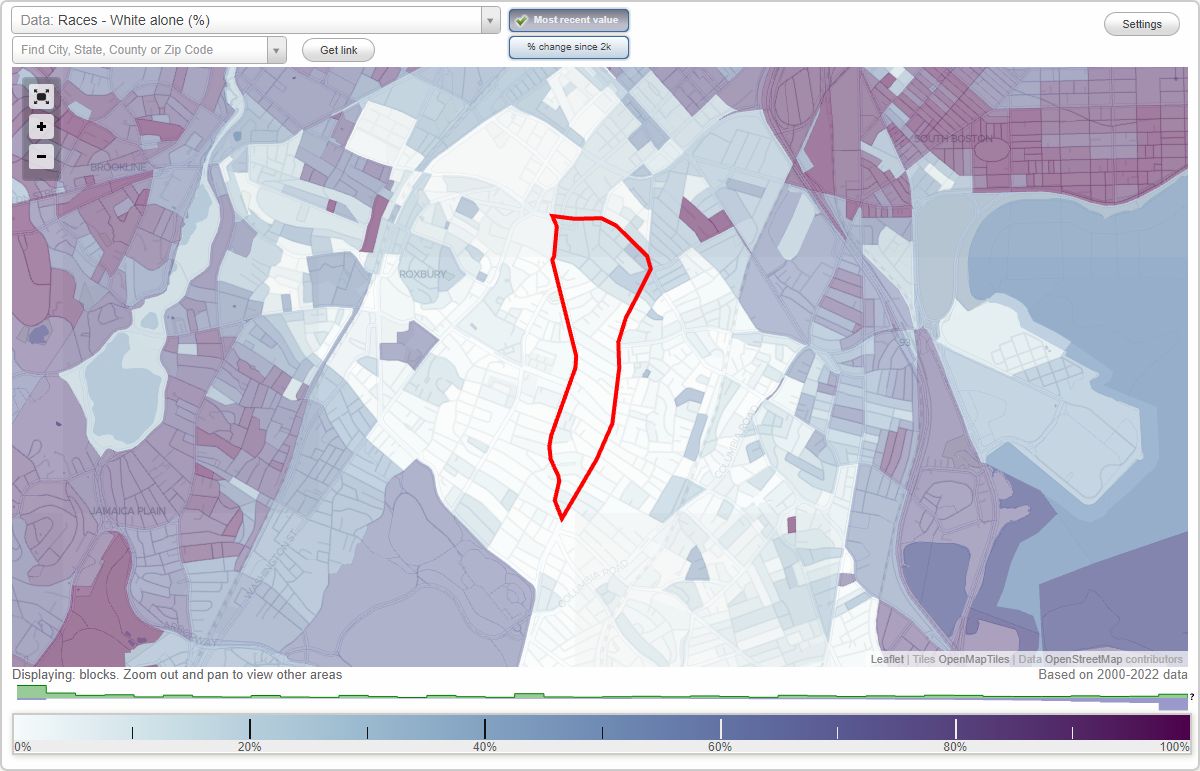
Area: 0.312 square miles
Population: 7,317
Population density:
| Sav-mor: | 23,489 people per square mile |
| Boston: | 13,418 people per square mile |

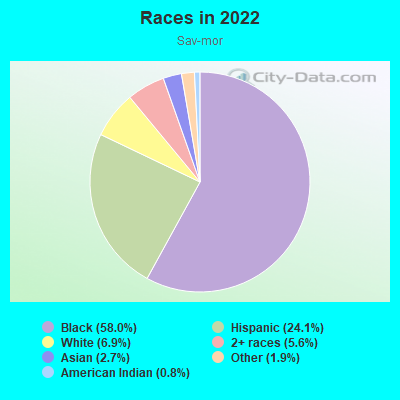
- 4,35658.0%Black
- 1,81124.1%Hispanic or Latino
- 5176.9%White
- 4235.6%Two or more races
- 1992.7%Asian
- 1421.9%Some other race
- 600.8%American Indian
Distribution of median household income
![Distribution of median household income]()
- 468Less than $10,000
- 539$10,000 to $19,999
- 578$20,000 to $29,999
- 429$30,000 to $39,999
- 374$40,000 to $49,999
- 200$50,000 to $59,999
- 282$60,000 to $74,999
- 387$75,000 to $99,999
- 217$100,000 to $124,999
- 414$125,000 to $149,999
- 164$150,000 to $199,999
- 205$200,000 or more

Distribution of owner-occupied house/condo value
![Distribution of owner-occupied house/condo value]()
- 352Less than $50,000
- 200$50,000 to $99,999
- 45$100,000 to $149,999
- 237$150,000 to $199,999
- 57$200,000 to $249,999
- 105$250,000 to $299,999
- 73$300,000 to $399,999
- 308$400,000 to $499,999
- 223$500,000 to $749,999
- 270$750,000 to $999,999
- 276$1,000,000 or more

Distribution of rent paid by renters
![Distribution of rent paid by renters]()
- 166Less than $100
- 314$100 to $199
- 409$200 to $299
- 361$300 to $399
- 293$400 to $499
- 278$500 to $599
- 232$600 to $699
- 263$700 to $799
- 46$800 to $899
- 120$900 to $999
- 282$1,000 to $1,249
- 345$1,250 to $1,499
- 246$1,500 to $1,999
- 679$2,000 or more

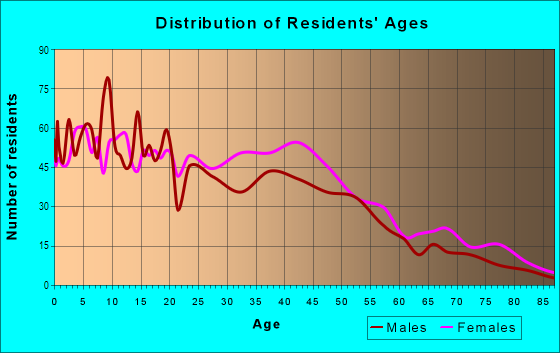
| Males: | 3,568 |
| Females: | 3,748 |
Males:
| This neighborhood: | 30.0 years |
| Whole city: | 32.7 years |
| This neighborhood: | 39.5 years |
| Whole city: | 34.1 years |
Average household size:
| Sav-mor: | 3.7 people |
| Boston: | 2.1 people |
Percentage of family households:
| Sav-mor: | 48.0% |
| Boston: | 34.5% |
| Here: | 22.2% |
| Boston: | 26.9% |
Percentage of married-couple families with children (among all households):
| Sav-mor: | 19.4% |
| Boston: | 24.9% |
Percentage of single-mother households (among all households):
| Sav-mor: | 23.8% |
| Boston: | 15.7% |
Percentage of never married males 15 years old and over:
Percentage of never married females 15 years old and over:
| Sav-mor: | 28.1% |
| Boston: | 26.8% |
Percentage of never married females 15 years old and over:
| Sav-mor: | 33.6% |
| city: | 28.3% |
Percentage of people that speak English not well or not at all:
| Sav-mor: | 6.0% |
| Boston: | 8.0% |
Percentage of people born in this state:
Percentage of people born in another U.S. state:
Percentage of native residents but born outside the U.S.:
Percentage of foreign born residents:
| Here: | 57.1% |
| Boston: | 42.4% |
Percentage of people born in another U.S. state:
| Sav-mor: | 15.1% |
| Boston: | 26.6% |
Percentage of native residents but born outside the U.S.:
| Here: | 5.7% |
| city: | 3.3% |
Percentage of foreign born residents:
| Here: | 22.0% |
| Boston: | 27.6% |
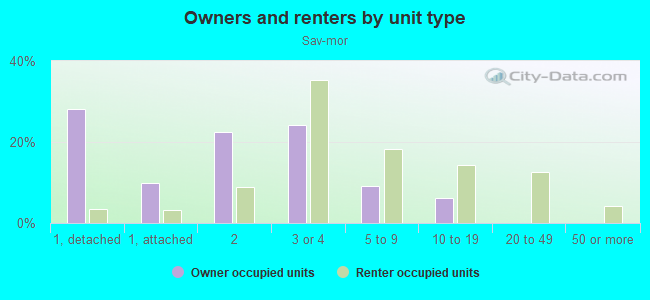
Owner-occupied
Renter-occupied

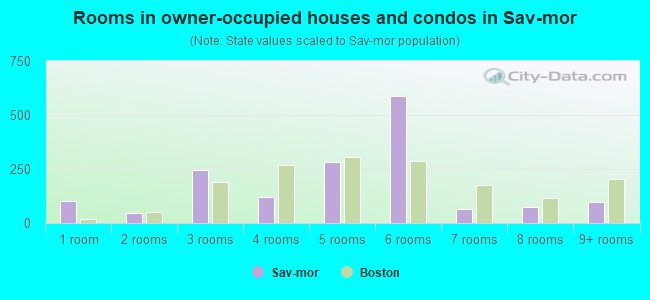
- Rooms in owner-occupied houses and condos in Sav-mor
- 1011 room
- 442 rooms
- 2443 rooms
- 1214 rooms
- 2835 rooms
- 5886 rooms
- 677 rooms
- 758 rooms
- 999+ rooms
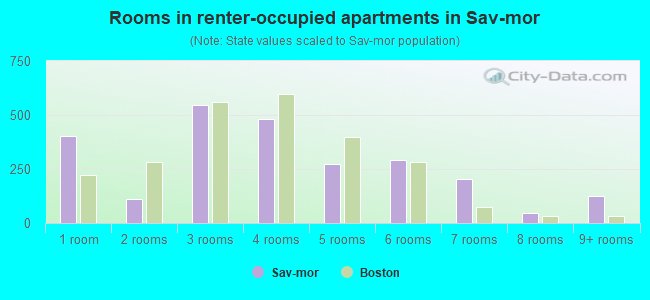
- Rooms in renter-occupied apartments in Sav-mor
- 4011 room
- 1102 rooms
- 5453 rooms
- 4814 rooms
- 2755 rooms
- 2906 rooms
- 2027 rooms
- 488 rooms
- 1259+ rooms
Owner-occupied
Renter-occupied
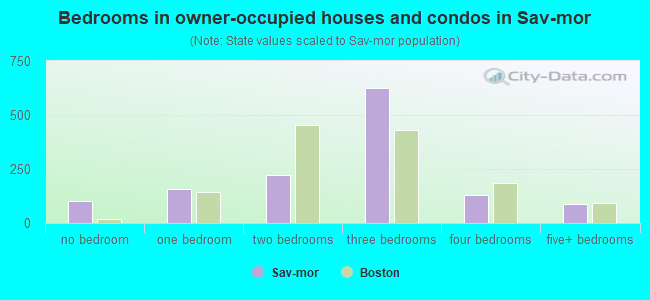
- Bedrooms in owner-occupied houses and condos in Sav-mor
- 101no bedroom
- 1591 bedroom
- 2222 bedrooms
- 6243 bedrooms
- 1304 bedrooms
- 865+ bedrooms
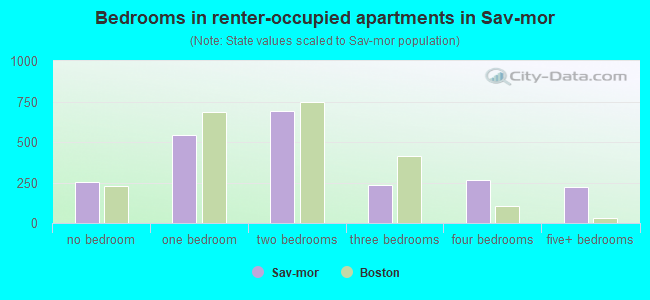
- Bedrooms in renter-occupied apartments in Sav-mor
- 251no bedroom
- 5411 bedroom
- 6902 bedrooms
- 2363 bedrooms
- 2644 bedrooms
- 2235+ bedrooms
Average number of cars or other vehicles available in houses/condos:
Average number of cars or other vehicles available in apartments:
| This neighborhood: | |
| Boston: |
Average number of cars or other vehicles available in apartments:
| Here: | 0.7 |
| city: | 0.7 |
Percentage of units with a mortgage:
| Sav-mor: | 81.6% |
| Boston: | 69.7% |
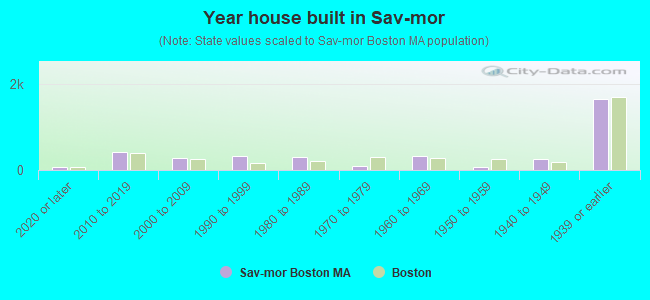
- Year house built in Sav-mor
- 812020 or later
- 4132010 to 2019
- 2832000 to 2009
- 3321990 to 1999
- 3001980 to 1989
- 841970 to 1979
- 3251960 to 1969
- 761950 to 1959
- 2551940 to 1949
- 1,6461939 or earlier
City-data.com crime index for city in 2020 (higher means more crime):
| City: | 258.2 |
| U.S. average: | 219.5 |
Travel time to work (commute)
![Travel time to work (commute)]()
- 59Less than 5 minutes
- 1365 to 9 minutes
- 32110 to 14 minutes
- 27515 to 19 minutes
- 45020 to 24 minutes
- 25525 to 29 minutes
- 70230 to 34 minutes
- 8035 to 39 minutes
- 18840 to 44 minutes
- 36045 to 59 minutes
- 42460 to 89 minutes
- 2690 or more minutes

Means of transportation to work
![Means of transportation to work]()
- 38.3%1,364Drove a car alone
- 8.3%297Carpooled
- 30.0%1,069Bus
- 11.1%394Subway or elevated rail
- 2.2%78Long-distance train or commuter rail
- 3.1%111Light rail, streetcar or trolley
- 4.6%164Ferryboat
- 2.7%95Taxi
- 4.9%174Bicycle
- 9.7%345Walked
- 6.4%227Other means
- 4.1%145Worked at home

Time leaving home to go to work
![Time leaving home to go to work]()
- 9112:00 a.m. to 4:59 a.m.
- 915:00 a.m. to 5:29 a.m.
- 1175:30 a.m. to 5:59 a.m.
- 3706:00 a.m. to 6:29 a.m.
- 1576:30 a.m. to 6:59 a.m.
- 4197:00 a.m. to 7:29 a.m.
- 3657:30 a.m. to 7:59 a.m.
- 5158:00 a.m. to 8:29 a.m.
- 1128:30 a.m. to 8:59 a.m.
- 3399:00 a.m. to 9:59 a.m.
- 18610:00 a.m. to 10:59 a.m.
- 15511:00 a.m. to 11:59 a.m.
- 38712:00 p.m. to 3:59 p.m.
- 1524:00 p.m. to 11:59 p.m.

Occupations of males:
- Percentage of males in management occupations (except farmers):
Here: 7.1% city: 12.7%
- Percentage of males in business and financial operations occupations:
Here: 1.6% city: 9.1%
- Percentage of males in architecture and engineering occupations:
Here: 2.4% city: 3.1%
- Percentage of males in community and social services occupations:
Here: 3.6% city: 1.4%
- Percentage of males in service occupations:
Here: 30.3% city: 16.0%
- Percentage of males in sales and office occupations:
Here: 29.1% city: 15.2%
- Percentage of males in construction, extraction, and maintenance occupations:
Here: 4.9% city: 4.4%
- Percentage of males in production occupations:
Here: 3.7% city: 2.4%
- Percentage of males in transportation occupations:
Here: 9.5% city: 4.7%
- Percentage of males in material moving occupations:
Here: 1.4% city: 2.3%
Occupations of females:
- Percentage of females in management occupations (except farmers):
Here: 9.6% city: 12.2%
- Percentage of females in business and financial operations occupations:
Here: 2.1% city: 9.5%
- Percentage of females in computer and mathematical occupations:
Here: 1.4% city: 3.2%
- Percentage of females in community and social services occupations:
Here: 14.2% city: 3.1%
- Percentage of females in legal occupations:
Here: 1.1% city: 2.3%
- Percentage of females in education, training, and library occupations:
Here: 7.3% city: 9.4%
- Percentage of females in healthcare practitioners and technical occupations:
Here: 11.6% city: 10.2%
- Percentage of females in service occupations:
Here: 31.9% city: 18.6%
- Percentage of females in sales and office occupations:
Here: 15.1% city: 20.2%
- Percentage of females in transportation occupations:
Here: 2.7% city: 0.8%
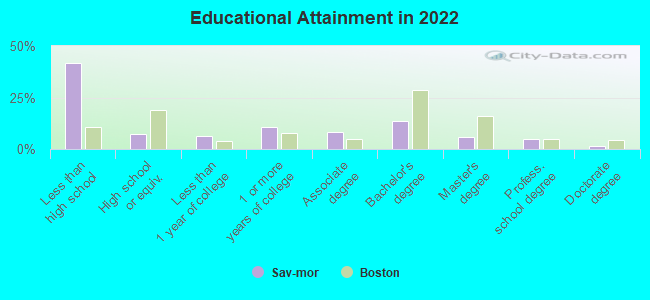
Education in this neighborhood (subdivision or community):
- Percentage of people 3 years and older in K-12 schools:
Sav-mor: 25.1% Boston: 11.0%
- Percentage of people 3 years and older in undergraduate colleges:
Sav-mor: 10.7% Boston: 11.0%
- Percentage of people 3 years and older in grad. or professional schools:
Sav-mor: 10.3% Boston: 4.3%
- Percentage of students K-12 enrolled in private schools:
Sav-mor: 33.4% Boston: 13.8%
Percentage of population below poverty level:
| Sav-mor: | 26.5% |
| Boston: | 17.1% |
Percentage of married-couple families with both working:
| Sav-mor: | 216.9% |
| Boston: | 78.2% |
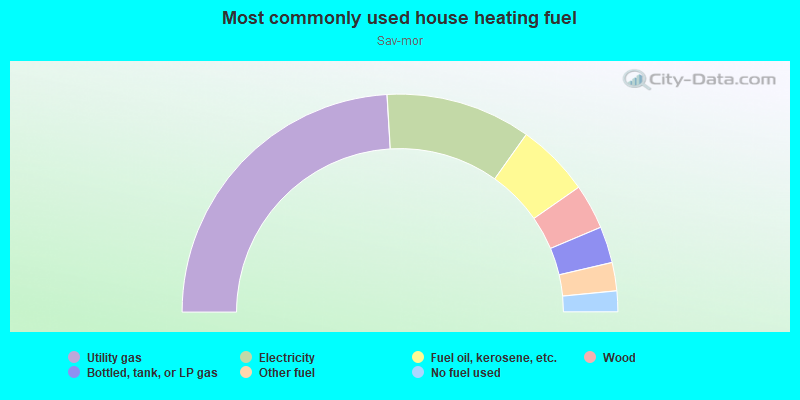
- 48.1%Utility gas
- 21.6%Electricity
- 10.9%Fuel oil, kerosene, etc.
- 6.7%Wood
- 5.4%Bottled, tank, or LP gas
- 4.2%Other fuel
- 3.1%No fuel used
Roads and streets:
Blue Hill Ave
Length: 1.13 miles
Directions: N-S, SW-NE
Address range: 1 to 449
Directions: N-S, SW-NE
Address range: 1 to 449
Moreland St
Length: 0.51 miles
Directions: E-W, SE-NW
Address range: 1 to 102
Directions: E-W, SE-NW
Address range: 1 to 102
Winthrop St
Length: 0.46 miles
Directions: E-W, SE-NW
Address range: 20 to 128
Directions: E-W, SE-NW
Address range: 20 to 128
Mount Pleasant Ave
Length: 0.43 miles
Directions: E-W, N-S, SE-NW
Address range: 10 to 199
Directions: E-W, N-S, SE-NW
Address range: 10 to 199
Warren St
Length: 0.39 miles
Direction: N-S
Address range: 94 to 310
Direction: N-S
Address range: 94 to 310
Forest St
Length: 0.33 miles
Direction: SE-NW
Address range: 1 to 99
Direction: SE-NW
Address range: 1 to 99
Waverly St
Length: 0.31 miles
Directions: E-W, SE-NW
Address range: 1 to 99
Directions: E-W, SE-NW
Address range: 1 to 99
Clifford St
Length: 0.29 miles
Directions: E-W, SE-NW
Address range: 1 to 99
Directions: E-W, SE-NW
Address range: 1 to 99
Copeland St
Length: 0.26 miles
Directions: E-W, SW-NE
Address range: 1 to 99
Directions: E-W, SW-NE
Address range: 1 to 99
Whiting St
Length: 0.26 miles
Directions: E-W, SW-NE
Address range: 1 to 99
Directions: E-W, SW-NE
Address range: 1 to 99
Maywood St
Length: 0.26 miles
Direction: SE-NW
Address range: 15 to 199
Direction: SE-NW
Address range: 15 to 199
Perrin St
Length: 0.25 miles
Direction: SW-NE
Address range: 1 to 99
Direction: SW-NE
Address range: 1 to 99
Edgewood St
Length: 0.25 miles
Directions: E-W, SE-NW, SW-NE
Address range: 19 to 99
Directions: E-W, SE-NW, SW-NE
Address range: 19 to 99
Holborn St
Length: 0.24 miles
Directions: E-W, SE-NW
Address range: 11 to 99
Directions: E-W, SE-NW
Address range: 11 to 99
Quincy St
Length: 0.23 miles
Directions: E-W, SE-NW
Address range: 18 to 99
Directions: E-W, SE-NW
Address range: 18 to 99
Savin St
Length: 0.21 miles
Directions: E-W, SE-NW
Address range: 29 to 99
Directions: E-W, SE-NW
Address range: 29 to 99
Montrose St
Length: 0.21 miles
Direction: E-W
Address range: 1 to 99
Direction: E-W
Address range: 1 to 99
Elm Hill Park
Length: 0.17 miles
Directions: E-W, N-S, SW-NE
Address range: 31 to 99
Directions: E-W, N-S, SW-NE
Address range: 31 to 99
Dunreath St
Length: 0.17 miles
Directions: E-W, SW-NE
Address range: 1 to 99
Directions: E-W, SW-NE
Address range: 1 to 99
Fairland St
Length: 0.16 miles
Direction: SW-NE
Address range: 1 to 99
Direction: SW-NE
Address range: 1 to 99
Rockville Park
Length: 0.15 miles
Directions: E-W, SE-NW, SW-NE
Address range: 1 to 99
Directions: E-W, SE-NW, SW-NE
Address range: 1 to 99
Kearsarge Ave
Length: 0.14 miles
Directions: E-W, N-S, SE-NW, SW-NE
Address range: 8 to 99
Directions: E-W, N-S, SE-NW, SW-NE
Address range: 8 to 99
Southwood St
Length: 0.14 miles
Directions: E-W, SE-NW, SW-NE
Address range: 18 to 99
Directions: E-W, SE-NW, SW-NE
Address range: 18 to 99
Gaston St
Length: 0.12 miles
Direction: E-W
Address range: 15 to 99
Direction: E-W
Address range: 15 to 99
Greenville St
Length: 0.11 miles
Direction: N-S
Address range: 13 to 99
Direction: N-S
Address range: 13 to 99
Otisfield St
Length: 0.11 miles
Directions: E-W, N-S, SE-NW, SW-NE
Address range: 1 to 99
Directions: E-W, N-S, SE-NW, SW-NE
Address range: 1 to 99
Gannett St
Length: 0.10 miles
Directions: N-S, SE-NW
Address range: 1 to 99
Directions: N-S, SE-NW
Address range: 1 to 99
Murray Ave
Length: 0.09 miles
Directions: E-W, SE-NW
Address range: 1 to 99
Directions: E-W, SE-NW
Address range: 1 to 99
Irwin Ave
Length: 0.09 miles
Direction: E-W
Address range: 1 to 99
Direction: E-W
Address range: 1 to 99
Dudley St
Length: 0.08 miles
Directions: N-S, SE-NW
Address range: 373 to 402
Directions: N-S, SE-NW
Address range: 373 to 402
Cleveland St
Length: 0.08 miles
Direction: SW-NE
Address range: 1 to 99
Direction: SW-NE
Address range: 1 to 99
Aspen St
Length: 0.08 miles
Direction: SE-NW
Address range: 1 to 99
Direction: SE-NW
Address range: 1 to 99
Loyola St
Length: 0.08 miles
Direction: SW-NE
Direction: SW-NE
Maybury St
Length: 0.07 miles
Direction: SW-NE
Address range: 1 to 99
Direction: SW-NE
Address range: 1 to 99
Weldon St
Length: 0.07 miles
Directions: N-S, SW-NE
Address range: 1 to 99
Directions: N-S, SW-NE
Address range: 1 to 99
Vine St
Length: 0.07 miles
Direction: SW-NE
Address range: 27 to 99
Direction: SW-NE
Address range: 27 to 99
Tupelo St
Length: 0.07 miles
Direction: SW-NE
Address range: 1 to 99
Direction: SW-NE
Address range: 1 to 99
Mount Pleasant Ter
Length: 0.05 miles
Direction: SW-NE
Address range: 1 to 99
Direction: SW-NE
Address range: 1 to 99
Copeland Pl
Length: 0.05 miles
Direction: SE-NW
Address range: 1 to 99
Direction: SE-NW
Address range: 1 to 99
Langford Park
Length: 0.05 miles
Direction: SE-NW
Address range: 1 to 99
Direction: SE-NW
Address range: 1 to 99
Vine Ave
Length: 0.04 miles
Direction: SE-NW
Address range: 1 to 99
Direction: SE-NW
Address range: 1 to 99
Burton Ave
Length: 0.04 miles
Direction: SE-NW
Address range: 1 to 99
Direction: SE-NW
Address range: 1 to 99
Quincy Ter
Length: 0.04 miles
Direction: SW-NE
Address range: 1 to 99
Direction: SW-NE
Address range: 1 to 99
Holborn Park
Length: 0.04 miles
Direction: SW-NE
Address range: 1 to 99
Direction: SW-NE
Address range: 1 to 99
Hazel Park
Length: 0.04 miles
Direction: SW-NE
Address range: 1 to 99
Direction: SW-NE
Address range: 1 to 99
Glenburne St
Length: 0.04 miles
Direction: N-S
Address range: 1 to 99
Direction: N-S
Address range: 1 to 99
Maywood Park
Length: 0.04 miles
Direction: SW-NE
Address range: 1 to 99
Direction: SW-NE
Address range: 1 to 99
la Grange Pl
Length: 0.04 miles
Directions: E-W, SE-NW
Address range: 1 to 99
Directions: E-W, SE-NW
Address range: 1 to 99
Copeland Park
Length: 0.03 miles
Direction: SE-NW
Address range: 1 to 99
Direction: SE-NW
Address range: 1 to 99
Kearsarge Ter
Length: 0.03 miles
Direction: E-W
Address range: 1 to 99
Direction: E-W
Address range: 1 to 99
Cleveland Park
Length: 0.03 miles
Direction: SE-NW
Address range: 1 to 99
Direction: SE-NW
Address range: 1 to 99
Forest Pl
Length: 0.03 miles
Direction: SW-NE
Address range: 1 to 99
Direction: SW-NE
Address range: 1 to 99
Holborn Ter
Length: 0.03 miles
Direction: N-S
Address range: 1 to 99
Direction: N-S
Address range: 1 to 99
Dunreath Ter
Length: 0.03 miles
Direction: N-S
Address range: 1 to 99
Direction: N-S
Address range: 1 to 99
Maywood Ter
Length: 0.03 miles
Direction: SW-NE
Address range: 1 to 99
Direction: SW-NE
Address range: 1 to 99
Presby Pl
Length: 0.03 miles
Direction: SW-NE
Address range: 1 to 99
Direction: SW-NE
Address range: 1 to 99
Quincy Pl
Length: 0.03 miles
Direction: SW-NE
Address range: 1 to 99
Direction: SW-NE
Address range: 1 to 99
Greenville Park
Length: 0.02 miles
Direction: E-W
Direction: E-W
Kalada Park
Length: 0.02 miles
Direction: SW-NE
Address range: 1 to 99
Direction: SW-NE
Address range: 1 to 99
Edgewood Park
Length: 0.02 miles
Direction: SW-NE
Address range: 1 to 99
Direction: SW-NE
Address range: 1 to 99