| Fire incidents reported |
|---|
| Sreet name | Count |
|---|
| QUEEN ST | 18 | | EVERGREEN AVE | 16 | | SOUTHAMPTON AVE | 16 | | STENTON 8600-8900 AVE | 16 | | WILLOW GROVE AVE | 16 | | HULL DR | 14 | | ARDMORE AVE | 12 | | MACARTHUR RD | 12 | | NEW ST | 12 | | PAPER MILL RD | 12 | | STENTON 86008900 AVE | 12 | | DUVEEN DR | 10 | | MERMAID LN | 10 | | STENTON AVE | 10 | | IVY HILL 7171431 RD | 8 | | WILLOW GROVE 8001599 BLK AVE | 8 | | CHILDS RD | 6 | | CRESHEIM VALLEY DR | 6 | | FLOURTOWN 8000-8500 AVE | 6 | | FLOURTOWN 80008500 AVE | 6 | | FLOURTOWN AVE | 6 | | IVY HILL RD | 6 | | LOUISE LA | 6 | | PAPER MILL 7001000 EVEN RD | 6 | | WILLOW GROVE 800-1599 BLK AVE | 6 |
| | | Fire incidents reported |
|---|
| Sreet name | Count |
|---|
| AUBURN AVE | 4 | | CHELTENHAM AVE | 4 | | COBDEN 80008100 RD | 4 | | CROMWELL RD | 4 | | CURTIS TER | 4 | | GLADSTONE RD | 4 | | GRAVERS 500-700 LA | 4 | | IVY HILL 717-1431 RD | 4 | | LANTERN | 4 | | MERMAID 8001599 | 4 | | MONTGOMERY AVE | 4 | | PAPER MILL 1000-1406 EVEN RD | 4 | | PATTON 8500-8600 RD | 4 | | RIDGE PIKE | 4 | | STOTESBURY AVE | 4 | | TRUMBAUER CT | 4 | | WAINWRIGHT RD | 4 | | WIDENER RD | 4 | | WYNDMOOR (600-800 BLK) AVE | 4 | | 1413 CROMWELL ROAD | 2 | | 309 EXPRESSWAY NORTH | 2 | | 8003 SOUTHAMPTON ROAD | 2 | | 807 ABINGTON AVE | 2 | | 8309 HULL DRIVE | 2 | | 8721 PATTON ROAD | 2 |
|
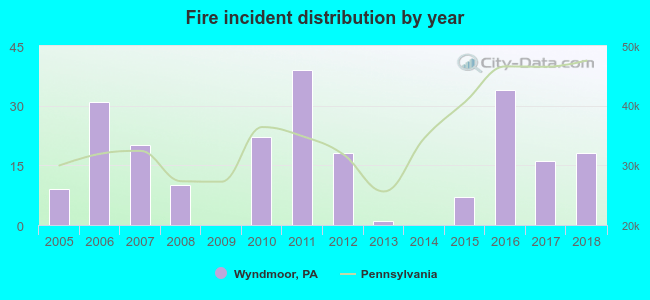 According to the data from the years 2005 - 2018 the average number of fire incidents per year is 16. The highest number of reported fires - 39 took place in 2011, and the least - 0 in 2009. The data has a growing trend.
 32.9% incidents where reported in the morning and 67.1% in the evening. The most fires (19.6%) took place on Thursday, and the least (8.4%) on Monday.
 Based on the 225 fire incidents from years 2005 - 2018 most fires (19.6%) took place during March, and the least (4.0%) in May.
 Out of all 438 cases reported during the years 2005 - 2018, the most belonged to the categories: Fire (51.4%), Good Intent Call (18.3%), and Rescue & EMS (14.6%).
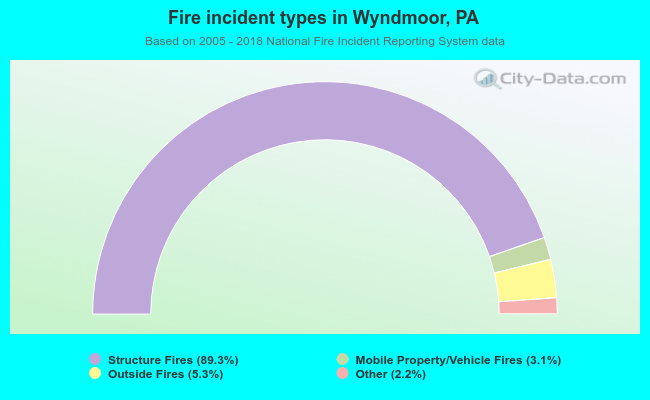 When looking into fire subcategories, the most reports belonged to: Structure Fires (89.3%), and Outside Fires (5.3%).