Fort Washington: Fire Incidents, Pennsylvania (PA)
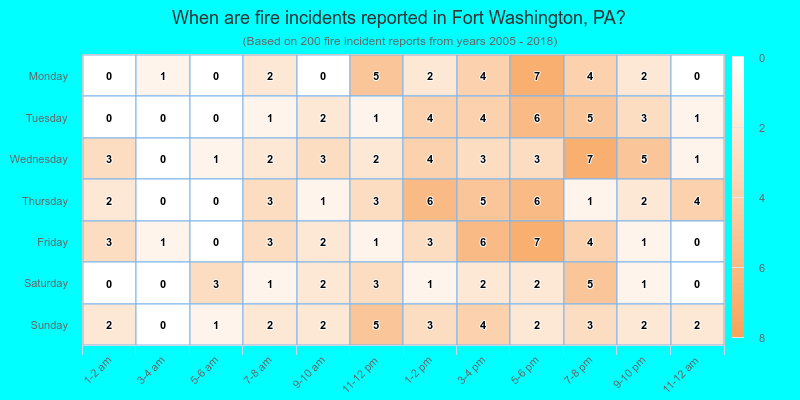
Where are fire incidents reported in Fort Washington, PA
Something went wrong! Please refresh the page.
|
| |||||||||||||||||||||||||||||||||||||||||||||||||||||||||||||||||||||||||||||||||||||||||||||||||||||||||||||
2005 - 2018 National Fire Incident Reporting System (NFIRS) incidents
- Incident types reported to NFIRS in Fort Washington, PA
- 20034.4%Fire
- 14925.6%False Alarm
- 11720.1%Hazardous Condition
- 8314.3%Good Intent Call
- 193.3%Rescue & EMS
- 132.2%Service Call
- 10.2%Severe Weather
- Fire incident types reported to NFIRS in Fort Washington, PA
- 14371.5%Structure Fires
- 2814.0%Outside Fires
- 2512.5%Mobile Property/Vehicle Fires
- 42.0%Other
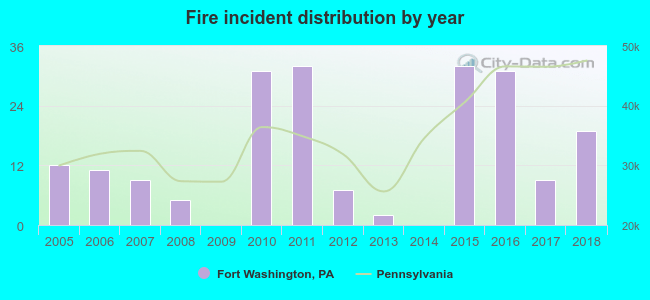 Based on the data from the years 2005 - 2018 the average number of fire incidents per year is 14. The highest number of reported fires - 32 took place in 2011, and the least - 0 in 2009. The data has an increasing trend.
The average number of yearly fire incidents per 10k residents in Fort Washington, PA compared to nearest cities:
(Note: Based on data for the last 3 years, including only cities with population 5,000 and above)
| Fort Washington: | 36.1 |
| Oreland: | 24.7 |
| Ambler: | 37.4 |
| Maple Glen: | 3.0 |
| Glenside: | 70.8 |
| Wyndmoor: | 41.2 |
| Willow Grove: | 12.9 |
| Blue Bell: | 16.5 |
| Horsham: | 23.8 |
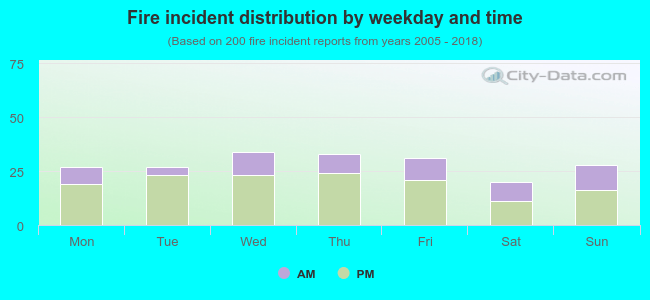 31.5% incidents where reported in the morning and 68.5% in the evening. The most fires (17.0%) took place on Wednesday, and the least (10.0%) on Saturday.
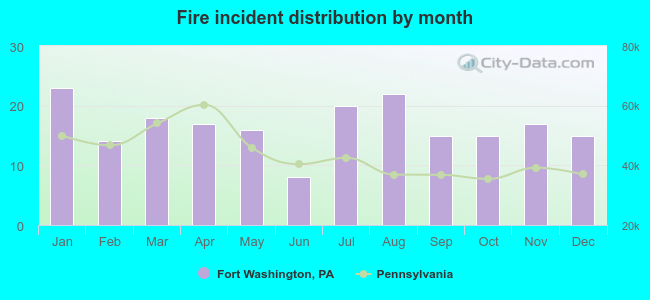 Based on the 200 fires from years 2005 - 2018 most fires (11.5%) took place during January, and the least (4.0%) in June.
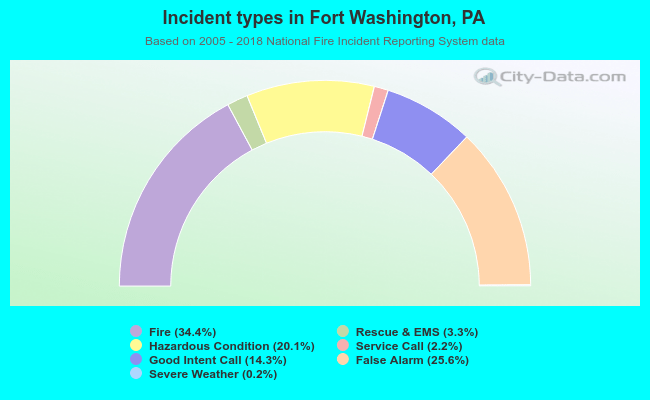 Out of all 582 cases reported during the years 2005 - 2018, the most belonged to the categories: Fire (34.4%), Good Intent Call (25.6%), and Rescue & EMS (20.1%).
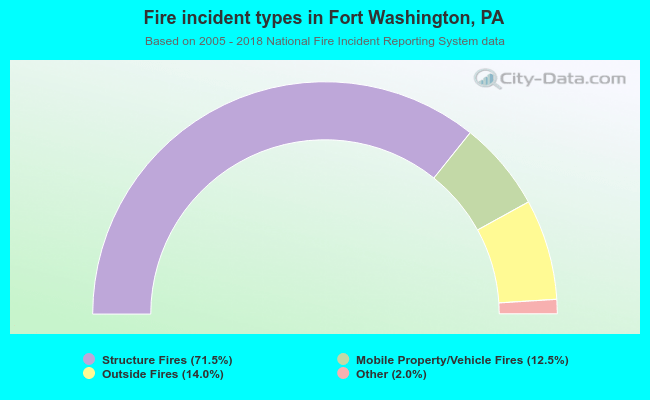 When looking into fire subcategories, the most incidents belonged to: Structure Fires (71.5%), and Outside Fires (14.0%).