Willow Grove: Fire Incidents, Pennsylvania (PA)
Where are fire incidents reported in Willow Grove, PA
Something went wrong! Please refresh the page.
|
| |||||||||||||||||||||||||||||||||||||||||||||||||||||||||||||||||||||||||||||||||||||||||||||||||||||||||||||
2003 - 2018 National Fire Incident Reporting System (NFIRS) incidents
- Incident types reported to NFIRS in Willow Grove, PA
- 43528.9%Hazardous Condition
- 39726.4%Fire
- 30420.2%False Alarm
- 15410.2%Good Intent Call
- 1016.7%Rescue & EMS
- 765.1%Service Call
- 342.3%Special Incident
- 30.2%Overpressure Rupture
- Fire incident types reported to NFIRS in Willow Grove, PA
- 21153.1%Structure Fires
- 8621.7%Outside Fires
- 6416.1%Mobile Property/Vehicle Fires
- 369.1%Other
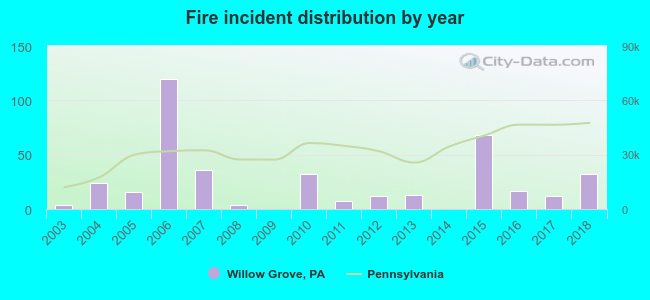 According to the data from the years 2003 - 2018 the average number of fire incidents per year is 25. The highest number of fires - 120 took place in 2006, and the least - 0 in 2009. The data has a growing trend.
The average number of yearly fire incidents per 10k residents in Willow Grove, PA compared to nearest cities:
(Note: Based on data for the last 3 years, including only cities with population 5,000 and above)
| Willow Grove: | 12.9 |
| Hatboro: | 25.1 |
| Horsham: | 23.8 |
| Glenside: | 70.8 |
| Maple Glen: | 3.0 |
| Fort Washington: | 36.1 |
| Oreland: | 24.7 |
| Ambler: | 37.4 |
| Wyndmoor: | 41.2 |

 33.2% incidents where reported in the morning and 66.8% in the evening. The most fires (16.6%) took place on Tuesday, and the least (10.3%) on Thursday.
 Based on the 397 fire incidents from years 2003 - 2018 most fires (13.6%) took place during April, and the least (3.5%) in October.
 Out of all 1,504 cases reported during the years 2003 - 2018, the most belonged to the categories: Hazardous Condition (28.9%), Fire (26.4%), and False Alarm (20.2%).
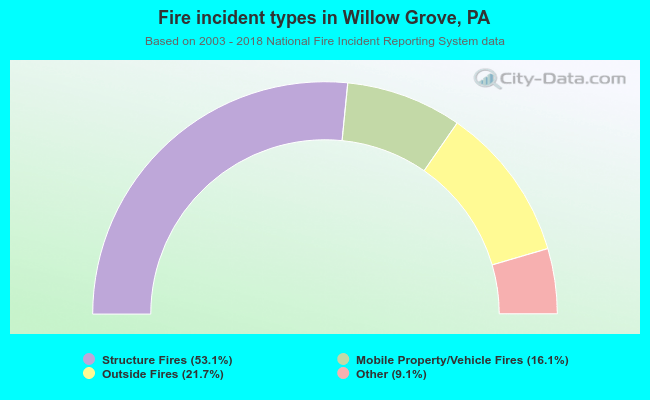 When looking into fire subcategories, the most reports belonged to: Structure Fires (53.1%), and Outside Fires (21.7%).