According to our research of Pennsylvania and other state lists, there was 1 registered sex offender living in Wyndmoor, Pennsylvania as of May 13, 2024. The ratio of all residents to sex offenders in Wyndmoor is 5,695 to 1. The ratio of registered sex offenders to all residents in this city is much lower than the state average.
Recent articles from our blog. Our writers, many of them Ph.D. graduates or candidates, create easy-to-read articles on a wide variety of topics.
Latest news from Wyndmoor, PA collected exclusively by city-data.com from local newspapers, TV, and radio stations
Ancestries: European (17.4%), Irish (10.8%), Italian (9.7%), German (8.9%), American (5.1%), English (4.1%).
Current Local Time: EST time zone
Elevation: 423 feet
Land area: 1.65 square miles.
Population density: 3,330 people per square mile (average).
265 residents are foreign born (2.0% Europe, 1.3% Asia, 1.0% Latin America).
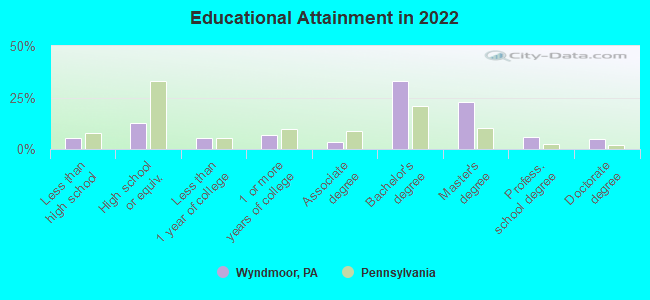
This place:
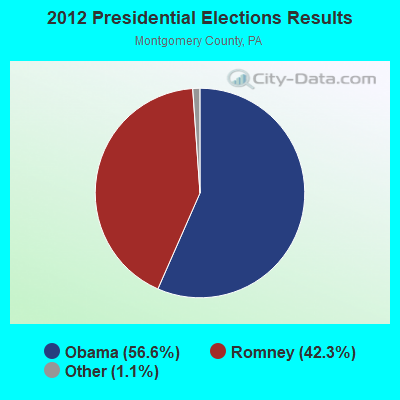
4.6%
Pennsylvania:
7.3%
Median real estate property taxes paid for housing units with mortgages in 2022: $6,760 (1.4%) Median real estate property taxes paid for housing units with no mortgage in 2022: $6,447 (1.2%)
Nearest city with pop. 50,000+: Philadelphia, PA (6.4 miles , pop. 1,517,550).
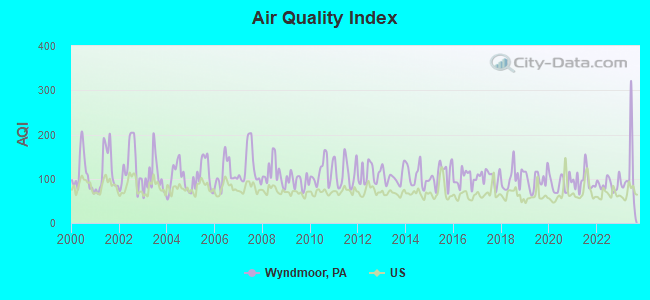
Air Quality Index (AQI) level in 2023 was 111. This is significantly worse than average.
City:
111
U.S.:
73
Carbon Monoxide (CO) [ppm] level in 2022 was 0.381. This is significantly worse than average.Closest monitor was 3.5 miles away from the city center.
City:
0.381
U.S.:
0.251
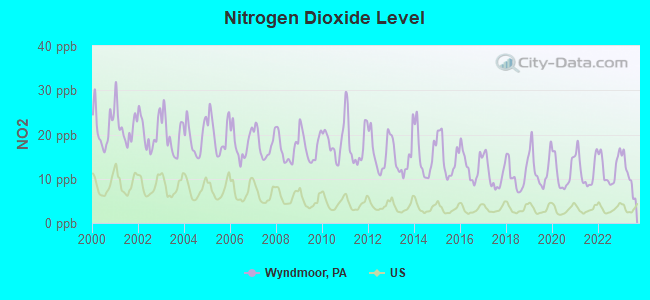
Nitrogen Dioxide (NO2) [ppb] level in 2023 was 10.8. This is significantly worse than average.Closest monitor was 5.4 miles away from the city center.
City:
10.8
U.S.:
5.1
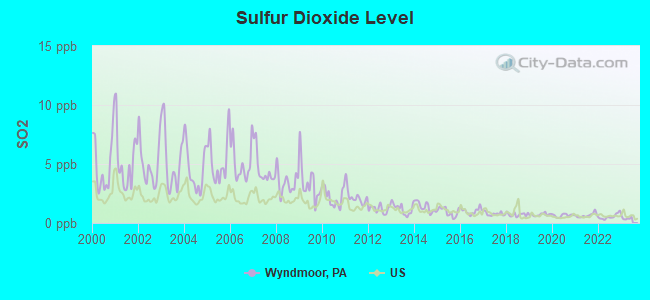
Sulfur Dioxide (SO2) [ppb] level in 2022 was 0.543. This is significantly better than average.Closest monitor was 3.5 miles away from the city center.
City:
0.543
U.S.:
1.515
Ozone [ppb] level in 2023 was 30.1. This is about average.Closest monitor was 3.5 miles away from the city center.
City:
30.1
U.S.:
33.3
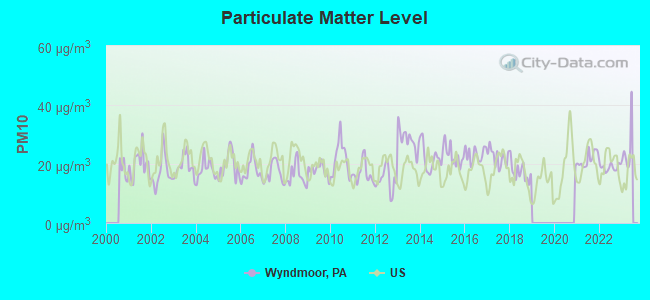
Particulate Matter (PM10) [µg/m3] level in 2022 was 18.9. This is about average.Closest monitor was 6.5 miles away from the city center.
City:
18.9
U.S.:
19.2
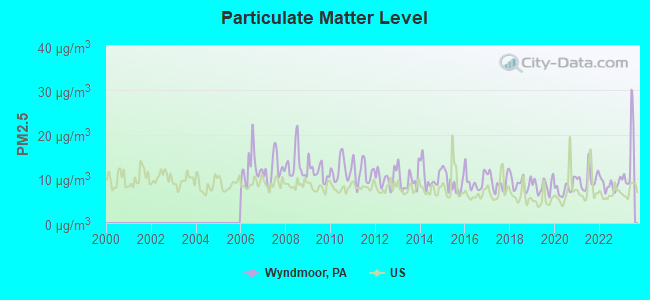
Particulate Matter (PM2.5) [µg/m3] level in 2023 was 14.4. This is significantly worse than average.Closest monitor was 3.5 miles away from the city center.
City:
14.4
U.S.:
8.1
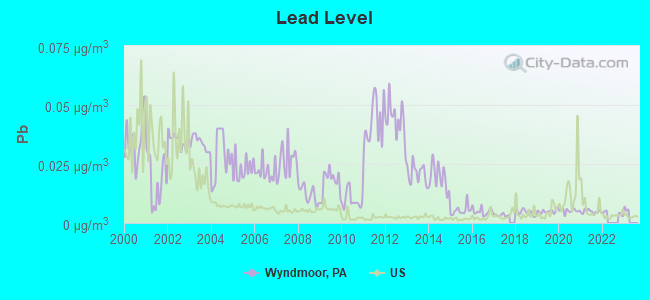
Lead (Pb) [µg/m3] level in 2021 was 0.00485. This is significantly better than average.Closest monitor was 4.3 miles away from the city center.
City:
0.00485
U.S.:
0.00931
Tornado activity:
Wyndmoor-area historical tornado activity is slightly above Pennsylvania state average. It is 0% smaller than the overall U.S. average.
On 3/22/1955, a category F3 (max. wind speeds 158-206 mph) tornado 14.9 miles away from the Wyndmoor place center killed one personand causedbetween $50,000 and $500,000 in damages.
On 7/27/1994, a category F3 tornado 20.1 miles away from the place center killed 3 peopleand injured 25 peopleand causedbetween $5,000,000 and $50,000,000 in damages.
Earthquake activity:
Wyndmoor-area historical earthquake activity is significantly above Pennsylvania state average. It is 65% smaller than the overall U.S. average.
On 8/23/2011 at 17:51:04, a magnitude 5.8 (5.8 MW, Depth: 3.7 mi, Class: Moderate, Intensity: VI - VII) earthquake occurred 210.6 miles away from Wyndmoor center On 1/16/1994 at 01:49:16, a magnitude 4.6 (4.6 MB, 4.6 LG, Depth: 3.1 mi, Class: Light, Intensity: IV - V) earthquake occurred 47.8 miles away from Wyndmoor center On 1/16/1994 at 00:42:43, a magnitude 4.2 (4.2 MB, 4.0 LG, Depth: 3.1 mi) earthquake occurred 46.3 miles away from the city center On 10/7/1983 at 10:18:46, a magnitude 5.3 (5.1 MB, 5.3 LG, 5.1 ML) earthquake occurred 271.2 miles away from Wyndmoor center On 11/30/2017 at 21:47:31, a magnitude 4.1 (4.1 MW, Depth: 6.1 mi) earthquake occurred 62.5 miles away from the city center On 9/25/1998 at 19:52:52, a magnitude 5.2 (4.8 MB, 4.3 MS, 5.2 LG, 4.5 MW, Depth: 3.1 mi) earthquake occurred 289.4 miles away from Wyndmoor center Magnitude types: regional Lg-wave magnitude (LG), body-wave magnitude (MB), local magnitude (ML), surface-wave magnitude (MS), moment magnitude (MW)
Natural disasters:
The number of natural disasters in Montgomery County (26) is a lot greater than the US average (15). Major Disasters (Presidential) Declared: 20 Emergencies Declared: 6
Causes of natural disasters: Hurricanes: 7, Floods: 5, Winter Storms: 5, Storms: 4, Tropical Storms: 4, Snowstorms: 3, Blizzard: 1, Mudslide: 1, Snowfall: 1, Tropical Depression: 1, Water Shortage: 1, Other: 1 (Note: some incidents may be assigned to more than one category).
Hospitals and medical centers in Wyndmoor:
KEYSTONE CARE, LLC (8765 STENTON AVENUE)
CHESTNUT HILL LODGE HEALTH AND REHAB CTR (8833 STENTON AVENUE)
REST HAVEN NSG/CHESTNUT HILL (8833 STENTON AVE)
WYNDMOOR HILLS HEALTH CARE AND REHAB CENTER (8601 STENTON AVENUE)
Amtrak stations near Wyndmoor:
7 miles: NORTH PHILADELPHIA (PHILADELPHIA, 2900 N. BROAD ST.) . Services: ticket office, fully wheelchair accessible, enclosed waiting area, public restrooms, public payphones, paid short-term parking, paid long-term parking, call for taxi service, public transit connection.
8 miles: ARDMORE (STATION RD. & LANCASTER AVE.) . Services: enclosed waiting area, public restrooms, public payphones, paid short-term parking, call for car rental service, call for taxi service, public transit connection.
9 miles: PHILADELPHIA (30TH & MARKET STS.) . Services: ticket office, fully wheelchair accessible, enclosed waiting area, public restrooms, public payphones, snack bar, ATM, paid short-term parking, paid long-term parking, car rental agency, taxi stand, public transit connection.
Colleges/universities with over 2000 students nearest to Wyndmoor:
Arcadia University (about 2 miles; Glenside, PA; Full-time enrollment: 3,542)
La Salle University (about 4 miles; Philadelphia, PA; FT enrollment: 5,318)
Philadelphia University (about 5 miles; Philadelphia, PA; FT enrollment: 3,629)
Pennsylvania State University-Penn State Abington (about 5 miles; Abington, PA; FT enrollment: 3,155)
Saint Joseph's University (about 7 miles; Philadelphia, PA; FT enrollment: 7,329)
Temple University (about 8 miles; Philadelphia, PA; FT enrollment: 30,016)
Montgomery County Community College (about 8 miles; Blue Bell, PA; FT enrollment: 8,723)
Private high school in Wyndmoor:
LA SALLE COLLEGE HIGH SCHOOL (Students: 1,066, Location: 8605 CHELTENHAM AVE, Grades: 9-12, Boys only)
Private elementary/middle schools in Wyndmoor:
REGINA COELI ACADEMY (Students: 55, Location: 1108 E WILLOW GROVE AVE, Grades: PK-8)
EVAN THOMAS INSTITUTE (Students: 13, Location: 8801 STENTON AVE, Grades: 1-8)
Library in Wyndmoor:
FR LIB OF SPRINGFIELD TWNSHP (Operating income: $655,021; Location: 1600 PAPER MILL RD; 48,225 books; 732 audio materials; 896 video materials; 2 local licensed databases; 41 state licensed databases; 5 other licensed databases; 93 print serial subscriptions; 1 electronic serial subscriptions)
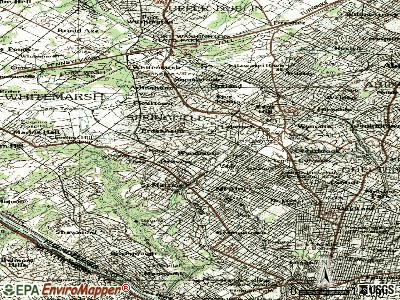
Notable locations in Wyndmoor: United States Dept of Agriculture Research Center (A), Whitemarsh Research Lab (B), Chestnut Hill Rehabilitation Center (C), Wyndmoor Hose Company 1 Station 82 (D). Display/hide their locations on the map
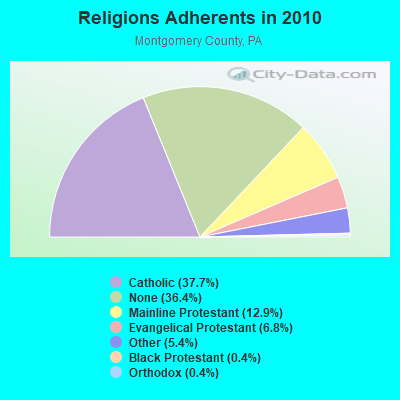
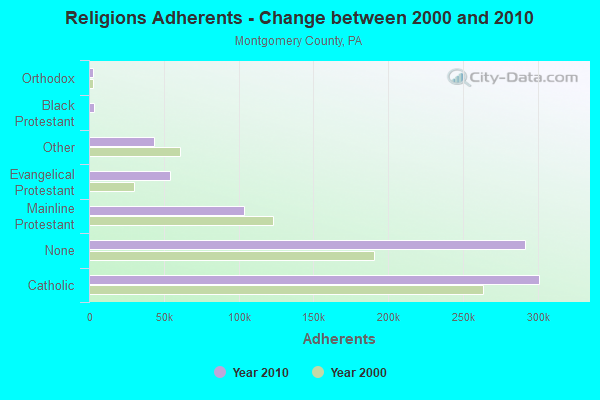
Religion statistics for Wyndmoor, PA (based on Montgomery County data)
Religion
Adherents
Congregations
Catholic
301,220
55
Mainline Protestant
103,475
221
Evangelical Protestant
54,215
269
Other
43,532
68
Black Protestant
3,190
11
Orthodox
2,945
9
None
291,297
-
Source: Clifford Grammich, Kirk Hadaway, Richard Houseal, Dale E.Jones, Alexei Krindatch, Richie Stanley and Richard H.Taylor. 2012. 2010 U.S.Religion Census: Religious Congregations & Membership Study. Association of Statisticians of American Religious Bodies. Jones, Dale E., et al. 2002. Congregations and Membership in the United States 2000. Nashville, TN: Glenmary Research Center. Graphs represent county-level data
Aircraft: PIPER PA-28-140 (Category: Land, Seats: 4, Weight: Up to 12,499 Pounds, Speed: 107 mph), Engine: LYCOMING 0-320 SERIES (180 HP) (Reciprocating) N-Number: 5977U, N5977U, N-5977U, Serial Number: 28-26862, Year manufactured: 1970, Airworthiness Date: 04/29/1970, Certificate Issue Date: 08/05/1991 Registrant (Co-Owned): Robert H Morrow, 8811 Wainwright Rd, Wyndmoor, PA 19038, Other Owners: William W Lentz
Home Mortgage Disclosure Act Aggregated Statistics For Year 2009 (Based on 1 full and 1 partial tracts)
A) FHA, FSA/RHS & VA Home Purchase Loans
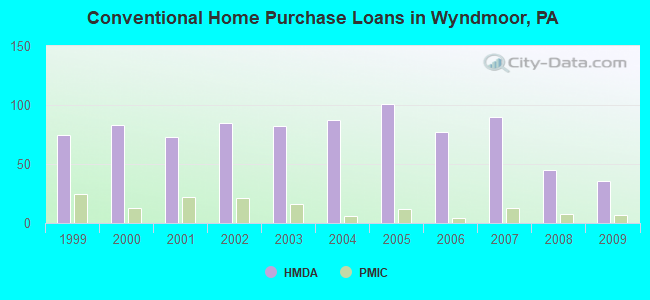
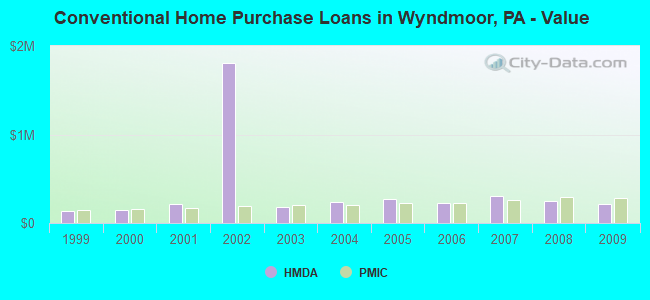
B) Conventional Home Purchase Loans
C) Refinancings
D) Home Improvement Loans
F) Non-occupant Loans on < 5 Family Dwellings (A B C & D)
Number
Average Value
Number
Average Value
Number
Average Value
Number
Average Value
Number
Average Value
LOANS ORIGINATED
15
$219,791
36
$215,106
187
$259,131
13
$91,448
5
$195,768
APPLICATIONS APPROVED, NOT ACCEPTED
0
$0
4
$230,000
14
$304,037
1
$13,000
1
$110,000
APPLICATIONS DENIED
1
$244,000
0
$0
38
$257,069
8
$74,742
3
$201,367
APPLICATIONS WITHDRAWN
0
$0
3
$214,810
45
$256,633
2
$171,200
1
$235,000
FILES CLOSED FOR INCOMPLETENESS
0
$0
1
$428,970
8
$258,996
1
$205,440
0
$0
Aggregated Statistics For Year 2008 (Based on 1 full and 1 partial tracts)
A) FHA, FSA/RHS & VA Home Purchase Loans
B) Conventional Home Purchase Loans
C) Refinancings
D) Home Improvement Loans
F) Non-occupant Loans on < 5 Family Dwellings (A B C & D)
Number
Average Value
Number
Average Value
Number
Average Value
Number
Average Value
Number
Average Value
LOANS ORIGINATED
11
$246,390
45
$248,689
100
$228,065
22
$76,586
10
$204,354
APPLICATIONS APPROVED, NOT ACCEPTED
1
$272,000
4
$236,552
18
$219,250
6
$95,395
1
$254,040
APPLICATIONS DENIED
0
$0
4
$246,578
46
$217,396
22
$118,219
9
$150,778
APPLICATIONS WITHDRAWN
1
$260,840
5
$275,558
25
$201,994
2
$22,500
1
$280,070
FILES CLOSED FOR INCOMPLETENESS
1
$205,000
0
$0
6
$208,957
2
$110,940
0
$0
Aggregated Statistics For Year 2007 (Based on 1 full and 1 partial tracts)
A) FHA, FSA/RHS & VA Home Purchase Loans
B) Conventional Home Purchase Loans
C) Refinancings
D) Home Improvement Loans
F) Non-occupant Loans on < 5 Family Dwellings (A B C & D)
Number
Average Value
Number
Average Value
Number
Average Value
Number
Average Value
Number
Average Value
LOANS ORIGINATED
2
$243,635
90
$299,833
94
$255,979
30
$57,191
12
$175,855
APPLICATIONS APPROVED, NOT ACCEPTED
0
$0
6
$286,568
22
$196,186
9
$94,863
2
$218,000
APPLICATIONS DENIED
0
$0
6
$255,985
46
$283,077
16
$37,996
3
$174,093
APPLICATIONS WITHDRAWN
0
$0
8
$217,096
19
$204,240
1
$43,540
0
$0
FILES CLOSED FOR INCOMPLETENESS
0
$0
2
$118,055
9
$294,101
0
$0
0
$0
Aggregated Statistics For Year 2006 (Based on 1 full and 1 partial tracts)
A) FHA, FSA/RHS & VA Home Purchase Loans
B) Conventional Home Purchase Loans
C) Refinancings
D) Home Improvement Loans
F) Non-occupant Loans on < 5 Family Dwellings (A B C & D)
G) Loans On Manufactured Home Dwelling (A B C & D)
Number
Average Value
Number
Average Value
Number
Average Value
Number
Average Value
Number
Average Value
Number
Average Value
LOANS ORIGINATED
1
$218,000
77
$230,424
94
$191,769
36
$115,294
5
$164,406
0
$0
APPLICATIONS APPROVED, NOT ACCEPTED
0
$0
9
$276,779
28
$114,897
10
$88,544
2
$114,170
0
$0
APPLICATIONS DENIED
0
$0
11
$256,617
48
$185,116
22
$66,620
4
$104,745
1
$25,000
APPLICATIONS WITHDRAWN
0
$0
6
$258,010
30
$184,531
2
$154,270
2
$180,790
0
$0
FILES CLOSED FOR INCOMPLETENESS
0
$0
1
$45,000
8
$222,129
0
$0
0
$0
0
$0
Aggregated Statistics For Year 2005 (Based on 1 full and 1 partial tracts)
B) Conventional Home Purchase Loans
C) Refinancings
D) Home Improvement Loans
F) Non-occupant Loans on < 5 Family Dwellings (A B C & D)
Number
Average Value
Number
Average Value
Number
Average Value
Number
Average Value
LOANS ORIGINATED
101
$275,033
135
$205,726
43
$62,862
12
$159,148
APPLICATIONS APPROVED, NOT ACCEPTED
4
$302,178
22
$148,981
10
$94,946
0
$0
APPLICATIONS DENIED
12
$347,561
61
$186,968
18
$76,740
4
$52,740
APPLICATIONS WITHDRAWN
14
$261,101
45
$241,411
5
$166,160
1
$125,050
FILES CLOSED FOR INCOMPLETENESS
2
$171,765
16
$226,556
1
$220,000
0
$0
Aggregated Statistics For Year 2004 (Based on 1 full and 1 partial tracts)
A) FHA, FSA/RHS & VA Home Purchase Loans
B) Conventional Home Purchase Loans
C) Refinancings
D) Home Improvement Loans
F) Non-occupant Loans on < 5 Family Dwellings (A B C & D)
Number
Average Value
Number
Average Value
Number
Average Value
Number
Average Value
Number
Average Value
LOANS ORIGINATED
1
$139,550
87
$237,581
135
$180,544
30
$98,837
12
$192,037
APPLICATIONS APPROVED, NOT ACCEPTED
0
$0
10
$216,591
29
$169,855
12
$67,648
1
$98,000
APPLICATIONS DENIED
0
$0
4
$147,822
53
$192,641
16
$54,961
11
$119,455
APPLICATIONS WITHDRAWN
0
$0
7
$217,457
32
$193,053
3
$165,153
0
$0
FILES CLOSED FOR INCOMPLETENESS
0
$0
2
$215,235
18
$240,790
1
$23,000
0
$0
Aggregated Statistics For Year 2003 (Based on 1 full and 1 partial tracts)
A) FHA, FSA/RHS & VA Home Purchase Loans
B) Conventional Home Purchase Loans
C) Refinancings
D) Home Improvement Loans
F) Non-occupant Loans on < 5 Family Dwellings (A B C & D)
Number
Average Value
Number
Average Value
Number
Average Value
Number
Average Value
Number
Average Value
LOANS ORIGINATED
4
$151,500
82
$182,912
436
$180,351
30
$113,631
16
$147,566
APPLICATIONS APPROVED, NOT ACCEPTED
1
$136,000
14
$220,140
56
$175,842
11
$50,273
2
$128,350
APPLICATIONS DENIED
1
$139,000
7
$156,461
84
$215,492
18
$48,791
3
$186,180
APPLICATIONS WITHDRAWN
0
$0
9
$179,599
42
$148,910
0
$0
0
$0
FILES CLOSED FOR INCOMPLETENESS
0
$0
6
$270,088
15
$164,414
2
$66,530
0
$0
Aggregated Statistics For Year 2002 (Based on 1 full and 1 partial tracts)
A) FHA, FSA/RHS & VA Home Purchase Loans
B) Conventional Home Purchase Loans
C) Refinancings
D) Home Improvement Loans
F) Non-occupant Loans on < 5 Family Dwellings (A B C & D)
Number
Average Value
Number
Average Value
Number
Average Value
Number
Average Value
Number
Average Value
LOANS ORIGINATED
7
$675,469
85
$1,812,617
244
$965,508
16
$46,175
7
$11,529,110
APPLICATIONS APPROVED, NOT ACCEPTED
0
$0
5
$151,020
39
$183,731
7
$52,720
0
$0
APPLICATIONS DENIED
0
$0
4
$186,280
70
$145,065
6
$28,367
1
$98,060
APPLICATIONS WITHDRAWN
0
$0
9
$206,788
41
$784,577
3
$15,000
0
$0
FILES CLOSED FOR INCOMPLETENESS
0
$0
3
$168,590
12
$228,507
0
$0
0
$0
Aggregated Statistics For Year 2001 (Based on 1 full and 1 partial tracts)
A) FHA, FSA/RHS & VA Home Purchase Loans
B) Conventional Home Purchase Loans
C) Refinancings
D) Home Improvement Loans
F) Non-occupant Loans on < 5 Family Dwellings (A B C & D)
Number
Average Value
Number
Average Value
Number
Average Value
Number
Average Value
Number
Average Value
LOANS ORIGINATED
9
$133,614
73
$210,274
145
$168,826
28
$36,072
11
$189,520
APPLICATIONS APPROVED, NOT ACCEPTED
0
$0
2
$228,065
23
$133,650
4
$16,588
0
$0
APPLICATIONS DENIED
0
$0
4
$191,738
61
$124,932
21
$29,893
0
$0
APPLICATIONS WITHDRAWN
0
$0
4
$228,988
26
$135,339
5
$31,652
2
$123,885
FILES CLOSED FOR INCOMPLETENESS
0
$0
0
$0
11
$170,817
4
$26,108
0
$0
Aggregated Statistics For Year 2000 (Based on 1 full and 1 partial tracts)
A) FHA, FSA/RHS & VA Home Purchase Loans
B) Conventional Home Purchase Loans
C) Refinancings
D) Home Improvement Loans
F) Non-occupant Loans on < 5 Family Dwellings (A B C & D)
Number
Average Value
Number
Average Value
Number
Average Value
Number
Average Value
Number
Average Value
LOANS ORIGINATED
13
$129,551
83
$145,073
28
$105,378
26
$36,988
2
$93,590
APPLICATIONS APPROVED, NOT ACCEPTED
0
$0
11
$156,664
16
$120,059
15
$45,885
1
$140,000
APPLICATIONS DENIED
1
$160,000
11
$124,073
28
$98,471
14
$69,781
1
$100,000
APPLICATIONS WITHDRAWN
0
$0
13
$110,465
21
$80,395
11
$41,653
0
$0
FILES CLOSED FOR INCOMPLETENESS
0
$0
0
$0
4
$111,770
0
$0
0
$0
Aggregated Statistics For Year 1999 (Based on 1 full and 1 partial tracts)
A) FHA, FSA/RHS & VA Home Purchase Loans
B) Conventional Home Purchase Loans
C) Refinancings
D) Home Improvement Loans
F) Non-occupant Loans on < 5 Family Dwellings (A B C & D)
Detailed PMIC statistics for the following Tracts:2104.00
, 2105.00
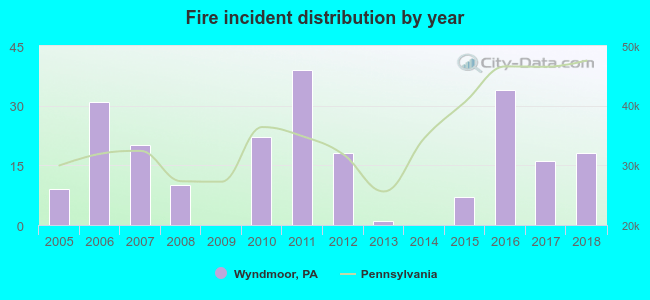
2005 - 2018 National Fire Incident Reporting System (NFIRS) incidents
Based on the data from the years 2005 - 2018 the average number of fires per year is 16. The highest number of fire incidents - 39 took place in 2011, and the least - 0 in 2009. The data has a rising trend.
When looking into fire subcategories, the most incidents belonged to: Structure Fires (89.3%), and Outside Fires (5.3%).
Fire incident types reported to NFIRS in Wyndmoor, PA
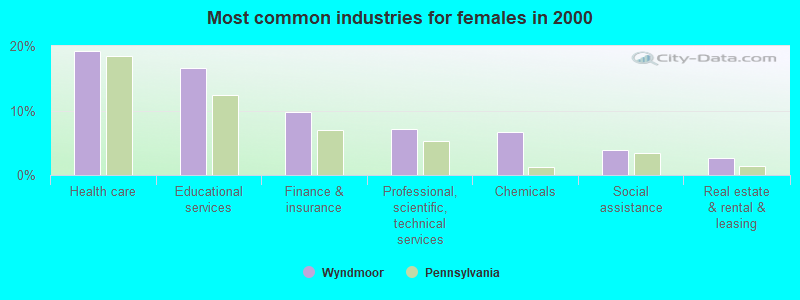
#9 on the list of "Top 101 cities with largest percentage of females in occupations: health diagnosing and treating practitioners and other technical occupations (population 5,000+)"
#34 on the list of "Top 101 cities with the largest percentage of likely lesbian couples (counted as self-reported female-female unmarried-partner households) (population 5,000+)"
#39 on the list of "Top 101 cities with the largest percentage of people in hospices or homes for chronically ill (population 1,000+)"
#51 on the list of "Top 101 cities with the most people taking subway or elevated to work (population 5,000+)"
#81 on the list of "Top 101 cities with the largest percentage of likely homosexual households (counted as self-reported same-sex unmarried-partner households) (population 5,000+)"
#84 on the list of "Top 101 cities with largest percentage of females in occupations: life, physical, and social science occupations (population 5,000+)"
#13 on the list of "Top 101 counties with the most Mainline Protestant adherents"
#15 on the list of "Top 101 counties with the most Mainline Protestant congregations"
#28 on the list of "Top 101 counties with the lowest average weight of females"
#30 on the list of "Top 101 counties with the largest number of people without health insurance coverage in 2000 (pop. 50,000+)"
#37 on the list of "Top 101 counties with the most Catholic adherents"


 Recent articles from our blog. Our writers, many of them Ph.D. graduates or candidates, create easy-to-read articles on a wide variety of topics.

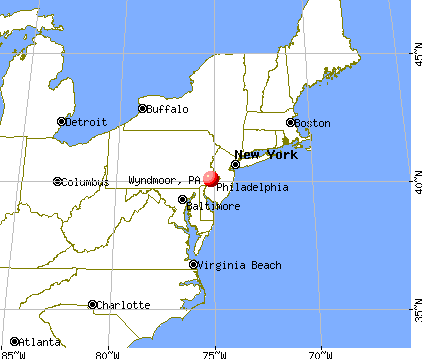
 (6.4 miles


 Based on the data from the years 2005 - 2018 the average number of fires per year is 16. The highest number of fire incidents - 39 took place in 2011, and the least - 0 in 2009. The data has a rising trend.
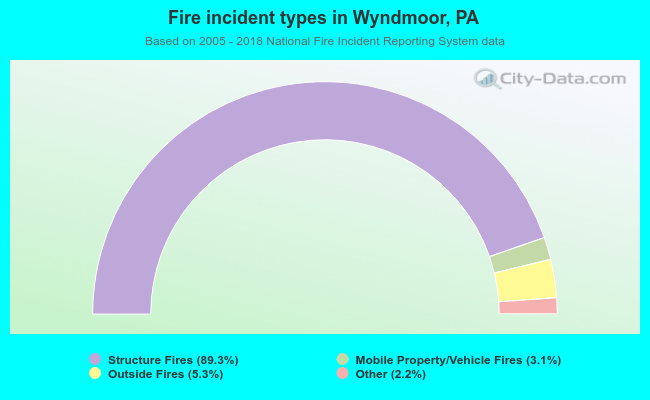 When looking into fire subcategories, the most incidents belonged to: Structure Fires (89.3%), and Outside Fires (5.3%).