Philadelphia County, Pennsylvania (PA)
County owner-occupied free and clear houses and condos in 2010: 112,806
County owner-occupied houses and condos in 2000: 349,651
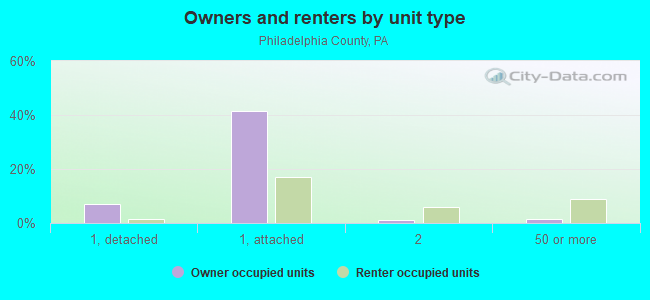
Renter-occupied apartments: 275,200 (it was 240,420 in 2000)
| % of renters here: | 41% |
| State: | 30% |
Land area: 135 sq. mi.
Water area: 7.5 sq. mi.
Population density: 11602 people per square mile (very high).
Industries providing employment: Educational, health and social services (32.9%), Professional, scientific, management, administrative, and waste management services (13.1%).
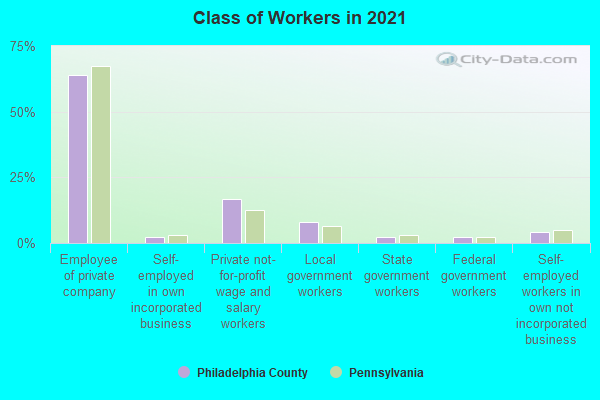
Type of workers:
- Private wage or salary: 82%
- Government: 13%
- Self-employed, not incorporated: 5%
- Unpaid family work: 0%
- OSM Map
- General Map
- Google Map
- MSN Map

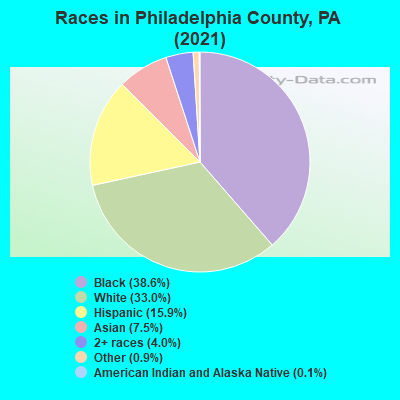
- 605,16038.6%Black Non-Hispanic Alone
- 516,64733.0%White Non-Hispanic Alone
- 252,37416.1%Hispanic or Latino
- 122,4437.8%Asian alone
- 55,1583.5%Two or more races
- 13,1220.8%Some other race alone
- 1,9230.1%American Indian and Alaska Native alone
- 4310.03%Native Hawaiian and Other
Pacific Islander alone
| Median resident age: | 35.1 years |
| Pennsylvania median age: | 40.9 years |
| Males: 743,296 | |
| Females: 823,962 |

 | Tolls on PA insterstate bridges (62 replies) |
| What Towns do you think Philadelphia Should Annex? (30 replies) |
| Philadelphia is gaining young college graduates faster than other U.S. cities (26 replies) |
| Official Greater Philadelphia Area Crime Thread (5461 replies) |
| Moving to Philly area, need suggestions (16 replies) |
| What are the chances of Trump winning Pennsylvania again in 2020 Election? (267 replies) |
| Philadelphia County: | 2.0 people |
| Pennsylvania: | 2 people |
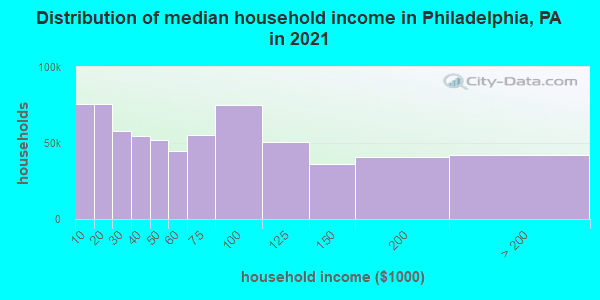
Estimated median household income in 2022: $56,517 ($30,746 in 1999)
| This county: | $56,517 |
| Pennsylvania: | $71,798 |
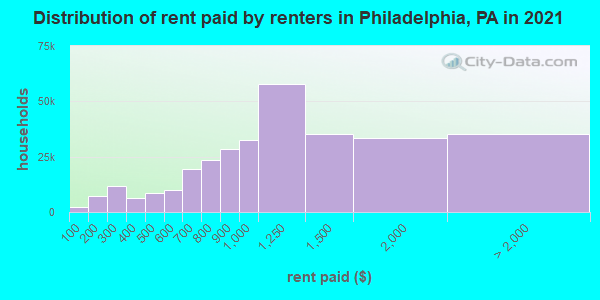
Median contract rent in 2022 for apartments: $1,073 (lower quartile is $767, upper quartile is $1,456)
| This county: | $1073 |
| State: | $922 |
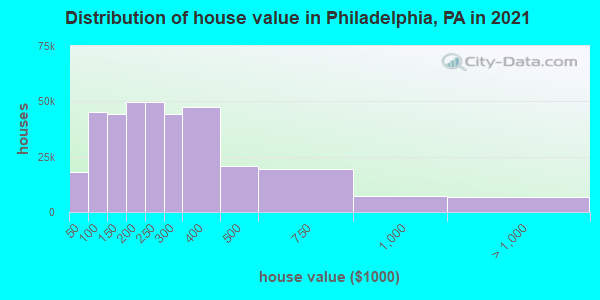
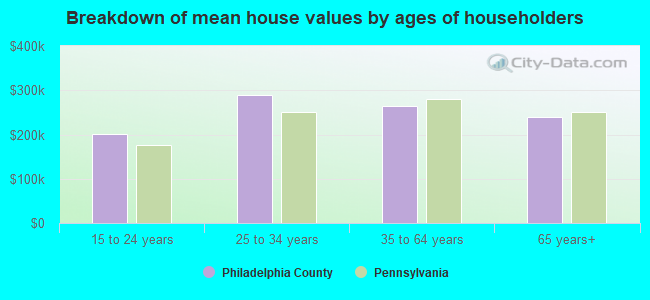
Estimated median house or condo value in 2022: $237,900 (it was $61,000 in 2000)
| Philadelphia: | $237,900 |
| Pennsylvania: | $245,500 |
Mean price in 2022:
Median monthly housing costs for homes and condos with a mortgage: $1,491Detached houses: $369,084
Here: $369,084 State: $317,202 Townhouses or other attached units: $263,189
Here: $263,189 State: $254,369 In 2-unit structures: $310,917
Here: $310,917 State: $249,182 In 3-to-4-unit structures: $376,535
Here: $376,535 State: $297,446 In 5-or-more-unit structures: $460,659
Here: $460,659 State: $320,068 Mobile homes: $86,054
Here: $86,054 State: $92,414 Occupied boats, RVs, vans, etc.: $208,222
Here: $208,222 State: $563,750
Median monthly housing costs for units without a mortgage: $507
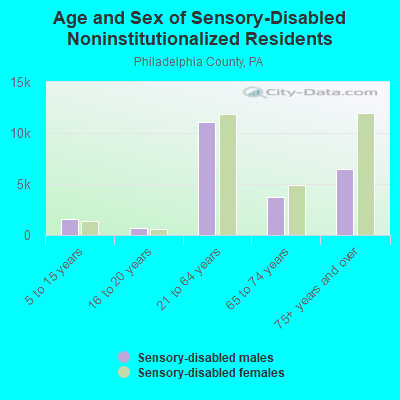
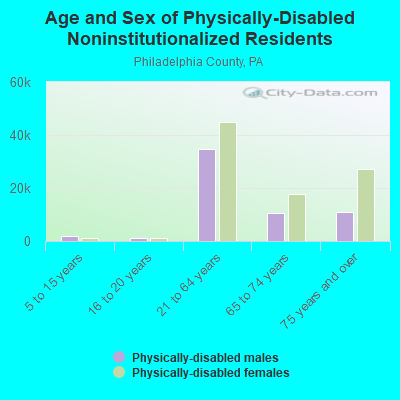
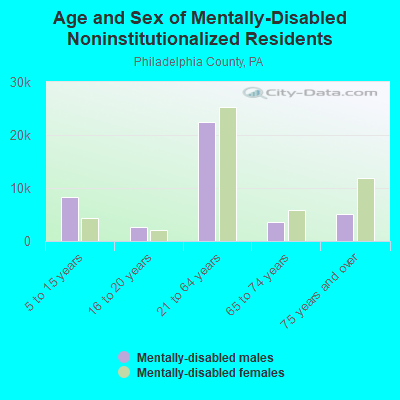
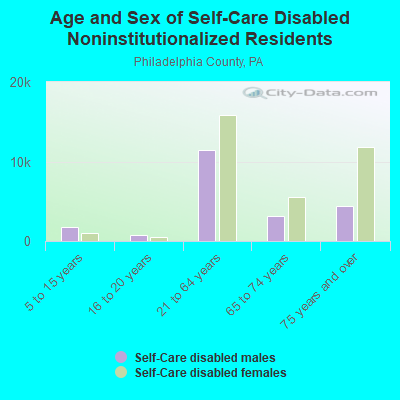
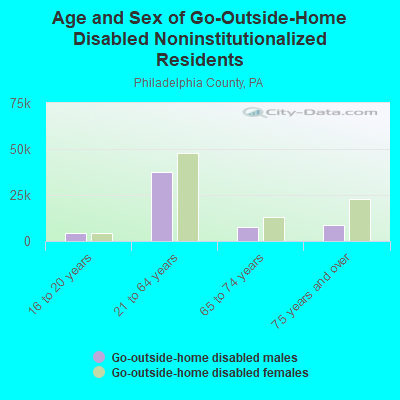
Institutionalized population: 19,376
Health of residents in Philadelphia County based on CDC Behavioral Risk Factor Surveillance System Survey Questionnaires from 2003 to 2012:
General health status score of residents in this county from 1 (poor) to 5 (excellent) is 3.3. This is significantly worse than average.68.1% of residents exercised in the past month. This is less than average.
50.3% of residents smoked 100+ cigarettes in their lives. This is about average.
73.8% of adult residents drank alcohol in the past 30 days. This is about average.
62.2% of residents visited a dentist within the past year. This is less than average.
Average weight of males is 192 pounds. This is about average.
Average weight of females is 168 pounds. This is more than average.
8.5% of residents keep firearms around their homes. This is less than average.
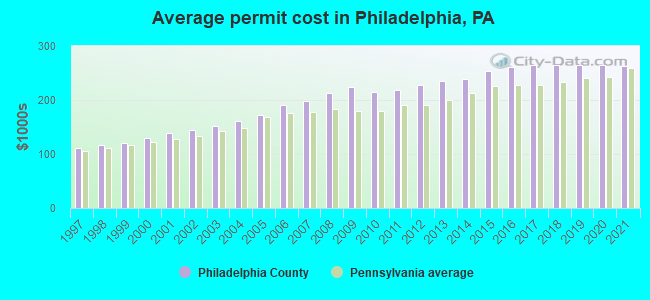
Single-family new house construction building permits:
- 2022: 478 buildings, average cost: $288,300
- 2021: 1553 buildings, average cost: $263,000
- 2020: 983 buildings, average cost: $264,500
- 2019: 894 buildings, average cost: $263,800
- 2018: 683 buildings, average cost: $265,200
- 2017: 783 buildings, average cost: $265,300
- 2016: 904 buildings, average cost: $261,200
- 2015: 822 buildings, average cost: $253,800
- 2014: 756 buildings, average cost: $238,100
- 2013: 632 buildings, average cost: $234,600
- 2012: 566 buildings, average cost: $226,600
- 2011: 445 buildings, average cost: $217,900
- 2010: 447 buildings, average cost: $214,900
- 2009: 291 buildings, average cost: $224,200
- 2008: 545 buildings, average cost: $212,900
- 2007: 591 buildings, average cost: $199,000
- 2006: 448 buildings, average cost: $191,100
- 2005: 383 buildings, average cost: $171,800
- 2004: 134 buildings, average cost: $161,400
- 2003: 128 buildings, average cost: $152,000
- 2002: 147 buildings, average cost: $144,000
- 2001: 104 buildings, average cost: $138,200
- 2000: 95 buildings, average cost: $128,600
- 1999: 97 buildings, average cost: $121,000
- 1998: 40 buildings, average cost: $115,800
- 1997: 50 buildings, average cost: $112,400

Median real estate property taxes paid for housing units with mortgages in 2022: $1,967 (0.8%)
Median real estate property taxes paid for housing units with no mortgage in 2022: $1,469 (0.7%)
| Philadelphia County: | 21.7% |
| Pennsylvania: | 11.8% |
Median age of residents in 2022: 35.1 years old
(Males: 34.1 years old, Females: 36.3 years old)
(Median age for: White residents: 38.4 years old, Black residents: 35.0 years old, American Indian residents: 29.2 years old, Asian residents: 35.4 years old, Hispanic or Latino residents: 28.7 years old, Other race residents: 32.3 years old)
Area name: Philadelphia-Camden-Wilmington, PA-NJ-DE-MD MSA
Fair market rent in 2006 for a 1-bedroom apartment in Philadelphia County is $742 a month.
Fair market rent for a 2-bedroom apartment is $886 a month.
Fair market rent for a 3-bedroom apartment is $1061 a month.
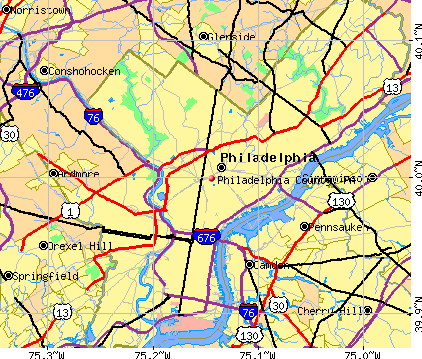
Cities in this county include: Philadelphia.
2023 air pollution in Philadelphia County:
Carbon Monoxide: 0.339 ppm (standard limit: 9 ppm). Above U.S. average.
Nitrogen Dioxide: 0.01 ppm (standard limit: 0.053 ppm). Above U.S. average.
Ozone (1-hour): 0.027 ppm (standard limit: 0.12 ppm). Below U.S. average.
Particulate Matter (PM10) Annual: 25.3 µg/m3. Near U.S. average.
Particulate Matter (PM2.5) Annual: 12.8 µg/m3(standard limit: 15.0 µg/m3). Above U.S. average.
Sulfur Oxides Annual: 0.000 ppm (standard limit: 0.03 ppm). Near U.S. average.
Neighboring counties: Brooke County, West Virginia  , Champaign County, Ohio , Clark County, Ohio , Utah County, Utah , Sangamon County, Illinois , Scott County, Illinois .
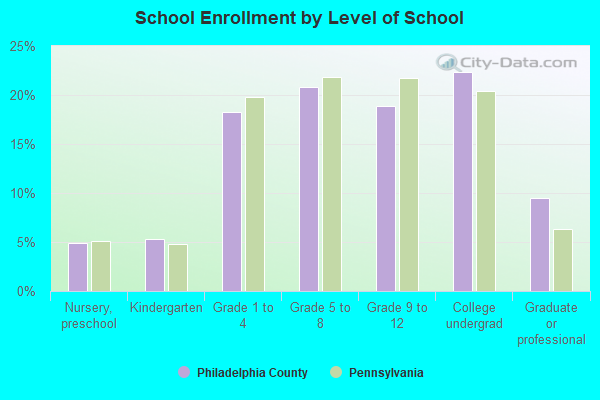
Current college students: 115,671
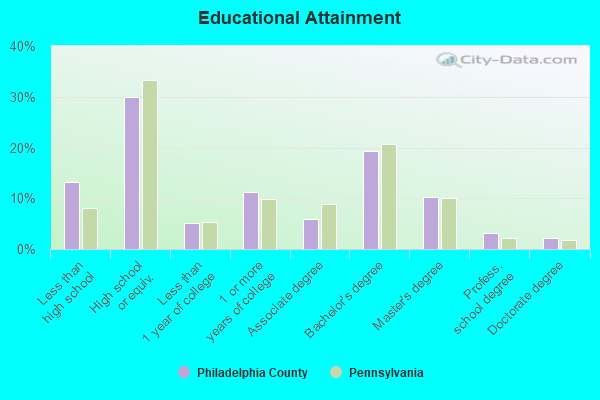
People 25 years of age or older with a high school degree or higher: 87.3%
People 25 years of age or older with a bachelor's degree or higher: 36.3%
Number of foreign born residents: 246,579 (50.9% naturalized citizens)
| Philadelphia County: | 15.7% |
| Whole state: | 7.5% |
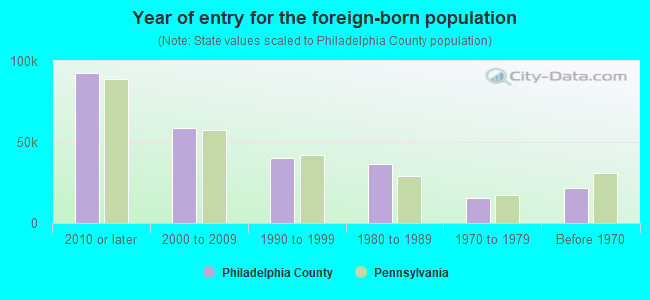
- Year of entry for the foreign-born population
- 106,9762010 or later
- 58,4422000 to 2009
- 43,1921990 to 1999
- 36,5631980 to 1989
- 15,7001970 to 1979
- 21,318Before 1970
Mean travel time to work (commute): minutes
Percentage of county residents living and working in this county: 94.0%
Housing units in structures:
- One, detached: 59,887
- One, attached: 418,783
- Two: 64,680
- 3 or 4: 50,021
- 5 to 9: 27,807
- 10 to 19: 21,158
- 20 to 49: 27,293
- 50 or more: 85,176
- Mobile homes: 2,816
- Boats, RVs, vans, etc.: 35
Housing units in Philadelphia County with a mortgage: 208,105 (21,812 second mortgage, 1,247 home equity loan, 17,373 both second mortgage and home equity loan)
Houses without a mortgage: 9,702
| Here: | 95.9% with mortgage |
| State: | 93.8% with mortgage |
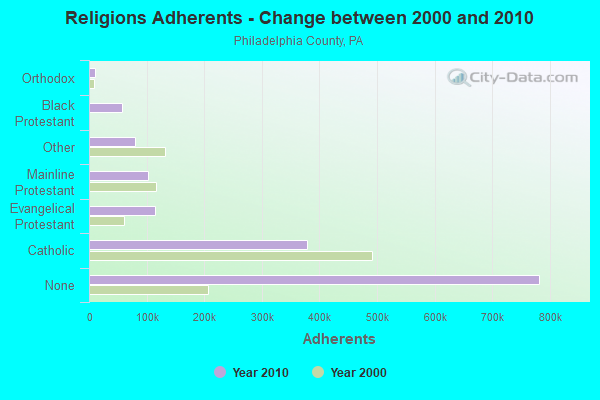
Religion statistics for Philadelphia County
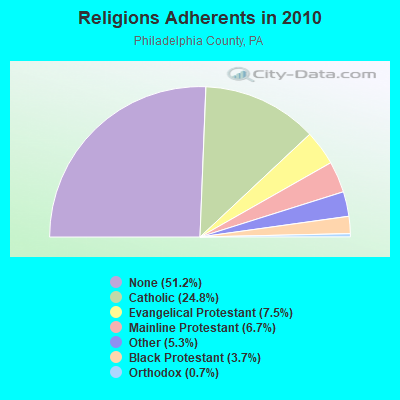
| Religion | Adherents | Congregations |
|---|---|---|
| Catholic | 378,561 | 115 |
| Evangelical Protestant | 114,439 | 523 |
| Mainline Protestant | 102,627 | 319 |
| Other | 80,599 | 147 |
| Black Protestant | 56,766 | 164 |
| Orthodox | 11,276 | 24 |
| None | 781,738 | - |
Source: Clifford Grammich, Kirk Hadaway, Richard Houseal, Dale E.Jones, Alexei Krindatch, Richie Stanley and Richard H.Taylor. 2012. 2010 U.S.Religion Census: Religious Congregations & Membership Study. Association of Statisticians of American Religious Bodies. Jones, Dale E., et al. 2002. Congregations and Membership in the United States 2000. Nashville, TN: Glenmary Research Center.
Food Environment Statistics:
| Philadelphia County: | 3.15 / 10,000 pop. |
| State: | 2.04 / 10,000 pop. |
| Here: | 0.02 / 10,000 pop. |
| Pennsylvania: | 0.09 / 10,000 pop. |
| This county: | 1.18 / 10,000 pop. |
| Pennsylvania: | 0.88 / 10,000 pop. |
| Philadelphia County: | 1.16 / 10,000 pop. |
| Pennsylvania: | 2.52 / 10,000 pop. |
| This county: | 6.85 / 10,000 pop. |
| State: | 7.12 / 10,000 pop. |
| Philadelphia County: | 10.4% |
| Pennsylvania: | 9.1% |
| Philadelphia County: | 29.1% |
| State: | 27.2% |
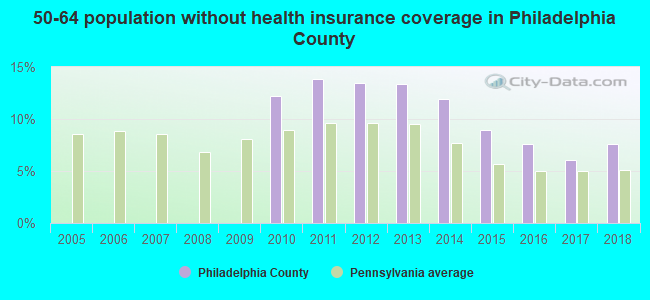
| Here: | 8.4% |
| State: | 11.5% |
Agriculture in Philadelphia County:
Average value of agricultural products sold per farm: $40,350The value of nursery, greenhouse, floriculture, and sod as a percentage of the total market value of agricultural products sold: 82.61%
The value of livestock, poultry, and their products as a percentage of the total market value of agricultural products sold: 0.00%
Average total farm production expenses per farm: $20,968
Average market value of all machinery and equipment per farm: $16,482
The percentage of farms operated by a family or individual: 88.89%
Average age of principal farm operators: 54 years
Vegetables: 14 harvested acres
Earthquake activity:
Philadelphia County-area historical earthquake activity is significantly above Pennsylvania state average. It is 66% smaller than the overall U.S. average.On 8/23/2011 at 17:51:04, a magnitude 5.8 (5.8 MW, Depth: 3.7 mi, Class: Moderate, Intensity: VI - VII) earthquake occurred 208.3 miles away from Philadelphia County center
On 1/16/1994 at 01:49:16, a magnitude 4.6 (4.6 MB, 4.6 LG, Depth: 3.1 mi, Class: Light, Intensity: IV - V) earthquake occurred 52.5 miles away from the county center
On 1/16/1994 at 00:42:43, a magnitude 4.2 (4.2 MB, 4.0 LG, Depth: 3.1 mi) earthquake occurred 50.9 miles away from the county center
On 10/7/1983 at 10:18:46, a magnitude 5.3 (5.1 MB, 5.3 LG, 5.1 ML) earthquake occurred 276.6 miles away from the county center
On 11/30/2017 at 21:47:31, a magnitude 4.1 (4.1 MW, Depth: 6.1 mi) earthquake occurred 57.4 miles away from Philadelphia County center
On 9/25/1998 at 19:52:52, a magnitude 5.2 (4.8 MB, 4.3 MS, 5.2 LG, 4.5 MW, Depth: 3.1 mi) earthquake occurred 293.9 miles away from the county center
Magnitude types: regional Lg-wave magnitude (LG), body-wave magnitude (MB), local magnitude (ML), surface-wave magnitude (MS), moment magnitude (MW)
Most recent natural disasters:
- Pennsylvania Covid-19 Pandemic, Incident Period: January 20, 2020, Major Disaster (Presidential) Declared DR-4506-PA: March 30, 2020, FEMA Id: 4506, Natural disaster type: Other
- Pennsylvania Severe Winter Storm and Snowstorm, Incident Period: January 22, 2016 to January 23, 2016, Major Disaster (Presidential) Declared DR-4267: March 23, 2016, FEMA Id: 4267, Natural disaster type: Snowstorm, Winter Storm
- Pennsylvania Severe Winter Storm, Incident Period: February 04, 2014 to February 20, 2014, Emergency Declared EM-3367: February 06, 2014, FEMA Id: 3367, Natural disaster type: Winter Storm
- Pennsylvania Hurricane Sandy, Incident Period: October 26, 2012 to November 08, 2012, Emergency Declared EM-3356: October 29, 2012, FEMA Id: 3356, Natural disaster type: Hurricane
- Pennsylvania Hurricane Sandy, Incident Period: October 26, 2012 to November 08, 2012, Major Disaster (Presidential) Declared DR-4099: January 10, 2013, FEMA Id: 4099, Natural disaster type: Hurricane
- Pennsylvania Remnants of Tropical Storm Lee, Incident Period: September 03, 2011 to October 15, 2011, Major Disaster (Presidential) Declared EM-3340: September 08, 2011, FEMA Id: 3340, Natural disaster type: Tropical Storm
- Pennsylvania Tropical Storm Lee, Incident Period: September 03, 2011 to October 15, 2011, Major Disaster (Presidential) Declared DR-4030: September 12, 2011, FEMA Id: 4030, Natural disaster type: Tropical Storm
- Pennsylvania Hurricane Irene, Incident Period: August 26, 2011 to September 14, 2011, Emergency Declared EM-3339: August 29, 2011, FEMA Id: 3339, Natural disaster type: Hurricane
- Pennsylvania Hurricane Irene, Incident Period: August 26, 2011 to August 30, 2011, Major Disaster (Presidential) Declared DR-4025: September 03, 2011, FEMA Id: 4025, Natural disaster type: Hurricane
- Pennsylvania Severe Winter Storms and Snowstorms, Incident Period: February 05, 2010 to February 11, 2010, Major Disaster (Presidential) Declared DR-1898: April 16, 2010, FEMA Id: 1898, Natural disaster type: Snowstorm, Winter Storm
- 12 other natural disasters have been reported since 1953.
The number of natural disasters in Philadelphia County (22) is greater than the US average (15).
Major Disasters (Presidential) Declared: 16
Emergencies Declared: 6
Causes of natural disasters: Hurricanes: 6, Winter Storms: 5, Floods: 3, Snowstorms: 3, Tropical Storms: 3, Storms: 2, Blizzard: 1, Snowfall: 1, Tropical Depression: 1, Water Shortage: 1, Other: 1 (Note: some incidents may be assigned to more than one category).
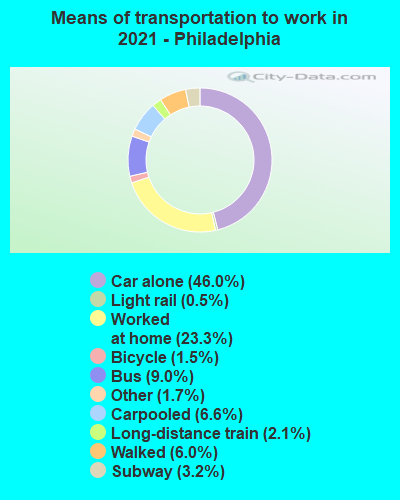
Means of transportation to work:
- Drove a car alone: 383,059 (47.8%)
- Carpooled: 51,755 (6.5%)
- Bus: 66,670 (8.3%)
- Subway or elevated rail: 39,841 (5.0%)
- Long-distance train or commuter rail: 24,215 (3.0%)
- Light rail, streetcar or trolley: 7,796 (1.0%)
- Ferryboat: 62 (0.0%)
- Taxicab, motorcycle, or other means: 17,573 (2.2%)
- Bicycle: 17,309 (2.2%)
- Walked: 49,250 (6.1%)
- Worked at home: 143,519 (17.9%)
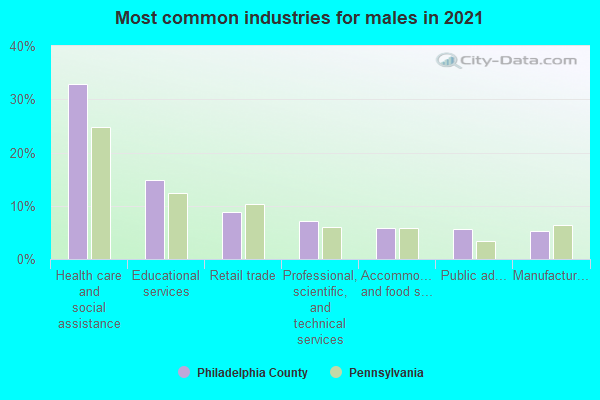
- Health care and social assistance (34%)
- Educational services (15%)
- Retail trade (11%)
- Professional, scientific, and technical services (9%)
- Accommodation and food services (7%)
- Other services, except public administration (6%)
- Public administration (6%)
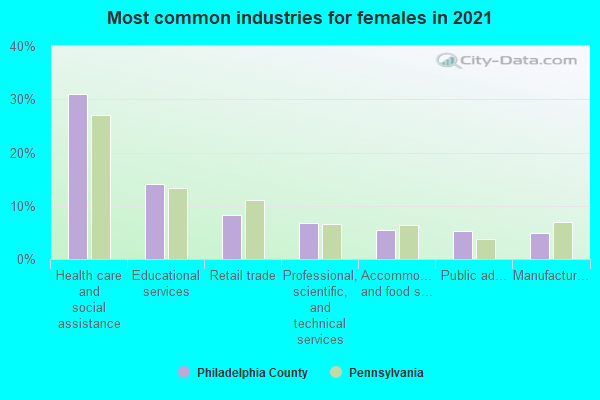
- Health care and social assistance (31%)
- Educational services (14%)
- Retail trade (10%)
- Professional, scientific, and technical services (8%)
- Accommodation and food services (7%)
- Other services, except public administration (5%)
- Public administration (5%)
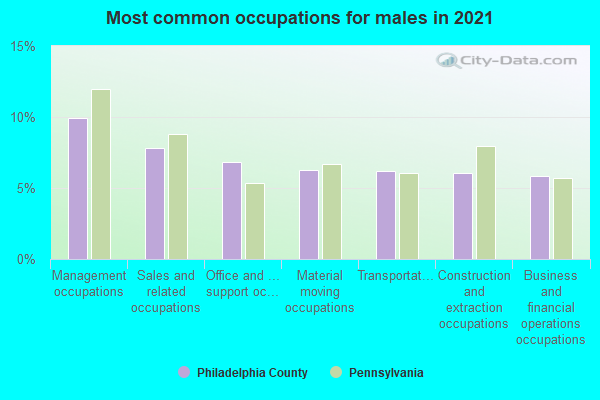
- Management occupations (10%)
- Sales and related occupations (8%)
- Transportation occupations (7%)
- Office and administrative support occupations (7%)
- Business and financial operations occupations (7%)
- Computer and mathematical occupations (6%)
- Construction and extraction occupations (5%)
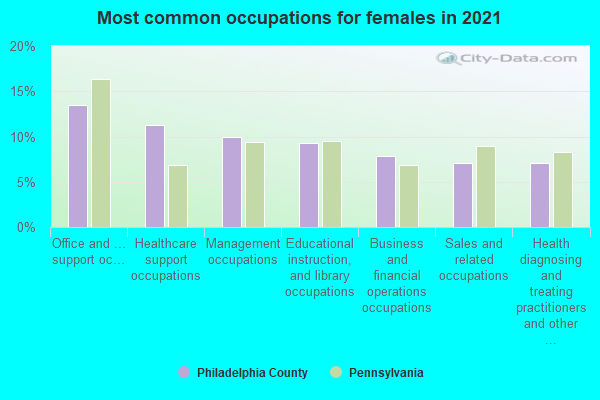
- Office and administrative support occupations (13%)
- Healthcare support occupations (12%)
- Management occupations (9%)
- Educational instruction, and library occupations (9%)
- Sales and related occupations (8%)
- Business and financial operations occupations (7%)
- Health diagnosing and treating practitioners and other technical occupations (7%)
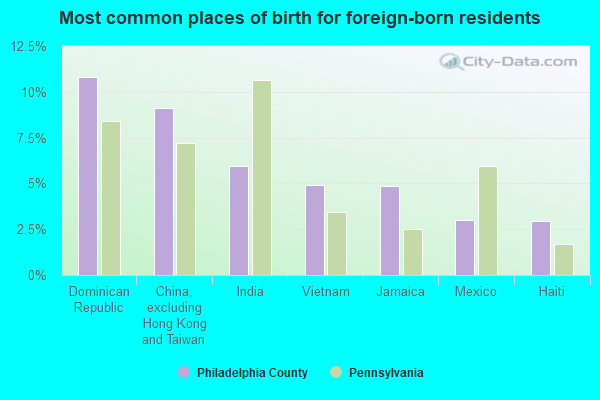
- Dominican Republic (12%)
- China, excluding Hong Kong and Taiwan (10%)
- Vietnam (5%)
- India (5%)
- Jamaica (4%)
- Mexico (3%)
- Brazil (3%)
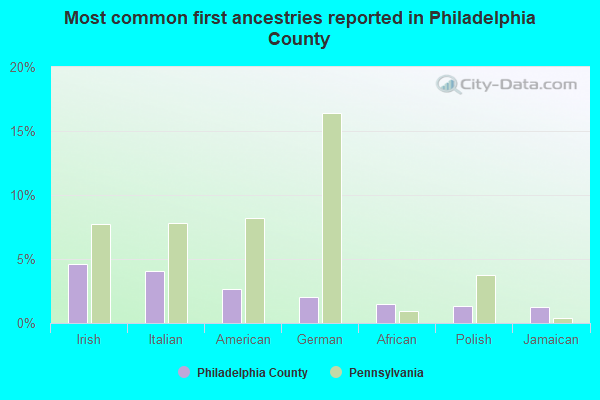
- Irish (5%)
- Italian (4%)
- American (3%)
- German (2%)
- Polish (1%)
- African (1%)
- Jamaican (1%)
People in group quarters in Philadelphia County, Pennsylvania in 2010:
- 25,462 people in college/university student housing
- 8,828 people in local jails and other municipal confinement facilities
- 7,877 people in nursing facilities/skilled-nursing facilities
- 3,750 people in emergency and transitional shelters (with sleeping facilities) for people experiencing homelessness
- 3,732 people in group homes intended for adults
- 2,983 people in other noninstitutional facilities
- 1,616 people in residential treatment centers for adults
- 998 people in federal detention centers
- 526 people in correctional residential facilities
- 426 people in workers' group living quarters and job corps centers
- 263 people in correctional facilities intended for juveniles
- 241 people in mental (psychiatric) hospitals and psychiatric units in other hospitals
- 175 people in group homes for juveniles (non-correctional)
- 173 people in residential treatment centers for juveniles (non-correctional)
- 155 people in hospitals with patients who have no usual home elsewhere
- 57 people in residential schools for people with disabilities
- 42 people in in-patient hospice facilities
- 41 people in state prisons
- 24 people in maritime/merchant vessels
- 14 people in military barracks and dormitories (nondisciplinary)
People in group quarters in Philadelphia County, Pennsylvania in 2000:
- 21,123 people in college dormitories (includes college quarters off campus)
- 10,164 people in nursing homes
- 4,510 people in other noninstitutional group quarters
- 3,887 people in local jails and other confinement facilities (including police lockups)
- 2,674 people in state prisons
- 2,189 people in homes or halfway houses for drug/alcohol abuse
- 1,679 people in religious group quarters
- 1,296 people in homes for the mentally retarded
- 1,234 people in other group homes
- 1,103 people in homes for the mentally ill
- 1,014 people in mental (psychiatric) hospitals or wards
- 527 people in military barracks, etc.
- 526 people in other nonhousehold living situations
- 463 people in hospitals/wards and hospices for chronically ill
- 432 people in wards in general hospitals for patients who have no usual home elsewhere
- 396 people in halfway houses
- 373 people in schools, hospitals, or wards for the intellectually disabled
- 313 people in other hospitals or wards for chronically ill
- 257 people in hospitals or wards for drug/alcohol abuse
- 197 people in orthopedic wards and institutions for the physically handicapped
- 169 people in homes for abused, dependent, and neglected children
- 160 people in short-term care, detention or diagnostic centers for delinquent children
- 112 people in military hospitals or wards for chronically ill
- 86 people in homes for the physically handicapped
- 84 people in federal prisons and detention centers
- 61 people in other types of correctional institutions
- 47 people in unknown juvenile institutions
- 38 people in hospices or homes for chronically ill
- 28 people in institutions for the blind
- 26 people in job corps and vocational training facilities
- 10 people in agriculture workers' dormitories on farms
- 6 people in other workers' dormitories
- 5 people in residential treatment centers for emotionally disturbed children
- 4 people in military ships
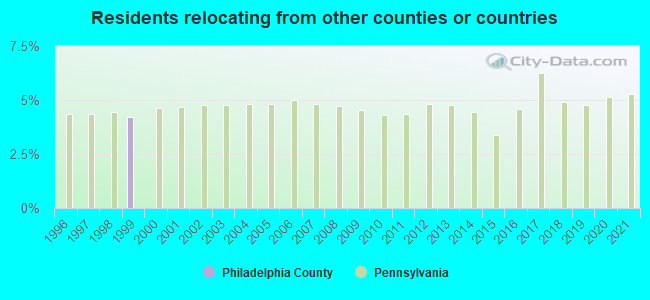
10 or fewer of this county's residents relocated from other counties between 2020 and 2021.1,000 average adjusted gross income)
10 or fewer of this county's residents moved from foreign countries.
10 or fewer of this county's residents relocated from other counties in Pennsylvania.
10 or fewer of this county's residents relocated from other states.
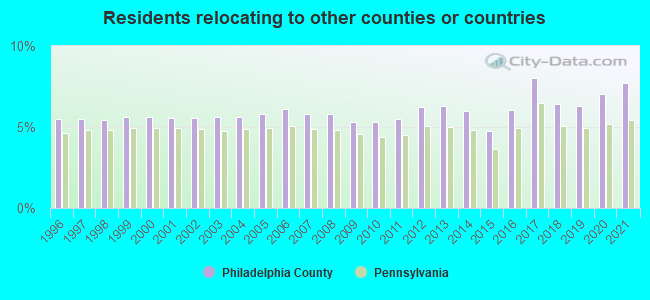
7.69% of this county's 2020 resident taxpayers moved to other counties in 2021 ($84,560 average adjusted gross income)
| Here: | 7.69% |
| Pennsylvania average: | 5.44% |
0.03% of residents moved to foreign countries ($178 average AGI)
Philadelphia County: 0.03% Pennsylvania average: 0.01%
3.56% relocated to other counties in Pennsylvania ($37,513 average AGI)
4.11% relocated to other states ($46,868 average AGI)
Philadelphia County: 4.11% Pennsylvania average: 2.47%
Top counties to which taxpayers relocated from this county between 2020 and 2021:
| to Montgomery County, PA | |
| to Delaware County, PA | |
| to Bucks County, PA | |
| to Camden County, NJ | |
| to New Castle County, DE | |
| to Chester County, PA | |
| to Burlington County, NJ |
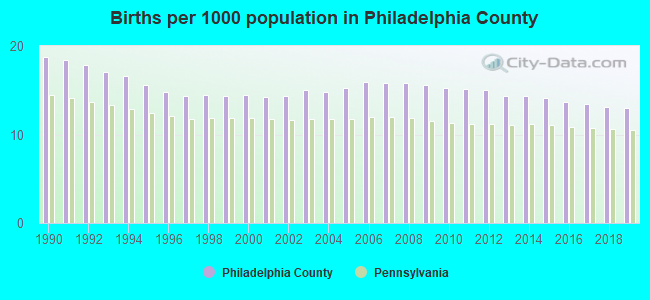
Births per 1000 population from 1990 to 1999: 16.2
Births per 1000 population from 2000 to 2009: 15.1
Births per 1000 population from 2010 to 2022: 11.8
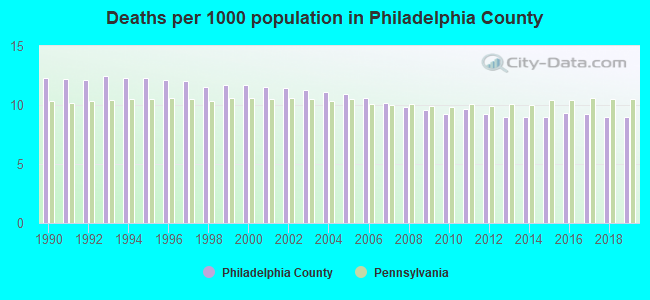
Deaths per 1000 population from 1990 to 1999: 12.1
Deaths per 1000 population from 2000 to 2009: 10.8
Deaths per 1000 population from 2010 to 2020: 9.4
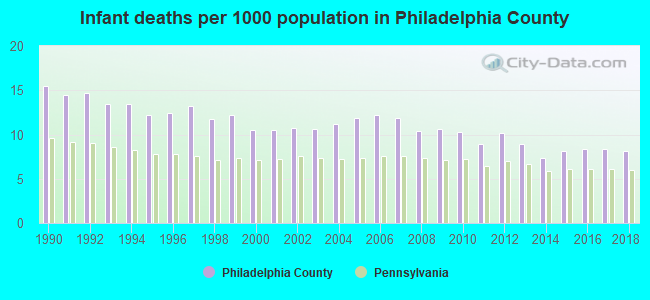
Infant deaths per 1000 live births from 1990 to 1999: 13.3
Infant deaths per 1000 live births from 2000 to 2009: 11.0
Infant deaths per 1000 live births from 2010 to 2021: 8.2
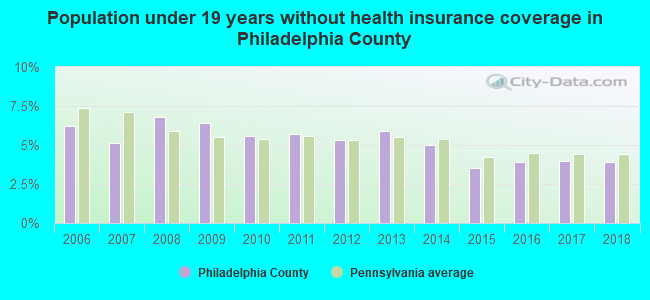
Persons under 19 years old without health insurance coverage in 2018: 3.9%
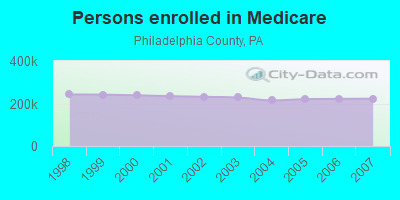
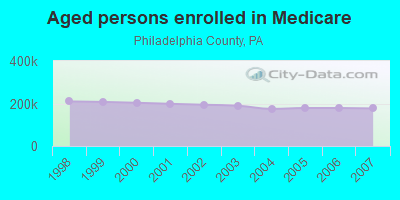
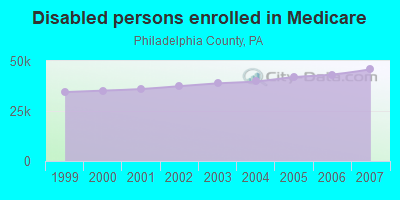
Persons enrolled in hospital insurance and/or supplemental medical insurance (Medicare) in July 1, 2007: 222,659 (176,790 aged, 45,869 disabled)
Children under 18 without health insurance coverage in 2007: 30,121 (8%)
Most common underlying causes of death in Philadelphia County, Pennsylvania in 1999 - 2019:
- Bronchus or lung, unspecified - Malignant neoplasms (19,553)
- Atherosclerotic heart disease (17,195)
- Atherosclerotic cardiovascular disease, so described (15,748)
- Acute myocardial infarction, unspecified (15,557)
- Chronic obstructive pulmonary disease, unspecified (9,857)
- Septicaemia, unspecified (8,995)
- Unspecified dementia (8,912)
- Stroke, not specified as haemorrhage or infarction (8,218)
- Accidental poisoning by and exposure to other and unspecified drugs, medicaments and biological substances (7,797)
- Congestive heart failure (6,639)
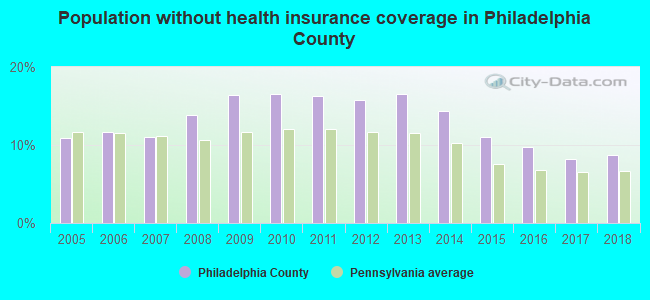
Population without health insurance coverage in 2000: 17%
Children under 18 without health insurance coverage in 2000: 11%
Short term general hospital admissions per 100,000 population in 2004: 20,890
Short term general hospital beds per 100,000 population in 2004: 457
Emergency room visits per 100,000 population in 2004: 54,664
General practice office based MDs per 100,000 population in 2005: 1,484
Medical specialist MDs per 100,000 population in 2005: 1,095
Dentists per 100,000 population in 1998: 13
Total births per 100,000 population, July 2005 - July 2006 : 49
Total deaths per 100,000 population, July 2005 - July 2006: 92
Limited-service eating places per 100,000 population in 2005 : 6
Beer, wine & liquor stores per 100,000 population in 2005: 1
Fitness & recreation sports centers per 100,000 population in 2005: 6,363
EPA green book nonattainment status in 2004-2006: 1
Homicides per 1,000,000 population from 2000 to 2006: 223.5. This is more than state average.
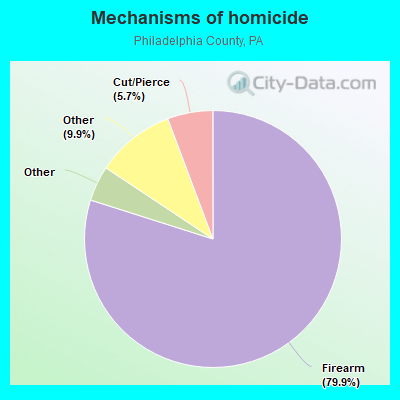
- Firearm - 178.6
- Cut/Pierce - 12.8
- Suffocation - 5.6
- Fire/Burn - 4.3
- Other - 22.2
Suicides per 1,000,000 population from 2000 to 2006: 103.7. This is less than state average.
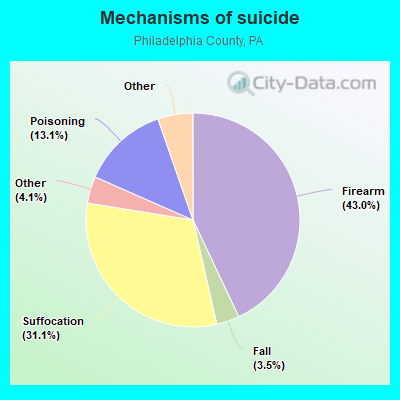
- Firearm - 44.6
- Suffocation - 32.3
- Poisoning - 13.6
- Fall - 3.6
- Cut/Pierce - 2.8
- Drowning - 2.6
- Other - 4.2
Household type by relationship:
Households: 1,567,258- Male householders: 290,947 (113,210 living alone), Female householders: 404,373 (153,782 living alone)
193,879 spouses (187,751 opposite-sex spouses), 56,907 unmarried partners, (51,771 opposite-sex unmarried partners), 382,673 children (366,015 natural, 7,480 adopted, 9,178 stepchildren), 68,713 grandchildren, 18,927 brothers or sisters, 16,325 parents, 1,034 foster children, 31,967 other relatives, 52,579 non-relatives
- In group quarters: 48,934
Size of family households: 153,648 2-persons, 85,337 3-persons, 62,101 4-persons, 33,267 5-persons, 11,958 6-persons, 8,743 7-or-more-persons.
Size of nonfamily households: 266,992 1-person, 58,963 2-persons, 10,448 3-persons, 2,648 4-persons, 831 5-persons, 335 6-persons, 49 7-or-more-persons.
135,167 married couples with children.
120,208 single-parent households (18,660 men, 101,548 women).
75.1% of residents of Philadelphia speak English at home.
11.6% of residents speak Spanish at home (51% speak English very well, 18% speak English well, 20% speak English not well, 11% don't speak English at all).
5.6% of residents speak other Indo-European language at home (54% speak English very well, 26% speak English well, 15% speak English not well, 6% don't speak English at all).
5.8% of residents speak Asian or Pacific Island language at home (40% speak English very well, 25% speak English well, 27% speak English not well, 9% don't speak English at all).
1.9% of residents speak other language at home (62% speak English very well, 29% speak English well, 8% speak English not well, 1% don't speak English at all).
In fiscal year 2004:
Federal Government expenditure: $16,055,314,000 ($10,921 per capita)
Department of Defense expenditure: $1,800,223,000
Federal direct payments to individuals for retirement and disability: $3,712,597,000
Federal other direct payments to individuals: $3,645,116,000
Federal direct payments not to individuals: $131,588,000
Federal grants: $4,884,385,000
Federal procurement contracts: $1,699,384,000 ($1,283,751,000 Department of Defense)
Federal salaries and wages: $1,982,244,000 ($440,753,000 Department of Defense)
Federal Government direct loans: $14,135,000
Federal guaranteed/insured loans: $403,369,000
Federal Government insurance: $368,152,000
Population change from April 1, 2000 to July 1, 2005:
Births: 120,060| Here: | 82 per 1000 residents |
| State: | 61 per 1000 residents |
Deaths: 87,625
| Here: | 60 per 1000 residents |
| State: | 54 per 1000 residents |
Net international migration: +30,151
| Here: | +21 per 1000 residents |
| State: | +8 per 1000 residents |
Net internal migration: -113,844
| Here: | |
| State: |
Total withdrawal of fresh water for public supply: 294.30 millions of gallons per day (all from surface)
| Here: | 6.2 |
| State: | 6.8 |
| Here: | 3.9 |
| State: | 4.3 |
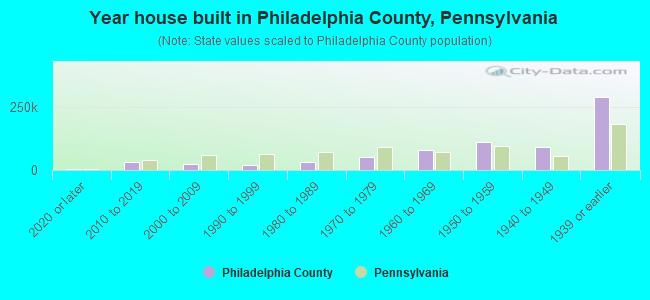
- Year house built in Philadelphia County, Pennsylvania
- 7,4902020 or later
- 44,1802010 to 2019
- 25,4632000 to 2009
- 19,2501990 to 1999
- 36,3001980 to 1989
- 59,5611970 to 1979
- 75,5781960 to 1969
- 108,4791950 to 1959
- 76,2371940 to 1949
- 305,1181939 or earlier
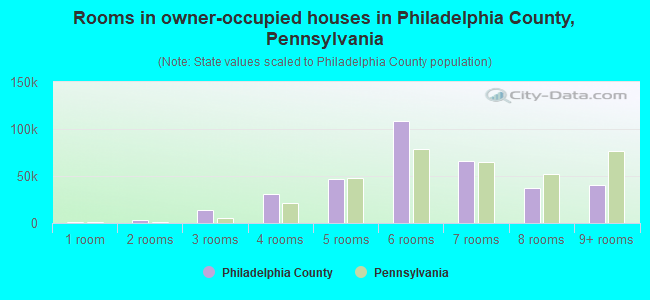
- Rooms in owner-occupied houses in Philadelphia County, Pennsylvania
- 2,5041 room
- 2,8902 rooms
- 15,6073 rooms
- 32,5554 rooms
- 50,5185 rooms
- 105,6286 rooms
- 70,3247 rooms
- 34,6318 rooms
- 38,8789+ rooms
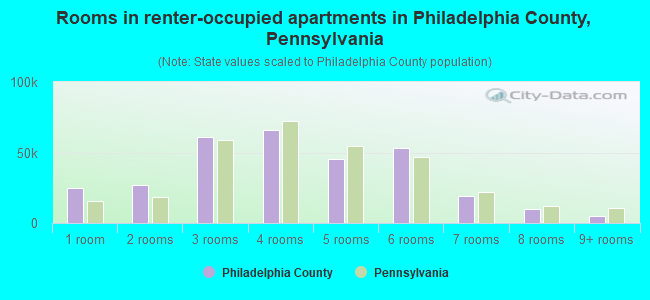
- Rooms in renter-occupied apartments in Philadelphia County, Pennsylvania
- 30,9051 room
- 31,9612 rooms
- 83,3463 rooms
- 65,6694 rooms
- 42,6325 rooms
- 52,2716 rooms
- 18,7127 rooms
- 9,2598 rooms
- 7,0309+ rooms
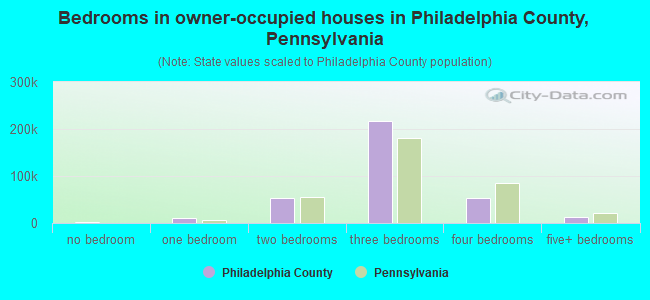
- Bedrooms in owner-occupied houses in Philadelphia County, Pennsylvania
- 3,048no bedroom
- 13,9851 bedroom
- 56,9662 bedrooms
- 210,6693 bedrooms
- 54,0724 bedrooms
- 14,7955+ bedrooms
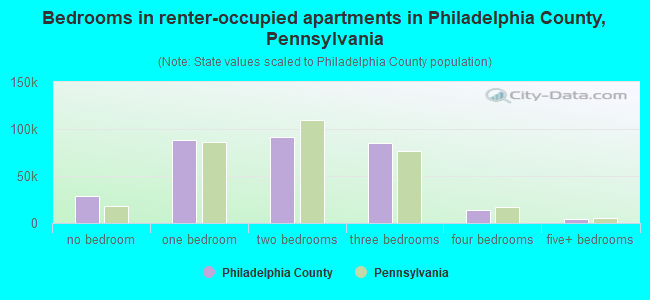
- Bedrooms in renter-occupied apartments in Philadelphia County, Pennsylvania
- 35,289no bedroom
- 101,3281 bedroom
- 101,6482 bedrooms
- 86,4523 bedrooms
- 12,2054 bedrooms
- 4,8635+ bedrooms
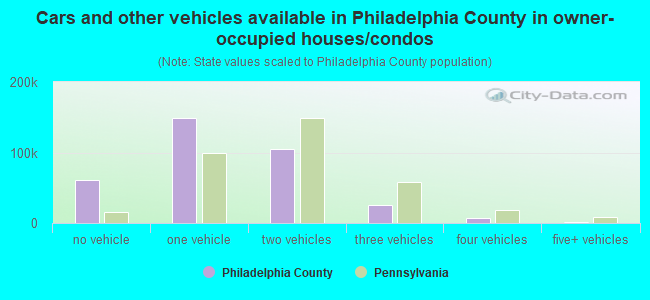
- Cars and other vehicles available in Philadelphia County in owner-occupied houses/condos
- 59,418no vehicle
- 164,3861 vehicle
- 97,1672 vehicles
- 22,0973 vehicles
- 8,2424 vehicles
- 2,2255+ vehicles
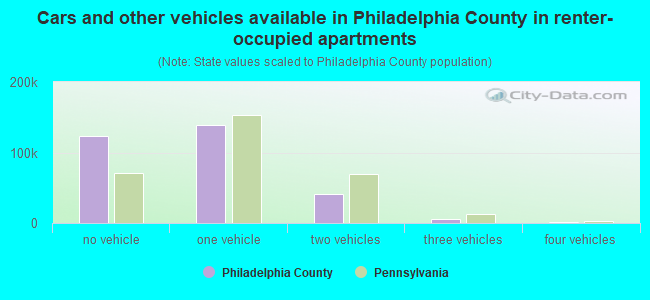
- Cars and other vehicles available in Philadelphia County in renter-occupied apartments
- 135,163no vehicle
- 149,2551 vehicle
- 46,2992 vehicles
- 9,4083 vehicles
- 1,1304 vehicles
- 5305+ vehicles
86.7% of Philadelphia County residents lived in the same house 1 years ago.
Out of people who lived in different houses, 38% lived in this county.
Out of people who lived in different counties, 39% lived in Pennsylvania.
| Philadelphia County: | 86.7% |
| State average: | 89.3% |
Place of birth for U.S.-born residents:
- This state: 965,459
- Other state: 296,454
- Northeast: 146,003
- Midwest: 32,325
- South: 94,748
- West: 23,378
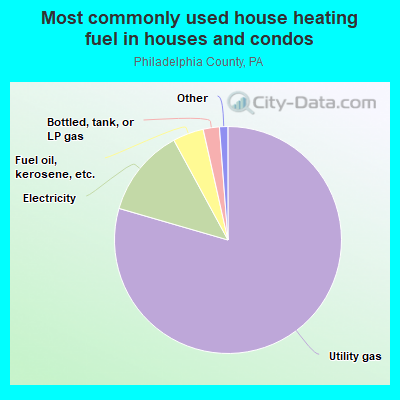
- 79.8%Utility gas
- 13.8%Electricity
- 3.9%Fuel oil, kerosene, etc.
- 1.6%Bottled, tank, or LP gas
- 0.4%Other fuel
- 0.3%No fuel used
- 0.2%Wood
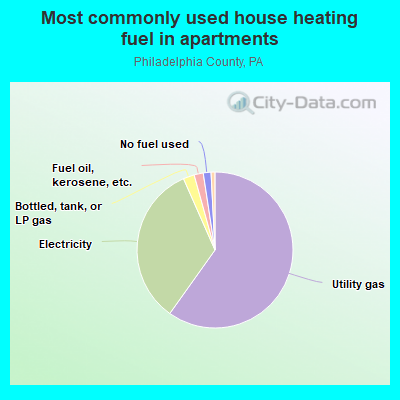
- 55.9%Utility gas
- 38.4%Electricity
- 2.1%Bottled, tank, or LP gas
- 1.6%Fuel oil, kerosene, etc.
- 1.3%No fuel used
- 0.7%Other fuel
Private vs. public school enrollment:
| Here: | 24.1% |
| Pennsylvania: | 15.7% |
| Here: | 27.5% |
| Pennsylvania: | 13.4% |
| Here: | 47.6% |
| Pennsylvania: | 39.8% |
Philadelphia County government finances - Expenditure in 2018:
- Charges - Other: $1,070,000
Other: $915,000
Regular Highways: $125,000
Regular Highways: $101,000
Natural Resources - Other: $19,000
Natural Resources - Other: $14,000
- Current Operations - Regular Highways: $4,152,000
Regular Highways: $3,275,000
Correctional Institutions: $2,476,000
Correctional Institutions: $2,280,000
Judicial and Legal Services: $1,344,000
Central Staff Services: $1,188,000
Central Staff Services: $1,029,000
Financial Administration: $958,000
Financial Administration: $948,000
Judicial and Legal Services: $875,000
Police Protection: $804,000
Police Protection: $792,000
General Public Buildings: $399,000
General Public Buildings: $301,000
Health - Other: $262,000
Health - Other: $225,000
Public Welfare - Other: $225,000
Natural Resources - Other: $169,000
Public Welfare - Other: $168,000
General - Other: $116,000
Natural Resources - Other: $112,000
General - Other: $104,000
Miscellaneous Commercial Activities - Other: $42,000
Parks and Recreation: $10,000
- Federal Intergovernmental - Other: $139,000
Other: $73,000
- General - Interest on Debt: $73,000
Interest on Debt: $66,000
- Intergovernmental to Local - Other - Regular Highways: $29,000
Other - Regular Highways: $28,000
- Local Intergovernmental - Highways: $51,000
Highways: $50,000
General Local Government Support: $6,000
- Long Term Debt - Beginning Outstanding - Unspecified Public Purpose: $1,815,000
Outstanding Unspecified Public Purpose: $1,728,000
Beginning Outstanding - Unspecified Public Purpose: $1,641,000
Outstanding Unspecified Public Purpose: $1,554,000
Retired Unspecified Public Purpose: $87,000
Retired Unspecified Public Purpose: $87,000
- Miscellaneous - Interest Earnings: $105,000
Rents: $78,000
Rents: $71,000
Interest Earnings: $71,000
Sale of Property: $49,000
Fines and Forfeits: $30,000
Fines and Forfeits: $23,000
General Revenue - Other: $9,000
General Revenue - Other: $6,000
- Other Capital Outlay - Regular Highways: $122,000
- Other Funds - Cash and Securities: $6,229,000
Cash and Securities: $5,638,000
- State Intergovernmental - Highways: $2,153,000
Highways: $1,906,000
General Local Government Support: $432,000
General Local Government Support: $407,000
Other: $25,000
Other: $6,000
- Tax - Property: $6,818,000
Property: $6,232,000
Motor Vehicle License: $574,000
Motor Vehicle License: $569,000
Other License: $37,000
Other License: $29,000
- Total Salaries and Wages: $4,041,000
: $3,779,000
Philadelphia County government finances - Revenue in 2018:
- Charges - Other: $1,070,000
Other: $915,000
Regular Highways: $125,000
Regular Highways: $101,000
Natural Resources - Other: $19,000
Natural Resources - Other: $14,000
- Current Operations - Regular Highways: $4,152,000
Regular Highways: $3,275,000
Correctional Institutions: $2,476,000
Correctional Institutions: $2,280,000
Judicial and Legal Services: $1,344,000
Central Staff Services: $1,188,000
Central Staff Services: $1,029,000
Financial Administration: $958,000
Financial Administration: $948,000
Judicial and Legal Services: $875,000
Police Protection: $804,000
Police Protection: $792,000
General Public Buildings: $399,000
General Public Buildings: $301,000
Health - Other: $262,000
Health - Other: $225,000
Public Welfare - Other: $225,000
Natural Resources - Other: $169,000
Public Welfare - Other: $168,000
General - Other: $116,000
Natural Resources - Other: $112,000
General - Other: $104,000
Miscellaneous Commercial Activities - Other: $42,000
Parks and Recreation: $10,000
- Federal Intergovernmental - Other: $139,000
Other: $73,000
- General - Interest on Debt: $73,000
Interest on Debt: $66,000
- Intergovernmental to Local - Other - Regular Highways: $29,000
Other - Regular Highways: $28,000
- Local Intergovernmental - Highways: $51,000
Highways: $50,000
General Local Government Support: $6,000
- Long Term Debt - Beginning Outstanding - Unspecified Public Purpose: $1,815,000
Outstanding Unspecified Public Purpose: $1,728,000
Beginning Outstanding - Unspecified Public Purpose: $1,641,000
Outstanding Unspecified Public Purpose: $1,554,000
Retired Unspecified Public Purpose: $87,000
Retired Unspecified Public Purpose: $87,000
- Miscellaneous - Interest Earnings: $105,000
Rents: $78,000
Rents: $71,000
Interest Earnings: $71,000
Sale of Property: $49,000
Fines and Forfeits: $30,000
Fines and Forfeits: $23,000
General Revenue - Other: $9,000
General Revenue - Other: $6,000
- Other Capital Outlay - Regular Highways: $122,000
- Other Funds - Cash and Securities: $6,229,000
Cash and Securities: $5,638,000
- State Intergovernmental - Highways: $2,153,000
Highways: $1,906,000
General Local Government Support: $432,000
General Local Government Support: $407,000
Other: $25,000
Other: $6,000
- Tax - Property: $6,818,000
Property: $6,232,000
Motor Vehicle License: $574,000
Motor Vehicle License: $569,000
Other License: $37,000
Other License: $29,000
- Total Salaries and Wages: $4,041,000
: $3,779,000
Philadelphia County government finances - Debt in 2018:
- Charges - Other: $1,070,000
Other: $915,000
Regular Highways: $125,000
Regular Highways: $101,000
Natural Resources - Other: $19,000
Natural Resources - Other: $14,000
- Current Operations - Regular Highways: $4,152,000
Regular Highways: $3,275,000
Correctional Institutions: $2,476,000
Correctional Institutions: $2,280,000
Judicial and Legal Services: $1,344,000
Central Staff Services: $1,188,000
Central Staff Services: $1,029,000
Financial Administration: $958,000
Financial Administration: $948,000
Judicial and Legal Services: $875,000
Police Protection: $804,000
Police Protection: $792,000
General Public Buildings: $399,000
General Public Buildings: $301,000
Health - Other: $262,000
Health - Other: $225,000
Public Welfare - Other: $225,000
Natural Resources - Other: $169,000
Public Welfare - Other: $168,000
General - Other: $116,000
Natural Resources - Other: $112,000
General - Other: $104,000
Miscellaneous Commercial Activities - Other: $42,000
Parks and Recreation: $10,000
- Federal Intergovernmental - Other: $139,000
Other: $73,000
- General - Interest on Debt: $73,000
Interest on Debt: $66,000
- Intergovernmental to Local - Other - Regular Highways: $29,000
Other - Regular Highways: $28,000
- Local Intergovernmental - Highways: $51,000
Highways: $50,000
General Local Government Support: $6,000
- Long Term Debt - Beginning Outstanding - Unspecified Public Purpose: $1,815,000
Outstanding Unspecified Public Purpose: $1,728,000
Beginning Outstanding - Unspecified Public Purpose: $1,641,000
Outstanding Unspecified Public Purpose: $1,554,000
Retired Unspecified Public Purpose: $87,000
Retired Unspecified Public Purpose: $87,000
- Miscellaneous - Interest Earnings: $105,000
Rents: $78,000
Rents: $71,000
Interest Earnings: $71,000
Sale of Property: $49,000
Fines and Forfeits: $30,000
Fines and Forfeits: $23,000
General Revenue - Other: $9,000
General Revenue - Other: $6,000
- Other Capital Outlay - Regular Highways: $122,000
- Other Funds - Cash and Securities: $6,229,000
Cash and Securities: $5,638,000
- State Intergovernmental - Highways: $2,153,000
Highways: $1,906,000
General Local Government Support: $432,000
General Local Government Support: $407,000
Other: $25,000
Other: $6,000
- Tax - Property: $6,818,000
Property: $6,232,000
Motor Vehicle License: $574,000
Motor Vehicle License: $569,000
Other License: $37,000
Other License: $29,000
- Total Salaries and Wages: $4,041,000
: $3,779,000
Philadelphia County government finances - Cash and Securities in 2018:
- Charges - Other: $1,070,000
Other: $915,000
Regular Highways: $125,000
Regular Highways: $101,000
Natural Resources - Other: $19,000
Natural Resources - Other: $14,000
- Current Operations - Regular Highways: $4,152,000
Regular Highways: $3,275,000
Correctional Institutions: $2,476,000
Correctional Institutions: $2,280,000
Judicial and Legal Services: $1,344,000
Central Staff Services: $1,188,000
Central Staff Services: $1,029,000
Financial Administration: $958,000
Financial Administration: $948,000
Judicial and Legal Services: $875,000
Police Protection: $804,000
Police Protection: $792,000
General Public Buildings: $399,000
General Public Buildings: $301,000
Health - Other: $262,000
Health - Other: $225,000
Public Welfare - Other: $225,000
Natural Resources - Other: $169,000
Public Welfare - Other: $168,000
General - Other: $116,000
Natural Resources - Other: $112,000
General - Other: $104,000
Miscellaneous Commercial Activities - Other: $42,000
Parks and Recreation: $10,000
- Federal Intergovernmental - Other: $139,000
Other: $73,000
- General - Interest on Debt: $73,000
Interest on Debt: $66,000
- Intergovernmental to Local - Other - Regular Highways: $29,000
Other - Regular Highways: $28,000
- Local Intergovernmental - Highways: $51,000
Highways: $50,000
General Local Government Support: $6,000
- Long Term Debt - Beginning Outstanding - Unspecified Public Purpose: $1,815,000
Outstanding Unspecified Public Purpose: $1,728,000
Beginning Outstanding - Unspecified Public Purpose: $1,641,000
Outstanding Unspecified Public Purpose: $1,554,000
Retired Unspecified Public Purpose: $87,000
Retired Unspecified Public Purpose: $87,000
- Miscellaneous - Interest Earnings: $105,000
Rents: $78,000
Rents: $71,000
Interest Earnings: $71,000
Sale of Property: $49,000
Fines and Forfeits: $30,000
Fines and Forfeits: $23,000
General Revenue - Other: $9,000
General Revenue - Other: $6,000
- Other Capital Outlay - Regular Highways: $122,000
- Other Funds - Cash and Securities: $6,229,000
Cash and Securities: $5,638,000
- State Intergovernmental - Highways: $2,153,000
Highways: $1,906,000
General Local Government Support: $432,000
General Local Government Support: $407,000
Other: $25,000
Other: $6,000
- Tax - Property: $6,818,000
Property: $6,232,000
Motor Vehicle License: $574,000
Motor Vehicle License: $569,000
Other License: $37,000
Other License: $29,000
- Total Salaries and Wages: $4,041,000
: $3,779,000
Supplemental Security Income (SSI) in 2006:
- Total number of recipients: 96,388
- Number of aged recipients: 9,401
- Number of blind and disabled recipients: 86,987
- Number of recipients under 18: 17,589
- Number of recipients between 18 and 64: 57,910
- Number of recipients older than 64: 20,889
- Number of recipients also receiving OASDI: 21,492
- Amount of payments (thousands of dollars): 49,634
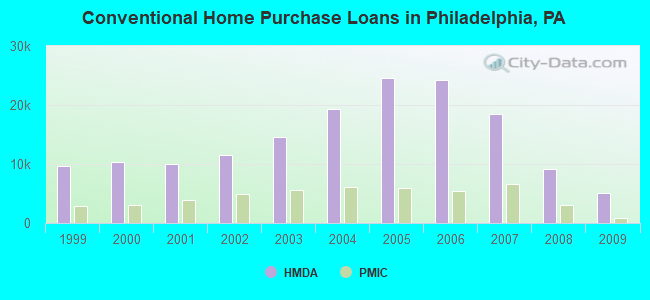
| Home Mortgage Disclosure Act Aggregated Statistics For Year 2009 (Based on 374 full tracts) | ||||||||||||||
| A) FHA, FSA/RHS & VA Home Purchase Loans | B) Conventional Home Purchase Loans | C) Refinancings | D) Home Improvement Loans | E) Loans on Dwellings For 5+ Families | F) Non-occupant Loans on < 5 Family Dwellings (A B C & D) | G) Loans On Manufactured Home Dwelling (A B C & D) | ||||||||
|---|---|---|---|---|---|---|---|---|---|---|---|---|---|---|
| Number | Average Value | Number | Average Value | Number | Average Value | Number | Average Value | Number | Average Value | Number | Average Value | Number | Average Value | |
| LOANS ORIGINATED | 5,979 | $152,252 | 5,032 | $199,078 | 17,783 | $169,240 | 2,629 | $42,322 | 128 | $1,827,445 | 2,279 | $172,189 | 16 | $98,812 |
| APPLICATIONS APPROVED, NOT ACCEPTED | 292 | $143,723 | 399 | $194,644 | 1,925 | $156,826 | 417 | $34,667 | 11 | $5,206,455 | 220 | $136,109 | 4 | $43,250 |
| APPLICATIONS DENIED | 1,042 | $139,352 | 1,390 | $168,862 | 10,651 | $148,223 | 5,618 | $27,275 | 31 | $4,530,645 | 1,810 | $116,025 | 42 | $65,071 |
| APPLICATIONS WITHDRAWN | 679 | $147,116 | 930 | $200,668 | 6,271 | $155,269 | 486 | $62,126 | 24 | $1,802,542 | 591 | $154,745 | 5 | $128,400 |
| FILES CLOSED FOR INCOMPLETENESS | 187 | $147,171 | 215 | $216,172 | 1,489 | $167,009 | 171 | $70,497 | 0 | $0 | 177 | $159,305 | 1 | $20,000 |
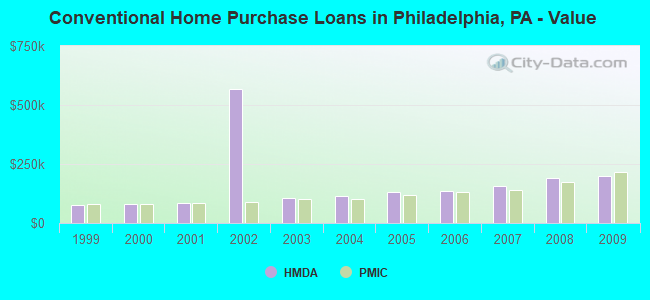
| Private Mortgage Insurance Companies Aggregated Statistics For Year 2009 (Based on 291 full tracts) | ||||||
| A) Conventional Home Purchase Loans | B) Refinancings | C) Non-occupant Loans on < 5 Family Dwellings (A & B) | ||||
|---|---|---|---|---|---|---|
| Number | Average Value | Number | Average Value | Number | Average Value | |
| LOANS ORIGINATED | 920 | $215,103 | 471 | $223,204 | 8 | $182,375 |
| APPLICATIONS APPROVED, NOT ACCEPTED | 320 | $195,962 | 188 | $212,872 | 28 | $126,500 |
| APPLICATIONS DENIED | 123 | $190,073 | 117 | $232,940 | 2 | $138,000 |
| APPLICATIONS WITHDRAWN | 56 | $219,036 | 57 | $221,684 | 0 | $0 |
| FILES CLOSED FOR INCOMPLETENESS | 34 | $162,882 | 10 | $178,800 | 9 | $111,667 |
| Most common first names in Philadelphia County, PA among deceased individuals | ||
| Name | Count | Lived (average) |
|---|---|---|
| John | 21,330 | 72.5 years |
| Mary | 19,863 | 79.3 years |
| William | 17,142 | 72.8 years |
| Joseph | 15,934 | 72.7 years |
| James | 13,921 | 70.5 years |
| Anna | 11,849 | 80.5 years |
| Charles | 9,817 | 73.0 years |
| George | 8,608 | 73.3 years |
| Margaret | 8,361 | 78.0 years |
| Helen | 7,813 | 78.2 years |
| Most common last names in Philadelphia County, PA among deceased individuals | ||
| Last name | Count | Lived (average) |
|---|---|---|
| Smith | 6,005 | 73.1 years |
| Williams | 5,027 | 71.1 years |
| Johnson | 4,865 | 71.6 years |
| Brown | 4,652 | 72.9 years |
| Jones | 4,144 | 71.7 years |
| Miller | 2,825 | 74.7 years |
| Davis | 2,819 | 71.8 years |
| Jackson | 2,438 | 71.8 years |
| Robinson | 2,261 | 72.2 years |
| Wilson | 2,230 | 72.8 years |
| Businesses in Philadelphia County, PA | ||||
| Name | Count | Name | Count | |
|---|---|---|---|---|
| 7-Eleven | 47 | La-Z-Boy | 2 | |
| ALDI | 4 | Lane Bryant | 5 | |
| ALDO | 2 | Lane Furniture | 2 | |
| AMF Bowling | 1 | LensCrafters | 1 | |
| AT&T | 8 | Levi Strauss & Co. | 1 | |
| Ace Hardware | 1 | Little Caesars Pizza | 9 | |
| Advance Auto Parts | 9 | Loews | 1 | |
| Aeropostale | 1 | Lowe's | 4 | |
| Aerosoles | 1 | Macy's | 2 | |
| Ann Taylor | 5 | Marriott | 7 | |
| Apple Store | 1 | Marshalls | 3 | |
| Applebee's | 6 | MasterBrand Cabinets | 38 | |
| Arby's | 2 | Mazda | 1 | |
| AutoZone | 17 | McDonald's | 53 | |
| Avenue | 3 | Men's Wearhouse | 3 | |
| Bally Total Fitness | 5 | Microtel | 1 | |
| Banana Republic | 2 | Motherhood Maternity | 4 | |
| Barnes & Noble | 1 | New Balance | 15 | |
| Baskin-Robbins | 5 | New York & Co | 2 | |
| Bath & Body Works | 5 | Nike | 123 | |
| Bed Bath & Beyond | 1 | Nissan | 1 | |
| Ben & Jerry's | 2 | Office Depot | 1 | |
| Best Western | 2 | OfficeMax | 2 | |
| Blockbuster | 8 | Old Country Buffet | 1 | |
| Brooks Brothers | 3 | Old Navy | 4 | |
| Brookstone | 3 | Olive Garden | 2 | |
| Budget Car Rental | 5 | Panda Express | 1 | |
| Burger King | 21 | Papa John's Pizza | 6 | |
| CVS | 43 | Pathmark | 11 | |
| Casual Male XL | 3 | Payless | 26 | |
| Catherines | 1 | Penske | 5 | |
| Charlotte Russe | 1 | PetSmart | 4 | |
| Chevrolet | 2 | Pier 1 Imports | 1 | |
| Chick-Fil-A | 8 | Pizza Hut | 11 | |
| Chipotle | 3 | Popeyes | 16 | |
| Chuck E. Cheese's | 2 | Pottery Barn | 1 | |
| Church's Chicken | 10 | Qdoba Mexican Grill | 5 | |
| Cinnabon | 2 | Quiznos | 10 | |
| Cold Stone Creamery | 1 | RadioShack | 22 | |
| Comfort Inn | 1 | Ramada | 1 | |
| Cricket Wireless | 88 | Raymour & Flanigan | 3 | |
| Curves | 2 | Red Lobster | 1 | |
| DHL | 16 | Rite Aid | 86 | |
| Dairy Queen | 3 | Rodeway Inn | 1 | |
| Days Inn | 1 | Ruby Tuesday | 3 | |
| Deb | 2 | Rue21 | 1 | |
| Decora Cabinetry | 5 | Ryder Rental & Truck Leasing | 3 | |
| Domino's Pizza | 10 | SAS Shoes | 2 | |
| DressBarn | 4 | SONIC Drive-In | 1 | |
| Dressbarn | 3 | Sam's Club | 1 | |
| Dunkin Donuts | 117 | Sears | 5 | |
| Express | 1 | Sephora | 1 | |
| Extended Stay America | 1 | Sheraton | 4 | |
| Extended Stay Deluxe | 1 | Skechers USA | 1 | |
| Famous Footwear | 2 | Spencer Gifts | 1 | |
| Fashion Bug | 4 | Sprint Nextel | 13 | |
| FedEx | 156 | Staples | 9 | |
| Finish Line | 3 | Starbucks | 34 | |
| Firestone Complete Auto Care | 3 | Subway | 40 | |
| Food Basics | 2 | Superfresh | 5 | |
| Foot Locker | 18 | T-Mobile | 11 | |
| Forever 21 | 1 | T.G.I. Driday's | 2 | |
| GNC | 46 | T.J.Maxx | 1 | |
| GameStop | 28 | Taco Bell | 16 | |
| Gap | 5 | Talbots | 1 | |
| Giant | 1 | Target | 6 | |
| Goodwill | 1 | The Athlete's Foot | 1 | |
| Gymboree | 1 | The Room Place | 3 | |
| H&M | 3 | Toyota | 1 | |
| H&R Block | 37 | Toys"R"Us | 10 | |
| Haworth | 2 | Trader Joe's | 1 | |
| Hilton | 9 | Travelodge | 1 | |
| Holiday Inn | 5 | True Value | 15 | |
| Home Depot | 6 | U-Haul | 39 | |
| Honda | 2 | UPS | 212 | |
| Hyatt | 2 | Urban Outfitters | 2 | |
| Hyundai | 2 | Value City Furniture | 2 | |
| IHOP | 5 | Vans | 4 | |
| IKEA | 1 | Verizon Wireless | 11 | |
| J.Crew | 1 | Victoria's Secret | 3 | |
| JCPenney | 1 | Volkswagen | 1 | |
| JoS. A. Bank | 2 | Walgreens | 19 | |
| Johnny Rockets | 1 | Walmart | 4 | |
| Jones New York | 7 | Wendy's | 18 | |
| Justice | 1 | Westin | 1 | |
| KFC | 24 | Wet Seal | 1 | |
| Kmart | 7 | Whole Foods Market | 2 | |
| Kohl's | 1 | World Gym | 1 | |
| LA Fitness | 6 | YMCA | 7 | |
Philadelphia County on our top lists:
- #2 on the list of "Top 101 counties with the highest lead air pollution readings in 2012 (µg/m3)"
- #4 on the list of "Top 101 counties with the most Mainline Protestant congregations"
- #4 on the list of "Top 101 counties with the most Mainline Protestant congregations (pop. 50,000+)"
- #6 on the list of "Top 101 counties with the most Catholic congregations"
- #7 on the list of "Top 101 counties with the most Catholic congregations (pop. 50,000+)"
- #8 on the list of "Top 101 counties with highest percentage of residents voting for Obama (Democrat) in the 2012 Presidential Election (pop. 50,000+)"
- #8 on the list of "Top 101 counties with the most Black Protestant congregations (pop. 50,000+)"
- #8 on the list of "Top 101 counties with the most Black Protestant congregations"
- #8 on the list of "Top 101 counties with the highest number of infant deaths per 1000 residents 2007-2013 (pop. 50,000+)"
- #9 on the list of "Top 101 counties with the most Orthodox congregations"
- #9 on the list of "Top 101 counties with the most Orthodox congregations (pop. 50,000+)"
- #10 on the list of "Top 101 counties with the highest Nitrogen Dioxide air pollution readings in 2012 (ppm)"
- #10 on the list of "Top 101 counties with the most Black Protestant adherents (pop. 50,000+)"
- #10 on the list of "Top 101 counties with the most Black Protestant adherents"
- #11 on the list of "Top 101 counties with the largest decrease in the number of deaths per 1000 residents 2000-2006 to 2007-2013 (pop. 50,000+)"
- #12 on the list of "Top 101 counties with the highest surface withdrawal of fresh water for public supply (pop. 50,000+)"
- #13 on the list of "Top 101 counties with the lowest percentage of residents that keep firearms around their homes"
- #13 on the list of "Top 101 counties with the highest surface withdrawal of fresh water for public supply"
- #14 on the list of "Top 101 counties with the most Mainline Protestant adherents"
- #14 on the list of "Top 101 counties with the most Mainline Protestant adherents (pop. 50,000+)"