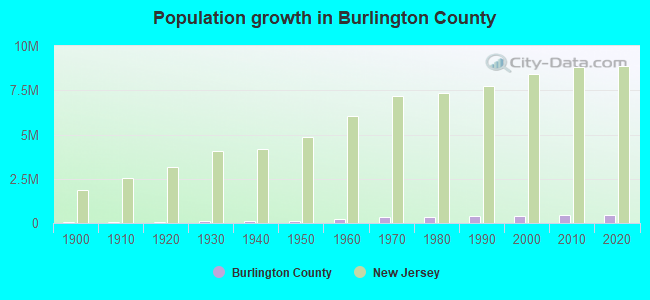
Burlington County, New Jersey (NJ)
County owner-occupied free and clear houses and condos in 2010: 31,333
County owner-occupied houses and condos in 2000: 119,500
Renter-occupied apartments: 36,662 (it was 34,871 in 2000)
| % of renters here: | 23% |
| State: | 35% |
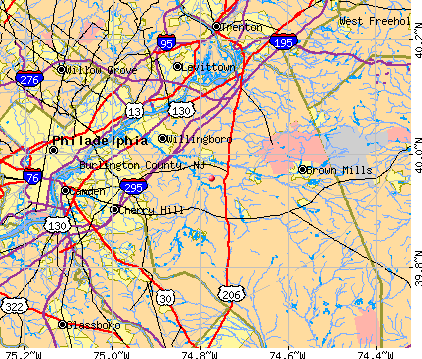
Land area: 805 sq. mi.
Water area: 14.9 sq. mi.
Population density: 579 people per square mile (high).
Industries providing employment: Educational, health and social services (25.6%), Professional, scientific, management, administrative, and waste management services (12.8%).
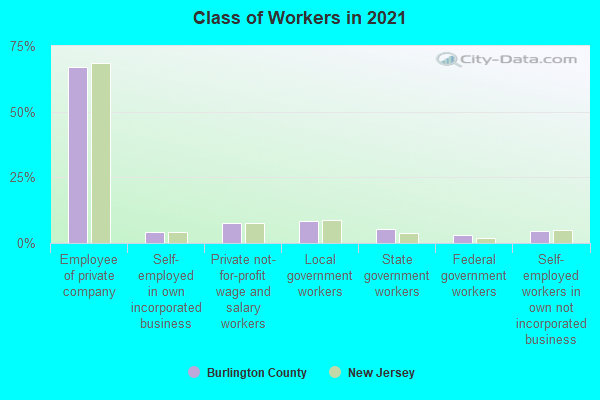
Type of workers:
- Private wage or salary: 75%
- Government: 21%
- Self-employed, not incorporated: 4%
- Unpaid family work: 0%
- OSM Map
- General Map
- Google Map
- MSN Map

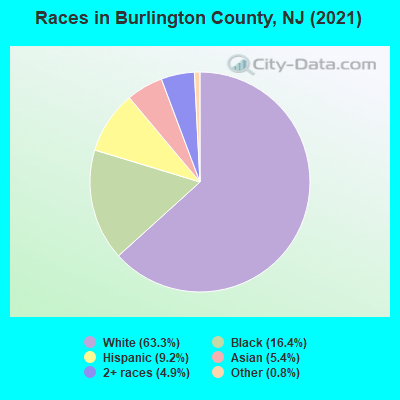
- 291,08562.5%White Non-Hispanic Alone
- 73,36715.7%Black Non-Hispanic Alone
- 44,6299.6%Hispanic or Latino
- 28,1406.0%Asian alone
- 24,7555.3%Two or more races
- 3,9580.8%Some other race alone
- 1380.03%American Indian and Alaska Native alone
- 310.01%Native Hawaiian and Other
Pacific Islander alone
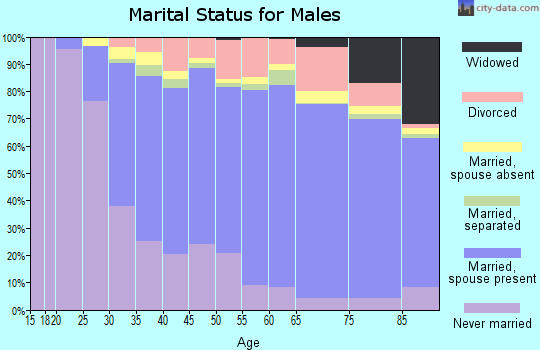
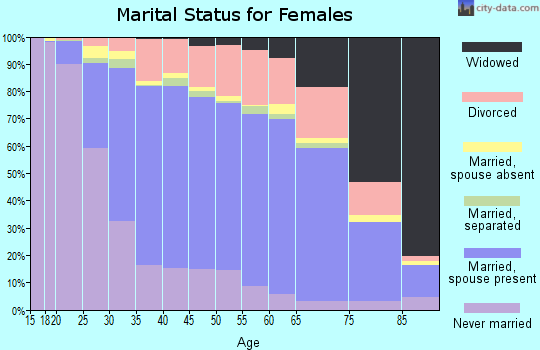
| Median resident age: | 41.5 years |
| New Jersey median age: | 40.4 years |
| Males: 230,343 | |
| Females: 235,760 |

 | Family friendly towns in Camden County / Burlington County, with good amenities? (5 replies) |
| Commute from Woolwich township to Philadelphia (11 replies) |
| Why Is South/Central Jersey So Relatively Undeveloped? (83 replies) |
| President Trump is Coming to Wildwood, NJ (85 replies) |
| Mt Laurel vs Marlton NJ (21 replies) |
| Keeping South Jersey on my Radar for Now.... (41 replies) |
| Burlington County: | 2.0 people |
| New Jersey: | 3 people |
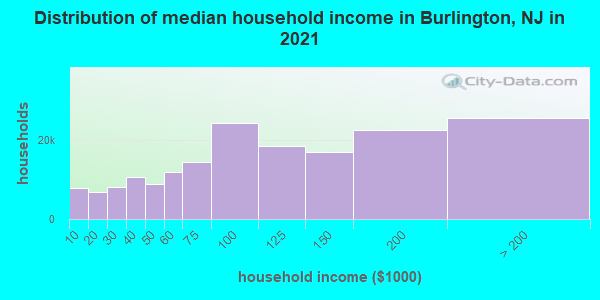
Estimated median household income in 2022: $100,478 ($58,608 in 1999)
| This county: | $100,478 |
| New Jersey: | $96,346 |
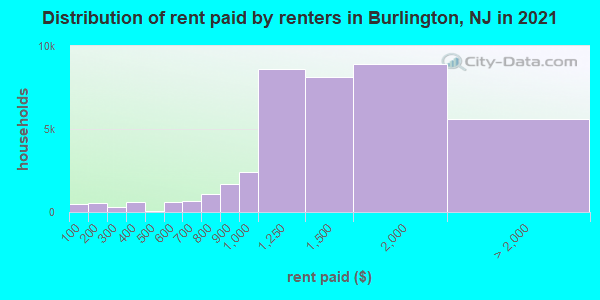
Median contract rent in 2022 for apartments: $1,356 (lower quartile is $1,005, upper quartile is $1,818)
| This county: | $1356 |
| State: | $1399 |
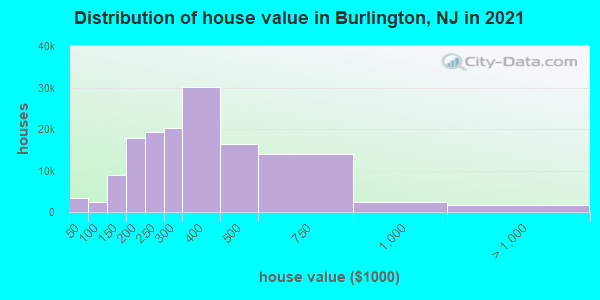
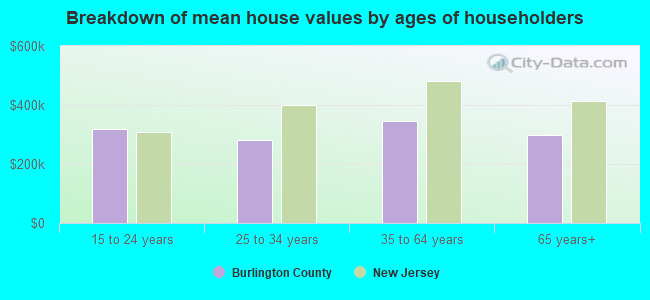
Estimated median house or condo value in 2022: $329,300 (it was $134,000 in 2000)
| Burlington: | $329,300 |
| New Jersey: | $428,900 |
Mean price in 2022:
Median monthly housing costs for homes and condos with a mortgage: $2,113Detached houses: $374,287
Here: $374,287 State: $537,591 Townhouses or other attached units: $267,082
Here: $267,082 State: $381,113 In 2-unit structures: $173,034
Here: $173,034 State: $444,476 In 3-to-4-unit structures: $422,231
Here: $422,231 State: $457,463 In 5-or-more-unit structures: $166,955
Here: $166,955 State: $368,745 Mobile homes: $65,869
Here: $65,869 State: $119,788
Median monthly housing costs for units without a mortgage: $982
Institutionalized population: 11,614
Crime in 2020 (reported by the sheriff's office or county police, not the county total):
- Murders: 0
- Rapes: 0
- Robberies: 0
- Assaults: 0
- Burglaries: 0
- Thefts: 0
- Auto thefts: 0
Crime in 2019 (reported by the sheriff's office or county police, not the county total):
- Murders: 0
- Rapes: 0
- Robberies: 0
- Assaults: 0
- Burglaries: 0
- Thefts: 0
- Auto thefts: 0
Health of residents in Burlington County based on CDC Behavioral Risk Factor Surveillance System Survey Questionnaires from 2003 to 2012:
General health status score of residents in this county from 1 (poor) to 5 (excellent) is 3.6. This is better than average.74.5% of residents exercised in the past month. This is about average.
46.2% of residents smoked 100+ cigarettes in their lives. This is about average.
74.5% of adult residents drank alcohol in the past 30 days. This is about average.
77.5% of residents visited a dentist within the past year. This is more than average.
Average weight of males is 197 pounds. This is about average.
Average weight of females is 165 pounds. This is about average.
15.6% of residents keep firearms around their homes. This is less than average.
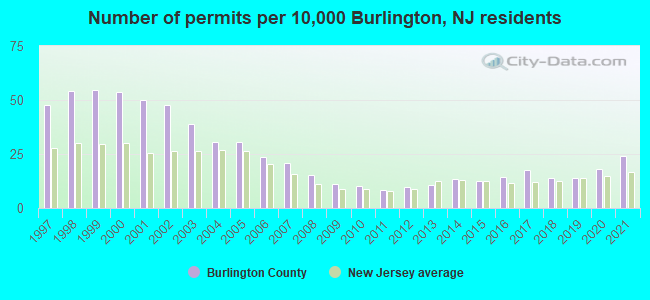
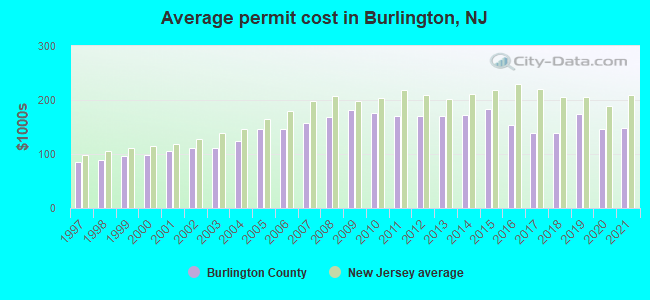
Single-family new house construction building permits:
- 2022: 987 buildings, average cost: $142,600
- 2021: 1027 buildings, average cost: $149,000
- 2020: 771 buildings, average cost: $146,800
- 2019: 589 buildings, average cost: $174,100
- 2018: 591 buildings, average cost: $138,700
- 2017: 751 buildings, average cost: $138,500
- 2016: 603 buildings, average cost: $154,300
- 2015: 539 buildings, average cost: $183,600
- 2014: 560 buildings, average cost: $172,700
- 2013: 447 buildings, average cost: $169,900
- 2012: 410 buildings, average cost: $169,800
- 2011: 346 buildings, average cost: $171,400
- 2010: 436 buildings, average cost: $176,300
- 2009: 461 buildings, average cost: $182,100
- 2008: 653 buildings, average cost: $168,800
- 2007: 876 buildings, average cost: $157,700
- 2006: 996 buildings, average cost: $146,500
- 2005: 1290 buildings, average cost: $145,600
- 2004: 1302 buildings, average cost: $124,000
- 2003: 1639 buildings, average cost: $111,500
- 2002: 2026 buildings, average cost: $111,300
- 2001: 2118 buildings, average cost: $104,500
- 2000: 2282 buildings, average cost: $99,400
- 1999: 2306 buildings, average cost: $95,900
- 1998: 2284 buildings, average cost: $89,300
- 1997: 2012 buildings, average cost: $85,200
Median real estate property taxes paid for housing units with mortgages in 2022: $7,399 (2.2%)
Median real estate property taxes paid for housing units with no mortgage in 2022: $7,126 (2.3%)
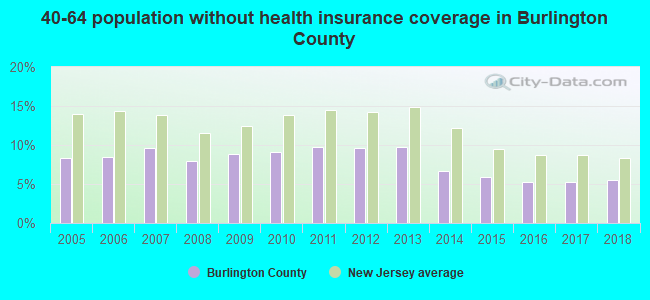
| Burlington County: | 6.6% |
| New Jersey: | 9.7% |
Median age of residents in 2022: 41.5 years old
(Males: 39.9 years old, Females: 43.1 years old)
(Median age for: White residents: 46.5 years old, Black residents: 39.0 years old, American Indian residents: 30.8 years old, Asian residents: 38.4 years old, Hispanic or Latino residents: 31.4 years old, Other race residents: 30.7 years old)
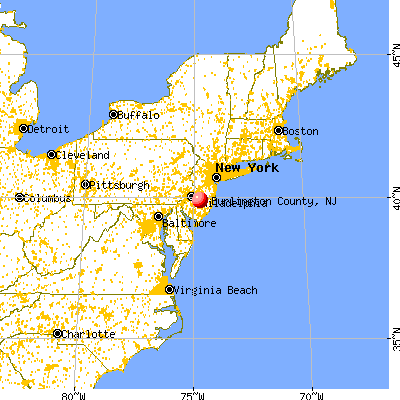
Area name: Philadelphia-Camden-Wilmington, PA-NJ-DE-MD MSA
Fair market rent in 2006 for a 1-bedroom apartment in Burlington County is $742 a month.
Fair market rent for a 2-bedroom apartment is $886 a month.
Fair market rent for a 3-bedroom apartment is $1061 a month.
Cities in this county include: Moorestown-Lenola, Franklin Park, Browns Mills, Marlton, Burlington, Florence-Roebling, Fort Dix, Palmyra, McGuire AFB, Ramblewood.
Neighboring counties: Hamilton County, Indiana  , Guernsey County, Ohio , Harrison County, Ohio , Summit County, Colorado , Perry County, Ohio .
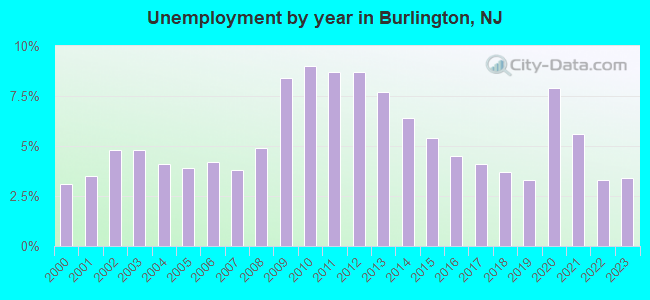
| Here: | 3.9% |
| New Jersey: | 4.5% |
Current college students: 20,140
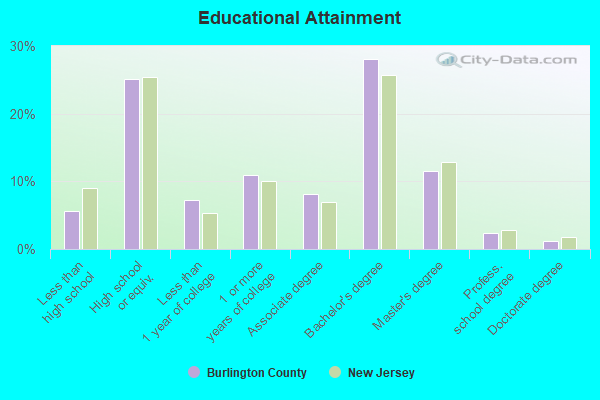
People 25 years of age or older with a high school degree or higher: 94.5%
People 25 years of age or older with a bachelor's degree or higher: 41.9%
Number of foreign born residents: 56,746 (64.7% naturalized citizens)
| Burlington County: | 12.2% |
| Whole state: | 23.5% |
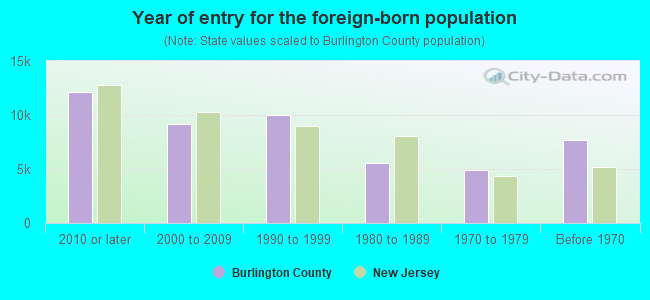
- Year of entry for the foreign-born population
- 16,4702010 or later
- 14,8442000 to 2009
- 9,7661990 to 1999
- 5,5291980 to 1989
- 4,9041970 to 1979
- 7,710Before 1970
Mean travel time to work (commute): minutes
Percentage of county residents living and working in this county: 89.7%
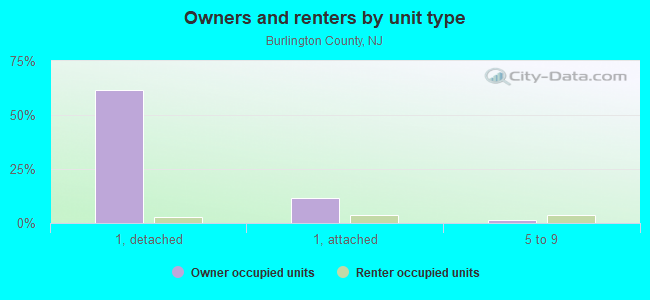
Housing units in structures:
- One, detached: 121,099
- One, attached: 26,237
- Two: 2,958
- 3 or 4: 6,157
- 5 to 9: 7,314
- 10 to 19: 9,749
- 20 to 49: 3,854
- 50 or more: 6,650
- Mobile homes: 2,094
- Boats, RVs, vans, etc.: 88
Housing units in Burlington County with a mortgage: 87,738 (8,002 second mortgage, 175 home equity loan, 6,560 both second mortgage and home equity loan)
Houses without a mortgage: 3,474
| Here: | 96.7% with mortgage |
| State: | 95.9% with mortgage |
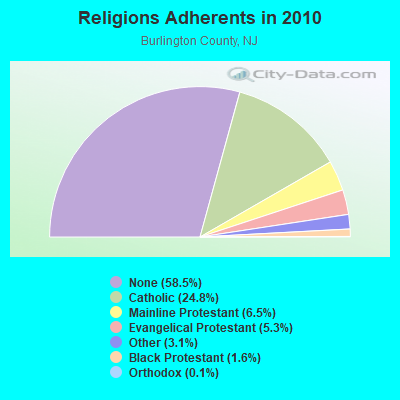
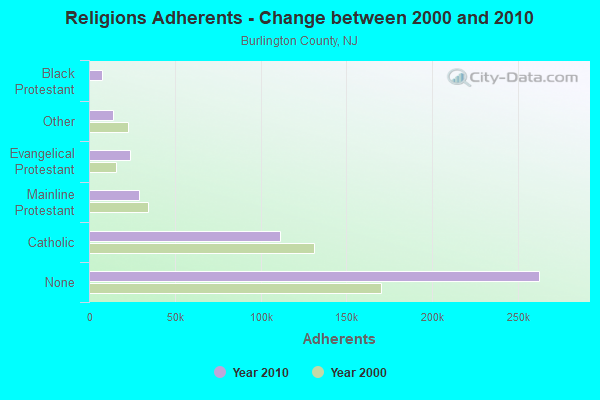
Religion statistics for Burlington County
| Religion | Adherents | Congregations |
|---|---|---|
| Catholic | 111,334 | 22 |
| Mainline Protestant | 29,271 | 118 |
| Evangelical Protestant | 23,751 | 112 |
| Other | 13,995 | 32 |
| Black Protestant | 7,303 | 32 |
| Orthodox | 620 | 2 |
| None | 262,460 | - |
Source: Clifford Grammich, Kirk Hadaway, Richard Houseal, Dale E.Jones, Alexei Krindatch, Richie Stanley and Richard H.Taylor. 2012. 2010 U.S.Religion Census: Religious Congregations & Membership Study. Association of Statisticians of American Religious Bodies. Jones, Dale E., et al. 2002. Congregations and Membership in the United States 2000. Nashville, TN: Glenmary Research Center.
Food Environment Statistics:
| Burlington County: | 1.88 / 10,000 pop. |
| State: | 2.90 / 10,000 pop. |
| Here: | 0.07 / 10,000 pop. |
| New Jersey: | 0.06 / 10,000 pop. |
| This county: | 1.68 / 10,000 pop. |
| New Jersey: | 1.76 / 10,000 pop. |
| Burlington County: | 0.83 / 10,000 pop. |
| New Jersey: | 0.81 / 10,000 pop. |
| This county: | 5.09 / 10,000 pop. |
| State: | 7.15 / 10,000 pop. |
| Burlington County: | 8.9% |
| New Jersey: | 8.3% |
| Burlington County: | 26.0% |
| State: | 23.3% |
| Here: | 14.7% |
| State: | 18.0% |
Agriculture in Burlington County:
Average size of farms: 123 acresAverage value of agricultural products sold per farm: $91,891
Average value of crops sold per acre for harvested cropland: $1248.18
The value of nursery, greenhouse, floriculture, and sod as a percentage of the total market value of agricultural products sold: 46.06%
The value of livestock, poultry, and their products as a percentage of the total market value of agricultural products sold: 12.47%
Average total farm production expenses per farm: $74,988
Harvested cropland as a percentage of land in farms: 52.48%
Irrigated harvested cropland as a percentage of land in farms: 22.88%
Average market value of all machinery and equipment per farm: $65,531
The percentage of farms operated by a family or individual: 81.02%
Average age of principal farm operators: 54 years
Average number of cattle and calves per 100 acres of all land in farms: 3.32
Milk cows as a percentage of all cattle and calves: 41.89%
Corn for grain: 7226 harvested acres
All wheat for grain: 3428 harvested acres
Soybeans for beans: 22022 harvested acres
Vegetables: 4,548 harvested acres
Land in orchards: 568 acres
Earthquake activity:
Burlington County-area historical earthquake activity is significantly above New Jersey state average. It is 67% smaller than the overall U.S. average.On 8/23/2011 at 17:51:04, a magnitude 5.8 (5.8 MW, Depth: 3.7 mi, Class: Moderate, Intensity: VI - VII) earthquake occurred 221.2 miles away from Burlington County center
On 1/16/1994 at 01:49:16, a magnitude 4.6 (4.6 MB, 4.6 LG, Depth: 3.1 mi, Class: Light, Intensity: IV - V) earthquake occurred 71.5 miles away from the county center
On 10/7/1983 at 10:18:46, a magnitude 5.3 (5.1 MB, 5.3 LG, 5.1 ML) earthquake occurred 277.4 miles away from the county center
On 1/16/1994 at 00:42:43, a magnitude 4.2 (4.2 MB, 4.0 LG, Depth: 3.1 mi) earthquake occurred 70.0 miles away from the county center
On 11/30/2017 at 21:47:31, a magnitude 4.1 (4.1 MW, Depth: 6.1 mi) earthquake occurred 63.0 miles away from Burlington County center
On 4/20/2002 at 10:50:47, a magnitude 5.3 (5.3 ML, Depth: 3.0 mi) earthquake occurred 320.0 miles away from the county center
Magnitude types: regional Lg-wave magnitude (LG), body-wave magnitude (MB), local magnitude (ML), moment magnitude (MW)
Most recent natural disasters:
- New Jersey Tropical Storm Isaias, Incident Period: August 4, 2020, Major Disaster (Presidential) Declared DR-4574-NJ: December 11, 2020, FEMA Id: 4574, Natural disaster type: Tropical Storm
- New Jersey Covid-19 Pandemic, Incident Period: January 20, 2020, Major Disaster (Presidential) Declared DR-4488-NJ: March 25, 2020, FEMA Id: 4488, Natural disaster type: Other
- New Jersey Severe Winter Storm And Snowstorm, Incident Period: March 6, 2018 - March 7, 2018, FEMA Id: 4368, Natural disaster type: Snowstorm, Winter Storm
- New Jersey Severe Winter Storm and Snowstorm, Incident Period: January 22, 2016 to January 24, 2016, Major Disaster (Presidential) Declared DR-4264: March 14, 2016, FEMA Id: 4264, Natural disaster type: Snowstorm, Winter Storm
- New Jersey Severe Storm, Incident Period: June 23, 2015, Major Disaster (Presidential) Declared DR-4231: July 22, 2015, FEMA Id: 4231, Natural disaster type: Storm
- New Jersey Hurricane Sandy, Incident Period: October 26, 2012 to November 08, 2012, Emergency Declared EM-3354: October 28, 2012, FEMA Id: 3354, Natural disaster type: Hurricane
- New Jersey Hurricane Sandy, Incident Period: October 26, 2012 to November 08, 2012, Major Disaster (Presidential) Declared DR-4086: October 30, 2012, FEMA Id: 4086, Natural disaster type: Hurricane
- New Jersey Hurricane Irene, Incident Period: August 27, 2011 to September 05, 2011, Major Disaster (Presidential) Declared DR-4021: August 31, 2011, FEMA Id: 4021, Natural disaster type: Hurricane
- New Jersey Hurricane Irene, Incident Period: August 26, 2011 to September 05, 2011, Emergency Declared EM-3332: August 27, 2011, FEMA Id: 3332, Natural disaster type: Hurricane
- New Jersey Severe Winter Storm and Snowstorm, Incident Period: December 26, 2010 to December 27, 2010, Major Disaster (Presidential) Declared DR-1954: February 04, 2011, FEMA Id: 1954, Natural disaster type: Snowstorm, Winter Storm
- 17 other natural disasters have been reported since 1953.
The number of natural disasters in Burlington County (27) is a lot greater than the US average (15).
Major Disasters (Presidential) Declared: 16
Emergencies Declared: 9
Causes of natural disasters: Hurricanes: 6, Snowstorms: 6, Floods: 4, Storms: 4, Winter Storms: 4, Blizzards: 2, Heavy Rains: 2, Water Shortages: 2, Fire: 1, Tornado: 1, Tropical Storm: 1, Wind: 1, Other: 3 (Note: some incidents may be assigned to more than one category).
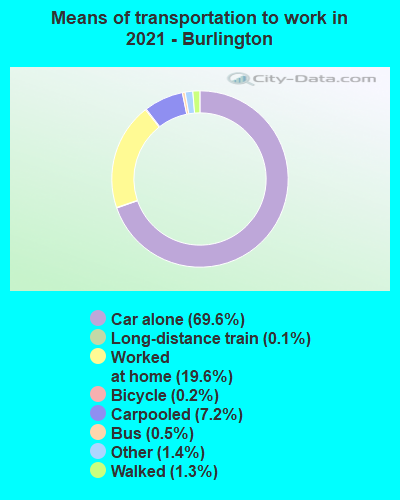
Means of transportation to work:
- Drove a car alone: 159,415 (71.6%)
- Carpooled: 20,351 (9.1%)
- Bus: 741 (0.3%)
- Subway or elevated rail: 250 (0.1%)
- Long-distance train or commuter rail: 1 (0.0%)
- Taxicab, motorcycle, or other means: 3,253 (1.5%)
- Bicycle: 269 (0.1%)
- Walked: 2,089 (0.9%)
- Worked at home: 36,318 (16.3%)
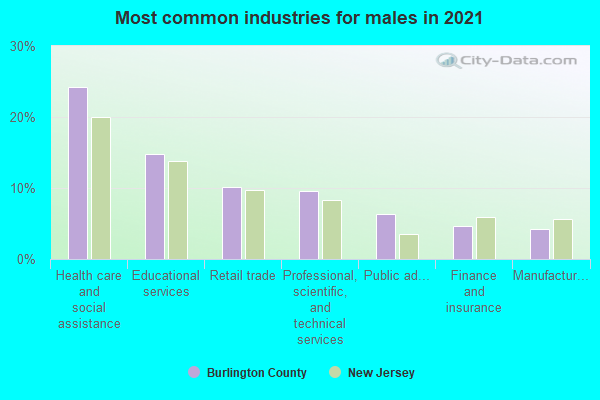
- Health care and social assistance (22%)
- Educational services (16%)
- Retail trade (9%)
- Professional, scientific, and technical services (7%)
- Public administration (6%)
- Finance and insurance (5%)
- Manufacturing (5%)

- Health care and social assistance (24%)
- Educational services (17%)
- Retail trade (10%)
- Professional, scientific, and technical services (8%)
- Public administration (7%)
- Finance and insurance (6%)
- Manufacturing (5%)
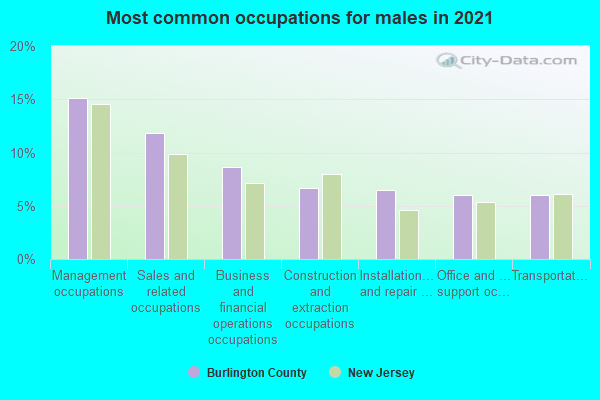
- Management occupations (14%)
- Sales and related occupations (11%)
- Business and financial operations occupations (9%)
- Construction and extraction occupations (8%)
- Computer and mathematical occupations (6%)
- Office and administrative support occupations (5%)
- Transportation occupations (5%)
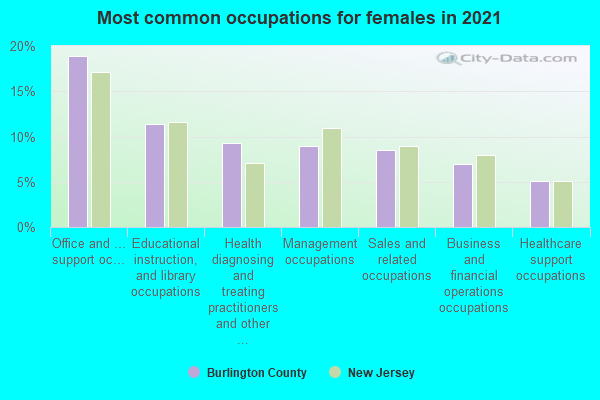
- Office and administrative support occupations (17%)
- Management occupations (14%)
- Educational instruction, and library occupations (12%)
- Health diagnosing and treating practitioners and other technical occupations (8%)
- Business and financial operations occupations (7%)
- Sales and related occupations (7%)
- Healthcare support occupations (5%)
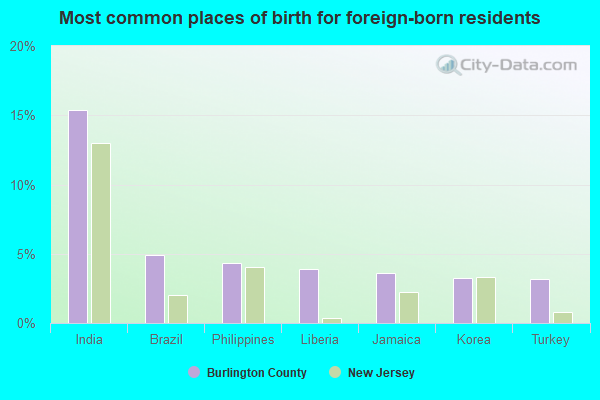
- India (15%)
- Brazil (6%)
- Turkey (5%)
- Philippines (4%)
- Jamaica (3%)
- Nigeria (3%)
- Liberia (3%)
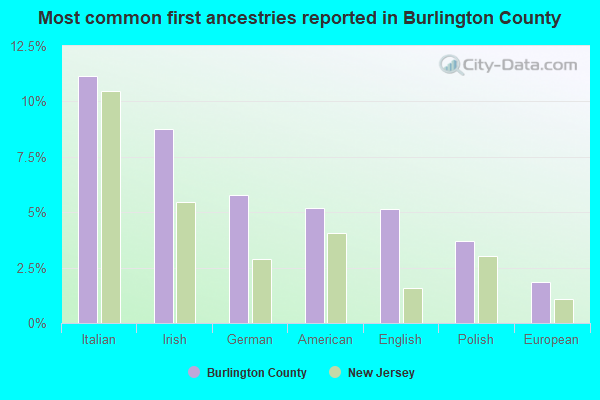
- Italian (11%)
- Irish (8%)
- German (6%)
- American (6%)
- English (5%)
- Polish (4%)
- Turkish (2%)
People in group quarters in Burlington County, New Jersey in 2010:
- 4,665 people in federal prisons
- 3,282 people in correctional facilities intended for juveniles
- 2,245 people in nursing facilities/skilled-nursing facilities
- 1,003 people in state prisons
- 434 people in residential treatment centers for adults
- 360 people in military barracks and dormitories (nondisciplinary)
- 339 people in workers' group living quarters and job corps centers
- 216 people in group homes intended for adults
- 189 people in local jails and other municipal confinement facilities
- 156 people in other noninstitutional facilities
- 114 people in residential treatment centers for juveniles (non-correctional)
- 95 people in emergency and transitional shelters (with sleeping facilities) for people experiencing homelessness
- 77 people in group homes for juveniles (non-correctional)
- 39 people in hospitals with patients who have no usual home elsewhere
People in group quarters in Burlington County, New Jersey in 2000:
- 4,217 people in federal prisons and detention centers
- 4,082 people in state prisons
- 2,954 people in nursing homes
- 1,237 people in military barracks, etc.
- 364 people in other noninstitutional group quarters
- 361 people in local jails and other confinement facilities (including police lockups)
- 245 people in homes for the mentally retarded
- 123 people in religious group quarters
- 117 people in homes for the mentally ill
- 100 people in training schools for juvenile delinquents
- 100 people in other group homes
- 52 people in residential treatment centers for emotionally disturbed children
- 42 people in homes or halfway houses for drug/alcohol abuse
- 41 people in agriculture workers' dormitories on farms
- 39 people in other nonhousehold living situations
- 38 people in unknown juvenile institutions
- 19 people in mental (psychiatric) hospitals or wards
- 19 people in schools, hospitals, or wards for the intellectually disabled
- 18 people in other types of correctional institutions
- 4 people in military transient quarters for temporary residents
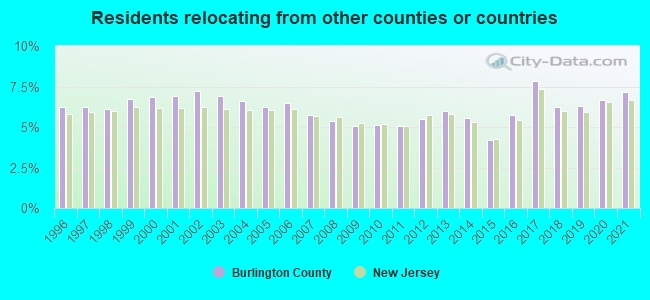
7.18% of this county's 2021 resident taxpayers lived in other counties in 2020 ($71,287 average adjusted gross income)
| Here: | 7.18% |
| New Jersey average: | 6.70% |
0.07% of residents moved from foreign countries ($594 average AGI)
Burlington County: 0.07% New Jersey average: 0.01%
3.98% relocated from other counties in New Jersey ($39,381 average AGI)
3.13% relocated from other states ($31,313 average AGI)
Burlington County: 3.13% New Jersey average: 2.98%
Top counties from which taxpayers relocated into this county between 2020 and 2021:
| from Camden County, NJ | |
| from Mercer County, NJ | |
| from Philadelphia County, PA | |
| from Ocean County, NJ | |
| from Middlesex County, NJ | |
| from Bucks County, PA | |
| from Gloucester County, NJ |
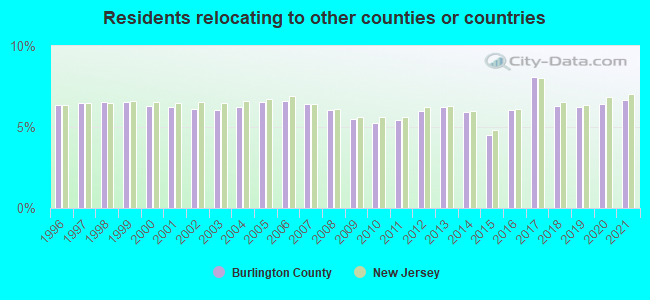
6.64% of this county's 2020 resident taxpayers moved to other counties in 2021 ($102,719 average adjusted gross income)
| Here: | 6.64% |
| New Jersey average: | 7.02% |
0.08% of residents moved to foreign countries ($611 average AGI)
Burlington County: 0.08% New Jersey average: 0.02%
3.01% relocated to other counties in New Jersey ($34,029 average AGI)
3.56% relocated to other states ($68,078 average AGI)
Burlington County: 3.56% New Jersey average: 3.32%
Top counties to which taxpayers relocated from this county between 2020 and 2021:
| to Camden County, NJ | |
| to Mercer County, NJ | |
| to Philadelphia County, PA | |
| to Gloucester County, NJ | |
| to Ocean County, NJ | |
| to Bucks County, PA | |
| to Atlantic County, NJ |
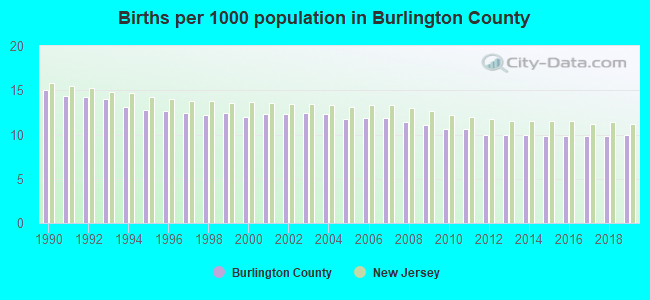
Births per 1000 population from 1990 to 1999: 13.3
Births per 1000 population from 2000 to 2009: 11.9
Births per 1000 population from 2010 to 2022: 8.5
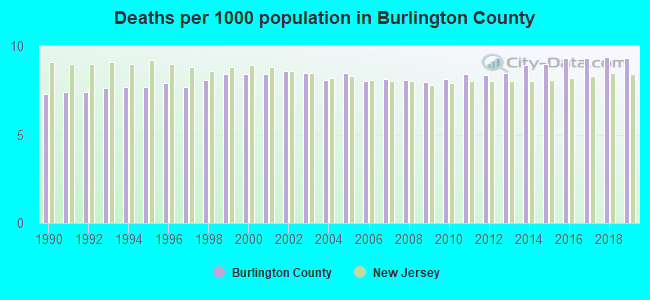
Deaths per 1000 population from 1990 to 1999: 7.7
Deaths per 1000 population from 2000 to 2009: 8.3
Deaths per 1000 population from 2010 to 2020: 9.0
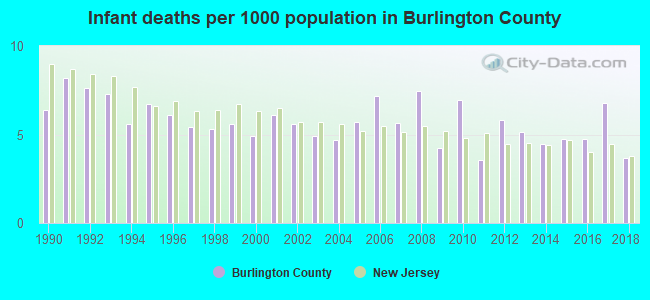
Infant deaths per 1000 live births from 1990 to 1999: 6.4
Infant deaths per 1000 live births from 2000 to 2009: 5.6
Infant deaths per 1000 live births from 2010 to 2021: 4.8
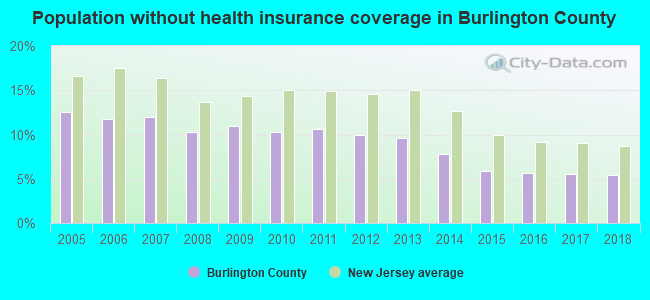
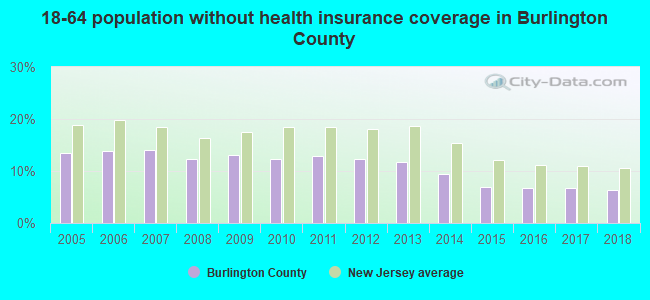
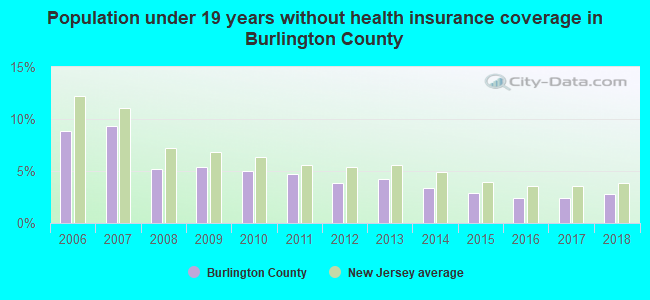
Persons under 19 years old without health insurance coverage in 2018: 2.8%
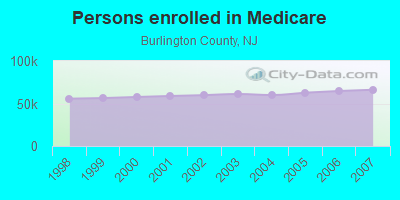
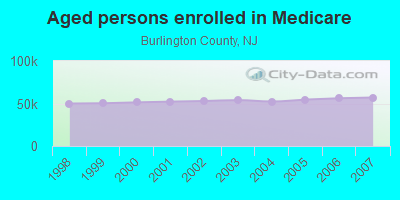
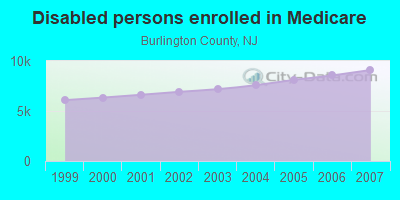
Persons enrolled in hospital insurance and/or supplemental medical insurance (Medicare) in July 1, 2007: 66,159 (57,058 aged, 9,101 disabled)
Children under 18 without health insurance coverage in 2007: 6,967 (6%)
Most common underlying causes of death in Burlington County, New Jersey in 1999 - 2019:
- Atherosclerotic heart disease (5,767)
- Bronchus or lung, unspecified - Malignant neoplasms (4,847)
- Acute myocardial infarction, unspecified (3,949)
- Unspecified dementia (2,884)
- Chronic obstructive pulmonary disease, unspecified (2,859)
- Atherosclerotic cardiovascular disease, so described (2,765)
- Stroke, not specified as haemorrhage or infarction (2,292)
- Congestive heart failure (1,769)
- Alzheimer disease, unspecified (1,745)
- Septicaemia, unspecified (1,644)
Population without health insurance coverage in 2000: 9%
Children under 18 without health insurance coverage in 2000: 6%
Short term general hospital admissions per 100,000 population in 2004: 7,653
Short term general hospital beds per 100,000 population in 2004: 139
Emergency room visits per 100,000 population in 2004: 19,621
General practice office based MDs per 100,000 population in 2005: 1,162
Medical specialist MDs per 100,000 population in 2005: 808
Dentists per 100,000 population in 1998: 12
Total births per 100,000 population, July 2005 - July 2006 : 51
Total deaths per 100,000 population, July 2005 - July 2006: 92
Limited-service eating places per 100,000 population in 2005 : 18
Beer, wine & liquor stores per 100,000 population in 2005: 1
Homicides per 1,000,000 population from 2000 to 2006: 27.0. This is less than state average.
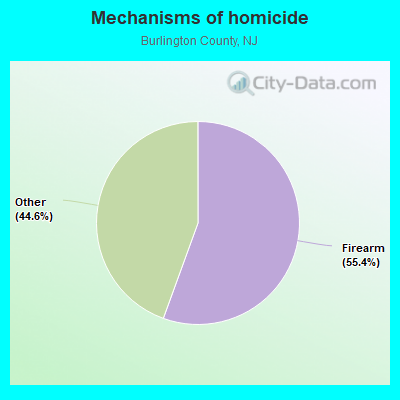
- Firearm - 15.0
- Other - 12.0
Suicides per 1,000,000 population from 2000 to 2006: 79.4. This is more than state average.
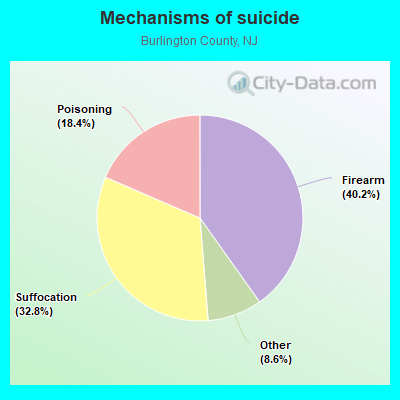
- Firearm - 31.9
- Suffocation - 26.0
- Poisoning - 14.7
- Other - 6.8
Household type by relationship:
Households: 466,103- Male householders: 85,891 (19,054 living alone), Female householders: 90,443 (28,302 living alone)
92,840 spouses (92,542 opposite-sex spouses), 11,677 unmarried partners, (11,184 opposite-sex unmarried partners), 136,584 children (128,308 natural, 2,406 adopted, 5,870 stepchildren), 11,271 grandchildren, 3,886 brothers or sisters, 5,451 parents, 428 foster children, 7,789 other relatives, 8,534 non-relatives
- In group quarters: 11,309
Size of family households: 53,644 2-persons, 25,963 3-persons, 25,186 4-persons, 10,392 5-persons, 3,041 6-persons, 1,733 7-or-more-persons.
Size of nonfamily households: 47,356 1-person, 7,759 2-persons, 1,019 3-persons, 165 4-persons, 76 5-persons.
63,513 married couples with children.
20,383 single-parent households (5,224 men, 15,159 women).
86.1% of residents of Burlington speak English at home.
5.4% of residents speak Spanish at home (68% speak English very well, 21% speak English well, 8% speak English not well, 2% don't speak English at all).
4.2% of residents speak other Indo-European language at home (62% speak English very well, 13% speak English well, 14% speak English not well, 11% don't speak English at all).
3.3% of residents speak Asian or Pacific Island language at home (62% speak English very well, 28% speak English well, 9% speak English not well).
1.1% of residents speak other language at home (60% speak English very well, 32% speak English well, 7% speak English not well).
In fiscal year 2004:
Federal Government expenditure: $3,732,818,000 ($8,301 per capita)
Department of Defense expenditure: $1,752,786,000
Federal direct payments to individuals for retirement and disability: $1,139,358,000
Federal other direct payments to individuals: $456,292,000
Federal direct payments not to individuals: $8,207,000
Federal grants: $266,210,000
Federal procurement contracts: $1,338,119,000 ($1,240,170,000 Department of Defense)
Federal salaries and wages: $524,632,000 ($399,014,000 Department of Defense)
Federal Government direct loans: $15,954,000
Federal guaranteed/insured loans: $378,698,000
Federal Government insurance: $531,729,000
Population change from April 1, 2000 to July 1, 2005:
Births: 27,665| Here: | 61 per 1000 residents |
| State: | 69 per 1000 residents |
Deaths: 19,392
| Here: | 43 per 1000 residents |
| State: | 44 per 1000 residents |
Net international migration: +3,657
| Here: | +8 per 1000 residents |
| State: | +33 per 1000 residents |
Net internal migration: +15,947
| Here: | |
| State: |
Total withdrawal of fresh water for public supply: 50.44 millions of gallons per day (61% from ground, 39% from surface)
| Here: | 7.2 |
| State: | 6.8 |
| Here: | 4.2 |
| State: | 3.9 |
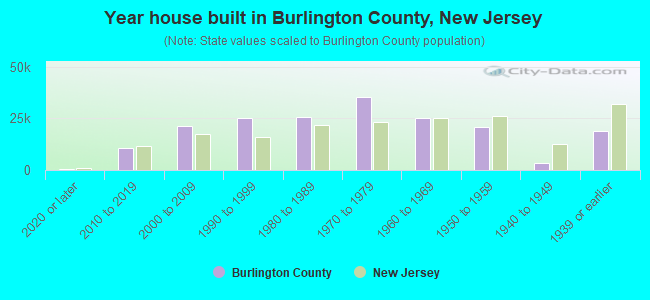
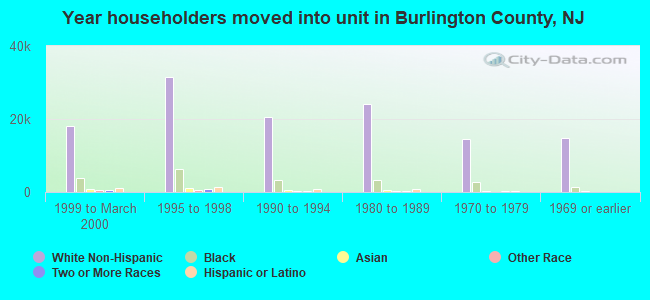
- Year house built in Burlington County, New Jersey
- 2,8662020 or later
- 7,2962010 to 2019
- 21,4332000 to 2009
- 22,9891990 to 1999
- 27,6971980 to 1989
- 32,1691970 to 1979
- 24,9511960 to 1969
- 21,6501950 to 1959
- 6,2561940 to 1949
- 18,8931939 or earlier
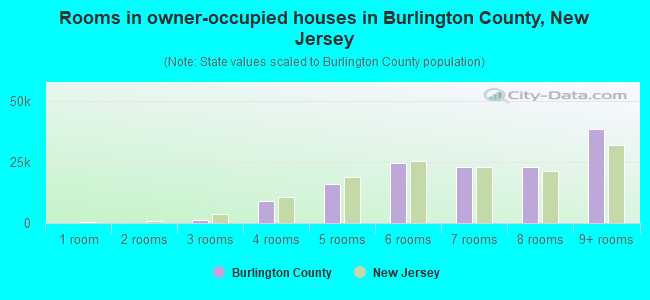
- Rooms in owner-occupied houses in Burlington County, New Jersey
- 2621 room
- 4782 rooms
- 1,8803 rooms
- 7,8284 rooms
- 17,4795 rooms
- 23,1736 rooms
- 22,9817 rooms
- 24,0538 rooms
- 36,9239+ rooms
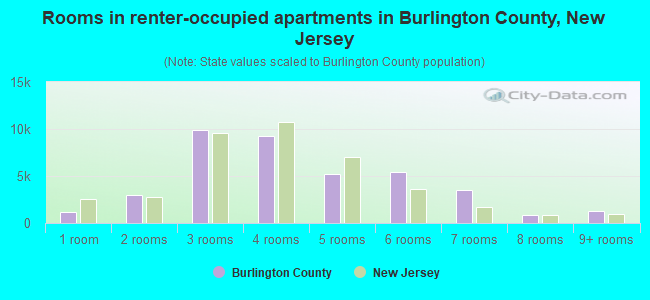
- Rooms in renter-occupied apartments in Burlington County, New Jersey
- 2,3301 room
- 2,9832 rooms
- 9,1653 rooms
- 9,1494 rooms
- 7,0055 rooms
- 4,0736 rooms
- 3,5857 rooms
- 1,7158 rooms
- 1,2729+ rooms
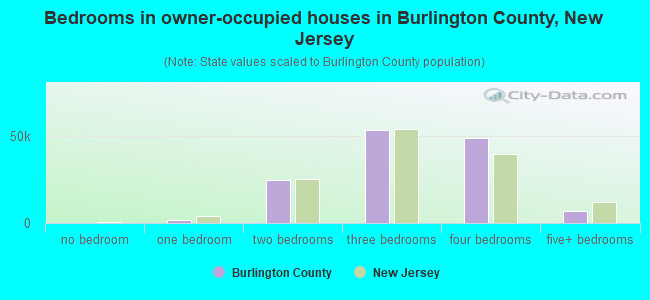
- Bedrooms in owner-occupied houses in Burlington County, New Jersey
- 434no bedroom
- 2,2611 bedroom
- 21,5362 bedrooms
- 52,6993 bedrooms
- 48,5464 bedrooms
- 9,5815+ bedrooms
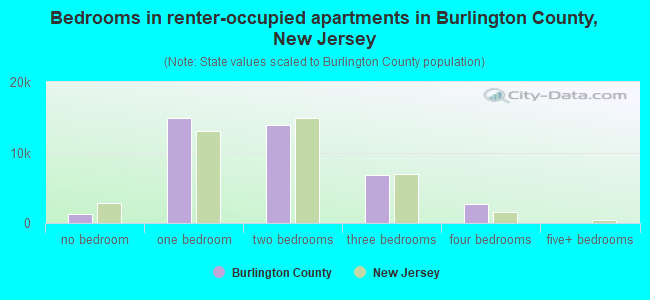
- Bedrooms in renter-occupied apartments in Burlington County, New Jersey
- 2,345no bedroom
- 14,7581 bedroom
- 13,6482 bedrooms
- 8,2703 bedrooms
- 1,6534 bedrooms
- 6035+ bedrooms
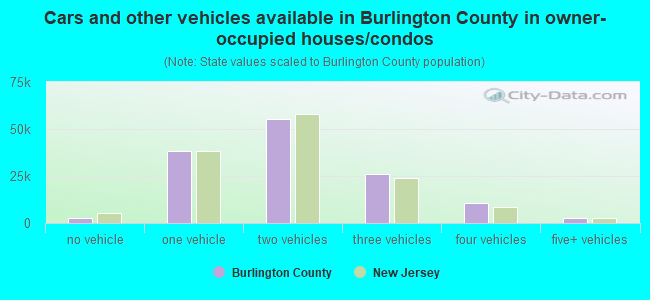
- Cars and other vehicles available in Burlington County in owner-occupied houses/condos
- 3,288no vehicle
- 33,9401 vehicle
- 63,2692 vehicles
- 23,8643 vehicles
- 7,8464 vehicles
- 2,8505+ vehicles
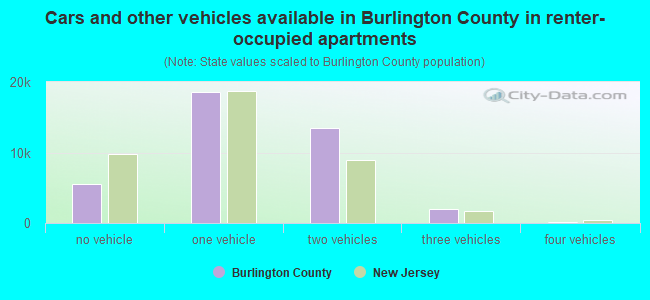
- Cars and other vehicles available in Burlington County in renter-occupied apartments
- 5,212no vehicle
- 22,6011 vehicle
- 11,5792 vehicles
- 1,5983 vehicles
- 2424 vehicles
- 455+ vehicles
89.3% of Burlington County residents lived in the same house 1 years ago.
Out of people who lived in different houses, 30% lived in this county.
Out of people who lived in different counties, 51% lived in New Jersey.
| Burlington County: | 89.3% |
| State average: | 90.4% |
Place of birth for U.S.-born residents:
- This state: 241,632
- Other state: 157,728
- Northeast: 104,636
- Midwest: 11,977
- South: 31,612
- West: 9,503
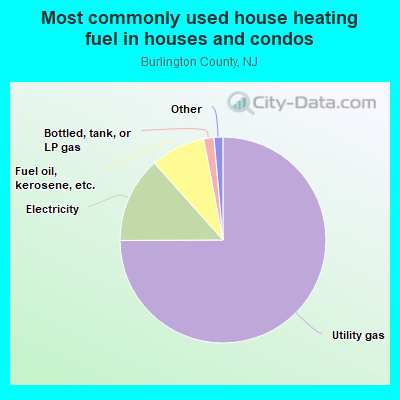
- 73.2%Utility gas
- 14.2%Electricity
- 8.6%Fuel oil, kerosene, etc.
- 1.9%Bottled, tank, or LP gas
- 0.6%Wood
- 0.6%Solar energy
- 0.5%Other fuel
- 0.4%No fuel used
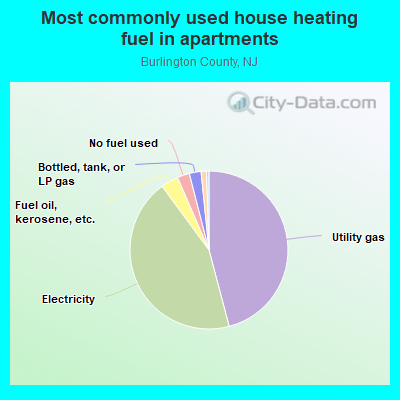
- 56.7%Utility gas
- 33.2%Electricity
- 4.0%Fuel oil, kerosene, etc.
- 3.6%Bottled, tank, or LP gas
- 1.1%No fuel used
- 1.0%Other fuel
- 0.4%Solar energy
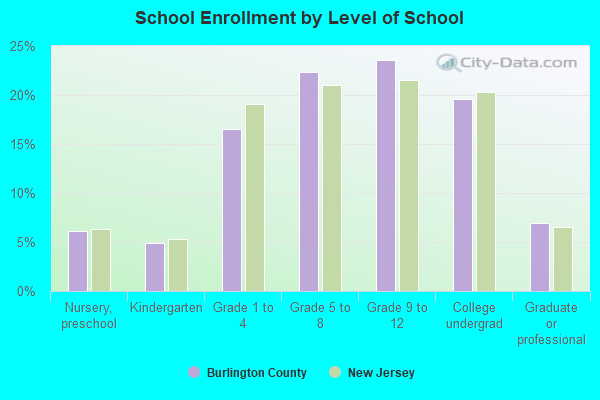
Private vs. public school enrollment:
| Here: | 7.4% |
| New Jersey: | 12.3% |
| Here: | 8.2% |
| New Jersey: | 13.1% |
| Here: | 33.3% |
| New Jersey: | 33.2% |
Burlington County government finances - Expenditure in 2020:
- Assistance and Subsidies - Public Welfare, Federal Categorical Assistance Programs: $15,138,000
Public Welfare, Federal Categorical Assistance Programs: $10,391,000
Public Welfare, Cash Assistance Programs - Other: $8,383,000
Public Welfare, Cash Assistance Programs - Other: $7,979,000
- Bond Funds - Cash and Securities: $36,765,000
- Charges - Toll Highways: $49,312,000
Toll Highways: $45,945,000
Solid Waste Management: $29,444,000
Solid Waste Management: $27,547,000
Higher Education - Other: $24,890,000
Higher Education - Other: $23,671,000
Elementary and Secondary Education - Other: $13,928,000
Elementary and Secondary Education - Other: $13,859,000
Other: $11,454,000
Other: $11,100,000
Elementary and Secondary Education School Tuition and Transportation: $10,669,000
Elementary and Secondary Education School Tuition and Transportation: $9,150,000
Higher Education Auxiliary Enterprises: $3,302,000
Higher Education Auxiliary Enterprises: $2,242,000
Elementary and Secondary Education School Lunch: $952,000
Elementary and Secondary Education School Lunch: $591,000
Regular Highways: $399,000
Regular Highways: $369,000
Natural Resources - Other: $88,000
- Construction - General - Other: $41,335,000
Other Higher Education: $17,043,000
Toll Highways: $13,200,000
Toll Highways: $11,255,000
Parks and Recreation: $5,968,000
Regular Highways: $3,210,000
Solid Waste Management: $1,395,000
Elementary and Secondary Education: $1,259,000
General Public Buildings: $291,000
Elementary and Secondary Education: $286,000
Other Higher Education: $19,000
Health - Other: $19,000
Correctional Institutions: $7,000
- Current Operations - Elementary and Secondary Education: $89,966,000
Elementary and Secondary Education: $88,491,000
Other Higher Education: $60,075,000
General - Other: $58,108,000
Other Higher Education: $45,167,000
Toll Highways: $42,980,000
Toll Highways: $41,993,000
General - Other: $29,615,000
Police Protection: $23,062,000
Solid Waste Management: $22,460,000
Correctional Institutions: $19,027,000
Correctional Institutions: $18,740,000
Parks and Recreation: $16,787,000
Solid Waste Management: $16,753,000
Police Protection: $13,220,000
Judicial and Legal Services: $11,535,000
Judicial and Legal Services: $10,088,000
General Public Buildings: $7,939,000
Public Welfare - Other: $7,498,000
Health - Other: $6,397,000
Health - Other: $6,348,000
General Public Buildings: $6,247,000
Financial Administration: $5,629,000
Financial Administration: $5,603,000
Parks and Recreation: $5,335,000
Housing and Community Development: $5,114,000
Public Welfare - Other: $4,224,000
Regular Highways: $3,843,000
Regular Highways: $3,372,000
Higher Education Auxiliary Enterprises: $3,239,000
Higher Education Auxiliary Enterprises: $3,021,000
Central Staff Services: $2,899,000
Central Staff Services: $2,784,000
Corrections - Other: $1,818,000
Protective Inspection and Regulation - Other: $266,000
Protective Inspection and Regulation - Other: $257,000
Local Fire Protection: $179,000
Local Fire Protection: $165,000
- Federal Intergovernmental - Public Welfare: $4,240,000
Education: $3,535,000
Public Welfare: $3,343,000
Other: $1,600,000
Education: $1,433,000
Other: $1,084,000
Highways: $900,000
Highways: $606,000
General Local Government Support: $377,000
General Local Government Support: $212,000
- General - Interest on Debt: $12,341,000
Interest on Debt: $11,681,000
- Intergovernmental to State - Elementary and Secondary Education: $236,000
Elementary and Secondary Education: $236,000
- Local Intergovernmental - Education: $43,311,000
Education: $38,116,000
General Local Government Support: $30,859,000
Highways: $3,610,000
Highways: $1,500,000
Public Welfare: $1,441,000
Other: $575,000
Other: $6,000
- Long Term Debt - Beginning Outstanding - Public Debt for Private Purpose: $352,289,000
Beginning Outstanding - Public Debt for Private Purpose: $343,274,000
Outstanding Nonguaranteed - Industrial Revenue: $321,517,000
Outstanding Unspecified Public Purpose: $314,739,000
Beginning Outstanding - Unspecified Public Purpose: $307,286,000
Outstanding Unspecified Public Purpose: $301,969,000
Outstanding Nonguaranteed - Industrial Revenue: $301,901,000
Beginning Outstanding - Unspecified Public Purpose: $287,176,000
Retired Nonguaranteed - Public Debt for Private Purpose: $98,991,000
Issue, Nonguaranteed - Public Debt for Private Purpose: $77,234,000
Issue, Unspecified Public Purpose: $53,869,000
Retired Nonguaranteed - Public Debt for Private Purpose: $50,388,000
Retired Unspecified Public Purpose: $39,076,000
Issue, Unspecified Public Purpose: $38,525,000
Retired Unspecified Public Purpose: $31,073,000
- Miscellaneous - General Revenue - Other: $4,474,000
General Revenue - Other: $4,337,000
Interest Earnings: $2,795,000
Donations From Private Sources: $1,482,000
Rents: $1,310,000
Rents: $1,215,000
Interest Earnings: $732,000
Fines and Forfeits: $616,000
Donations From Private Sources: $577,000
Sale of Property: $553,000
Sale of Property: $284,000
Fines and Forfeits: $122,000
- Other Capital Outlay - General Public Building: $27,293,000
Parks and Recreation: $10,114,000
Elementary and Secondary Education: $1,594,000
Elementary and Secondary Education: $1,286,000
Other Higher Education: $615,000
General - Other: $461,000
Solid Waste Management: $352,000
Other Higher Education: $326,000
Water Utilities: $42,000
- Other Funds - Cash and Securities: $175,315,000
Cash and Securities: $156,273,000
- Revenue - Electric Utilities: $490,000
- Short Term Debt Outstanding - Beginning: $93,100,000
End of Fiscal Year: $66,300,000
Beginning: $3,707,000
End of Fiscal Year: $2,951,000
- Sinking Funds - Cash and Securities: $398,069,000
Cash and Securities: $320,042,000
- State Intergovernmental - Education: $24,723,000
Education: $24,706,000
Other: $8,042,000
Housing and Community Development: $5,431,000
Highways: $4,356,000
Public Welfare: $4,106,000
Health and Hospitals: $4,034,000
Other: $2,427,000
General Local Government Support: $1,892,000
Public Welfare: $1,631,000
Health and Hospitals: $250,000
Highways: $3,000
- Tax - Property: $175,158,000
Property: $161,283,000
Other License: $399,000
- Total Salaries and Wages: $64,207,000
: $44,371,000
Burlington County government finances - Revenue in 2020:
- Assistance and Subsidies - Public Welfare, Federal Categorical Assistance Programs: $15,138,000
Public Welfare, Federal Categorical Assistance Programs: $10,391,000
Public Welfare, Cash Assistance Programs - Other: $8,383,000
Public Welfare, Cash Assistance Programs - Other: $7,979,000
- Bond Funds - Cash and Securities: $36,765,000
- Charges - Toll Highways: $49,312,000
Toll Highways: $45,945,000
Solid Waste Management: $29,444,000
Solid Waste Management: $27,547,000
Higher Education - Other: $24,890,000
Higher Education - Other: $23,671,000
Elementary and Secondary Education - Other: $13,928,000
Elementary and Secondary Education - Other: $13,859,000
Other: $11,454,000
Other: $11,100,000
Elementary and Secondary Education School Tuition and Transportation: $10,669,000
Elementary and Secondary Education School Tuition and Transportation: $9,150,000
Higher Education Auxiliary Enterprises: $3,302,000
Higher Education Auxiliary Enterprises: $2,242,000
Elementary and Secondary Education School Lunch: $952,000
Elementary and Secondary Education School Lunch: $591,000
Regular Highways: $399,000
Regular Highways: $369,000
Natural Resources - Other: $88,000
- Construction - General - Other: $41,335,000
Other Higher Education: $17,043,000
Toll Highways: $13,200,000
Toll Highways: $11,255,000
Parks and Recreation: $5,968,000
Regular Highways: $3,210,000
Solid Waste Management: $1,395,000
Elementary and Secondary Education: $1,259,000
General Public Buildings: $291,000
Elementary and Secondary Education: $286,000
Other Higher Education: $19,000
Health - Other: $19,000
Correctional Institutions: $7,000
- Current Operations - Elementary and Secondary Education: $89,966,000
Elementary and Secondary Education: $88,491,000
Other Higher Education: $60,075,000
General - Other: $58,108,000
Other Higher Education: $45,167,000
Toll Highways: $42,980,000
Toll Highways: $41,993,000
General - Other: $29,615,000
Police Protection: $23,062,000
Solid Waste Management: $22,460,000
Correctional Institutions: $19,027,000
Correctional Institutions: $18,740,000
Parks and Recreation: $16,787,000
Solid Waste Management: $16,753,000
Police Protection: $13,220,000
Judicial and Legal Services: $11,535,000
Judicial and Legal Services: $10,088,000
General Public Buildings: $7,939,000
Public Welfare - Other: $7,498,000
Health - Other: $6,397,000
Health - Other: $6,348,000
General Public Buildings: $6,247,000
Financial Administration: $5,629,000
Financial Administration: $5,603,000
Parks and Recreation: $5,335,000
Housing and Community Development: $5,114,000
Public Welfare - Other: $4,224,000
Regular Highways: $3,843,000
Regular Highways: $3,372,000
Higher Education Auxiliary Enterprises: $3,239,000
Higher Education Auxiliary Enterprises: $3,021,000
Central Staff Services: $2,899,000
Central Staff Services: $2,784,000
Corrections - Other: $1,818,000
Protective Inspection and Regulation - Other: $266,000
Protective Inspection and Regulation - Other: $257,000
Local Fire Protection: $179,000
Local Fire Protection: $165,000
- Federal Intergovernmental - Public Welfare: $4,240,000
Education: $3,535,000
Public Welfare: $3,343,000
Other: $1,600,000
Education: $1,433,000
Other: $1,084,000
Highways: $900,000
Highways: $606,000
General Local Government Support: $377,000
General Local Government Support: $212,000
- General - Interest on Debt: $12,341,000
Interest on Debt: $11,681,000
- Intergovernmental to State - Elementary and Secondary Education: $236,000
Elementary and Secondary Education: $236,000
- Local Intergovernmental - Education: $43,311,000
Education: $38,116,000
General Local Government Support: $30,859,000
Highways: $3,610,000
Highways: $1,500,000
Public Welfare: $1,441,000
Other: $575,000
Other: $6,000
- Long Term Debt - Beginning Outstanding - Public Debt for Private Purpose: $352,289,000
Beginning Outstanding - Public Debt for Private Purpose: $343,274,000
Outstanding Nonguaranteed - Industrial Revenue: $321,517,000
Outstanding Unspecified Public Purpose: $314,739,000
Beginning Outstanding - Unspecified Public Purpose: $307,286,000
Outstanding Unspecified Public Purpose: $301,969,000
Outstanding Nonguaranteed - Industrial Revenue: $301,901,000
Beginning Outstanding - Unspecified Public Purpose: $287,176,000
Retired Nonguaranteed - Public Debt for Private Purpose: $98,991,000
Issue, Nonguaranteed - Public Debt for Private Purpose: $77,234,000
Issue, Unspecified Public Purpose: $53,869,000
Retired Nonguaranteed - Public Debt for Private Purpose: $50,388,000
Retired Unspecified Public Purpose: $39,076,000
Issue, Unspecified Public Purpose: $38,525,000
Retired Unspecified Public Purpose: $31,073,000
- Miscellaneous - General Revenue - Other: $4,474,000
General Revenue - Other: $4,337,000
Interest Earnings: $2,795,000
Donations From Private Sources: $1,482,000
Rents: $1,310,000
Rents: $1,215,000
Interest Earnings: $732,000
Fines and Forfeits: $616,000
Donations From Private Sources: $577,000
Sale of Property: $553,000
Sale of Property: $284,000
Fines and Forfeits: $122,000
- Other Capital Outlay - General Public Building: $27,293,000
Parks and Recreation: $10,114,000
Elementary and Secondary Education: $1,594,000
Elementary and Secondary Education: $1,286,000
Other Higher Education: $615,000
General - Other: $461,000
Solid Waste Management: $352,000
Other Higher Education: $326,000
Water Utilities: $42,000
- Other Funds - Cash and Securities: $175,315,000
Cash and Securities: $156,273,000
- Revenue - Electric Utilities: $490,000
- Short Term Debt Outstanding - Beginning: $93,100,000
End of Fiscal Year: $66,300,000
Beginning: $3,707,000
End of Fiscal Year: $2,951,000
- Sinking Funds - Cash and Securities: $398,069,000
Cash and Securities: $320,042,000
- State Intergovernmental - Education: $24,723,000
Education: $24,706,000
Other: $8,042,000
Housing and Community Development: $5,431,000
Highways: $4,356,000
Public Welfare: $4,106,000
Health and Hospitals: $4,034,000
Other: $2,427,000
General Local Government Support: $1,892,000
Public Welfare: $1,631,000
Health and Hospitals: $250,000
Highways: $3,000
- Tax - Property: $175,158,000
Property: $161,283,000
Other License: $399,000
- Total Salaries and Wages: $64,207,000
: $44,371,000
Burlington County government finances - Debt in 2020:
- Assistance and Subsidies - Public Welfare, Federal Categorical Assistance Programs: $15,138,000
Public Welfare, Federal Categorical Assistance Programs: $10,391,000
Public Welfare, Cash Assistance Programs - Other: $8,383,000
Public Welfare, Cash Assistance Programs - Other: $7,979,000
- Bond Funds - Cash and Securities: $36,765,000
- Charges - Toll Highways: $49,312,000
Toll Highways: $45,945,000
Solid Waste Management: $29,444,000
Solid Waste Management: $27,547,000
Higher Education - Other: $24,890,000
Higher Education - Other: $23,671,000
Elementary and Secondary Education - Other: $13,928,000
Elementary and Secondary Education - Other: $13,859,000
Other: $11,454,000
Other: $11,100,000
Elementary and Secondary Education School Tuition and Transportation: $10,669,000
Elementary and Secondary Education School Tuition and Transportation: $9,150,000
Higher Education Auxiliary Enterprises: $3,302,000
Higher Education Auxiliary Enterprises: $2,242,000
Elementary and Secondary Education School Lunch: $952,000
Elementary and Secondary Education School Lunch: $591,000
Regular Highways: $399,000
Regular Highways: $369,000
Natural Resources - Other: $88,000
- Construction - General - Other: $41,335,000
Other Higher Education: $17,043,000
Toll Highways: $13,200,000
Toll Highways: $11,255,000
Parks and Recreation: $5,968,000
Regular Highways: $3,210,000
Solid Waste Management: $1,395,000
Elementary and Secondary Education: $1,259,000
General Public Buildings: $291,000
Elementary and Secondary Education: $286,000
Other Higher Education: $19,000
Health - Other: $19,000
Correctional Institutions: $7,000
- Current Operations - Elementary and Secondary Education: $89,966,000
Elementary and Secondary Education: $88,491,000
Other Higher Education: $60,075,000
General - Other: $58,108,000
Other Higher Education: $45,167,000
Toll Highways: $42,980,000
Toll Highways: $41,993,000
General - Other: $29,615,000
Police Protection: $23,062,000
Solid Waste Management: $22,460,000
Correctional Institutions: $19,027,000
Correctional Institutions: $18,740,000
Parks and Recreation: $16,787,000
Solid Waste Management: $16,753,000
Police Protection: $13,220,000
Judicial and Legal Services: $11,535,000
Judicial and Legal Services: $10,088,000
General Public Buildings: $7,939,000
Public Welfare - Other: $7,498,000
Health - Other: $6,397,000
Health - Other: $6,348,000
General Public Buildings: $6,247,000
Financial Administration: $5,629,000
Financial Administration: $5,603,000
Parks and Recreation: $5,335,000
Housing and Community Development: $5,114,000
Public Welfare - Other: $4,224,000
Regular Highways: $3,843,000
Regular Highways: $3,372,000
Higher Education Auxiliary Enterprises: $3,239,000
Higher Education Auxiliary Enterprises: $3,021,000
Central Staff Services: $2,899,000
Central Staff Services: $2,784,000
Corrections - Other: $1,818,000
Protective Inspection and Regulation - Other: $266,000
Protective Inspection and Regulation - Other: $257,000
Local Fire Protection: $179,000
Local Fire Protection: $165,000
- Federal Intergovernmental - Public Welfare: $4,240,000
Education: $3,535,000
Public Welfare: $3,343,000
Other: $1,600,000
Education: $1,433,000
Other: $1,084,000
Highways: $900,000
Highways: $606,000
General Local Government Support: $377,000
General Local Government Support: $212,000
- General - Interest on Debt: $12,341,000
Interest on Debt: $11,681,000
- Intergovernmental to State - Elementary and Secondary Education: $236,000
Elementary and Secondary Education: $236,000
- Local Intergovernmental - Education: $43,311,000
Education: $38,116,000
General Local Government Support: $30,859,000
Highways: $3,610,000
Highways: $1,500,000
Public Welfare: $1,441,000
Other: $575,000
Other: $6,000
- Long Term Debt - Beginning Outstanding - Public Debt for Private Purpose: $352,289,000
Beginning Outstanding - Public Debt for Private Purpose: $343,274,000
Outstanding Nonguaranteed - Industrial Revenue: $321,517,000
Outstanding Unspecified Public Purpose: $314,739,000
Beginning Outstanding - Unspecified Public Purpose: $307,286,000
Outstanding Unspecified Public Purpose: $301,969,000
Outstanding Nonguaranteed - Industrial Revenue: $301,901,000
Beginning Outstanding - Unspecified Public Purpose: $287,176,000
Retired Nonguaranteed - Public Debt for Private Purpose: $98,991,000
Issue, Nonguaranteed - Public Debt for Private Purpose: $77,234,000
Issue, Unspecified Public Purpose: $53,869,000
Retired Nonguaranteed - Public Debt for Private Purpose: $50,388,000
Retired Unspecified Public Purpose: $39,076,000
Issue, Unspecified Public Purpose: $38,525,000
Retired Unspecified Public Purpose: $31,073,000
- Miscellaneous - General Revenue - Other: $4,474,000
General Revenue - Other: $4,337,000
Interest Earnings: $2,795,000
Donations From Private Sources: $1,482,000
Rents: $1,310,000
Rents: $1,215,000
Interest Earnings: $732,000
Fines and Forfeits: $616,000
Donations From Private Sources: $577,000
Sale of Property: $553,000
Sale of Property: $284,000
Fines and Forfeits: $122,000
- Other Capital Outlay - General Public Building: $27,293,000
Parks and Recreation: $10,114,000
Elementary and Secondary Education: $1,594,000
Elementary and Secondary Education: $1,286,000
Other Higher Education: $615,000
General - Other: $461,000
Solid Waste Management: $352,000
Other Higher Education: $326,000
Water Utilities: $42,000
- Other Funds - Cash and Securities: $175,315,000
Cash and Securities: $156,273,000
- Revenue - Electric Utilities: $490,000
- Short Term Debt Outstanding - Beginning: $93,100,000
End of Fiscal Year: $66,300,000
Beginning: $3,707,000
End of Fiscal Year: $2,951,000
- Sinking Funds - Cash and Securities: $398,069,000
Cash and Securities: $320,042,000
- State Intergovernmental - Education: $24,723,000
Education: $24,706,000
Other: $8,042,000
Housing and Community Development: $5,431,000
Highways: $4,356,000
Public Welfare: $4,106,000
Health and Hospitals: $4,034,000
Other: $2,427,000
General Local Government Support: $1,892,000
Public Welfare: $1,631,000
Health and Hospitals: $250,000
Highways: $3,000
- Tax - Property: $175,158,000
Property: $161,283,000
Other License: $399,000
- Total Salaries and Wages: $64,207,000
: $44,371,000
Burlington County government finances - Cash and Securities in 2020:
- Assistance and Subsidies - Public Welfare, Federal Categorical Assistance Programs: $15,138,000
Public Welfare, Federal Categorical Assistance Programs: $10,391,000
Public Welfare, Cash Assistance Programs - Other: $8,383,000
Public Welfare, Cash Assistance Programs - Other: $7,979,000
- Bond Funds - Cash and Securities: $36,765,000
- Charges - Toll Highways: $49,312,000
Toll Highways: $45,945,000
Solid Waste Management: $29,444,000
Solid Waste Management: $27,547,000
Higher Education - Other: $24,890,000
Higher Education - Other: $23,671,000
Elementary and Secondary Education - Other: $13,928,000
Elementary and Secondary Education - Other: $13,859,000
Other: $11,454,000
Other: $11,100,000
Elementary and Secondary Education School Tuition and Transportation: $10,669,000
Elementary and Secondary Education School Tuition and Transportation: $9,150,000
Higher Education Auxiliary Enterprises: $3,302,000
Higher Education Auxiliary Enterprises: $2,242,000
Elementary and Secondary Education School Lunch: $952,000
Elementary and Secondary Education School Lunch: $591,000
Regular Highways: $399,000
Regular Highways: $369,000
Natural Resources - Other: $88,000
- Construction - General - Other: $41,335,000
Other Higher Education: $17,043,000
Toll Highways: $13,200,000
Toll Highways: $11,255,000
Parks and Recreation: $5,968,000
Regular Highways: $3,210,000
Solid Waste Management: $1,395,000
Elementary and Secondary Education: $1,259,000
General Public Buildings: $291,000
Elementary and Secondary Education: $286,000
Other Higher Education: $19,000
Health - Other: $19,000
Correctional Institutions: $7,000
- Current Operations - Elementary and Secondary Education: $89,966,000
Elementary and Secondary Education: $88,491,000
Other Higher Education: $60,075,000
General - Other: $58,108,000
Other Higher Education: $45,167,000
Toll Highways: $42,980,000
Toll Highways: $41,993,000
General - Other: $29,615,000
Police Protection: $23,062,000
Solid Waste Management: $22,460,000
Correctional Institutions: $19,027,000
Correctional Institutions: $18,740,000
Parks and Recreation: $16,787,000
Solid Waste Management: $16,753,000
Police Protection: $13,220,000
Judicial and Legal Services: $11,535,000
Judicial and Legal Services: $10,088,000
General Public Buildings: $7,939,000
Public Welfare - Other: $7,498,000
Health - Other: $6,397,000
Health - Other: $6,348,000
General Public Buildings: $6,247,000
Financial Administration: $5,629,000
Financial Administration: $5,603,000
Parks and Recreation: $5,335,000
Housing and Community Development: $5,114,000
Public Welfare - Other: $4,224,000
Regular Highways: $3,843,000
Regular Highways: $3,372,000
Higher Education Auxiliary Enterprises: $3,239,000
Higher Education Auxiliary Enterprises: $3,021,000
Central Staff Services: $2,899,000
Central Staff Services: $2,784,000
Corrections - Other: $1,818,000
Protective Inspection and Regulation - Other: $266,000
Protective Inspection and Regulation - Other: $257,000
Local Fire Protection: $179,000
Local Fire Protection: $165,000
- Federal Intergovernmental - Public Welfare: $4,240,000
Education: $3,535,000
Public Welfare: $3,343,000
Other: $1,600,000
Education: $1,433,000
Other: $1,084,000
Highways: $900,000
Highways: $606,000
General Local Government Support: $377,000
General Local Government Support: $212,000
- General - Interest on Debt: $12,341,000
Interest on Debt: $11,681,000
- Intergovernmental to State - Elementary and Secondary Education: $236,000
Elementary and Secondary Education: $236,000
- Local Intergovernmental - Education: $43,311,000
Education: $38,116,000
General Local Government Support: $30,859,000
Highways: $3,610,000
Highways: $1,500,000
Public Welfare: $1,441,000
Other: $575,000
Other: $6,000
- Long Term Debt - Beginning Outstanding - Public Debt for Private Purpose: $352,289,000
Beginning Outstanding - Public Debt for Private Purpose: $343,274,000
Outstanding Nonguaranteed - Industrial Revenue: $321,517,000
Outstanding Unspecified Public Purpose: $314,739,000
Beginning Outstanding - Unspecified Public Purpose: $307,286,000
Outstanding Unspecified Public Purpose: $301,969,000
Outstanding Nonguaranteed - Industrial Revenue: $301,901,000
Beginning Outstanding - Unspecified Public Purpose: $287,176,000
Retired Nonguaranteed - Public Debt for Private Purpose: $98,991,000
Issue, Nonguaranteed - Public Debt for Private Purpose: $77,234,000
Issue, Unspecified Public Purpose: $53,869,000
Retired Nonguaranteed - Public Debt for Private Purpose: $50,388,000
Retired Unspecified Public Purpose: $39,076,000
Issue, Unspecified Public Purpose: $38,525,000
Retired Unspecified Public Purpose: $31,073,000
- Miscellaneous - General Revenue - Other: $4,474,000
General Revenue - Other: $4,337,000
Interest Earnings: $2,795,000
Donations From Private Sources: $1,482,000
Rents: $1,310,000
Rents: $1,215,000
Interest Earnings: $732,000
Fines and Forfeits: $616,000
Donations From Private Sources: $577,000
Sale of Property: $553,000
Sale of Property: $284,000
Fines and Forfeits: $122,000
- Other Capital Outlay - General Public Building: $27,293,000
Parks and Recreation: $10,114,000
Elementary and Secondary Education: $1,594,000
Elementary and Secondary Education: $1,286,000
Other Higher Education: $615,000
General - Other: $461,000
Solid Waste Management: $352,000
Other Higher Education: $326,000
Water Utilities: $42,000
- Other Funds - Cash and Securities: $175,315,000
Cash and Securities: $156,273,000
- Revenue - Electric Utilities: $490,000
- Short Term Debt Outstanding - Beginning: $93,100,000
End of Fiscal Year: $66,300,000
Beginning: $3,707,000
End of Fiscal Year: $2,951,000
- Sinking Funds - Cash and Securities: $398,069,000
Cash and Securities: $320,042,000
- State Intergovernmental - Education: $24,723,000
Education: $24,706,000
Other: $8,042,000
Housing and Community Development: $5,431,000
Highways: $4,356,000
Public Welfare: $4,106,000
Health and Hospitals: $4,034,000
Other: $2,427,000
General Local Government Support: $1,892,000
Public Welfare: $1,631,000
Health and Hospitals: $250,000
Highways: $3,000
- Tax - Property: $175,158,000
Property: $161,283,000
Other License: $399,000
- Total Salaries and Wages: $64,207,000
: $44,371,000
Supplemental Security Income (SSI) in 2006:
- Total number of recipients: 4,750
- Number of aged recipients: 592
- Number of blind and disabled recipients: 4,158
- Number of recipients under 18: 758
- Number of recipients between 18 and 64: 3,036
- Number of recipients older than 64: 956
- Number of recipients also receiving OASDI: 1,521
- Amount of payments (thousands of dollars): 2,190
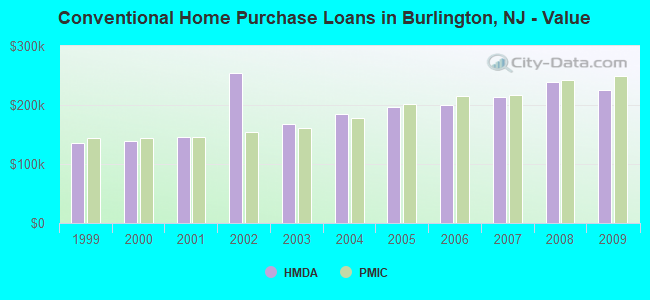
| Home Mortgage Disclosure Act Aggregated Statistics For Year 2009 (Based on 114 full tracts) | ||||||||||||||
| A) FHA, FSA/RHS & VA Home Purchase Loans | B) Conventional Home Purchase Loans | C) Refinancings | D) Home Improvement Loans | E) Loans on Dwellings For 5+ Families | F) Non-occupant Loans on < 5 Family Dwellings (A B C & D) | G) Loans On Manufactured Home Dwelling (A B C & D) | ||||||||
|---|---|---|---|---|---|---|---|---|---|---|---|---|---|---|
| Number | Average Value | Number | Average Value | Number | Average Value | Number | Average Value | Number | Average Value | Number | Average Value | Number | Average Value | |
| LOANS ORIGINATED | 2,004 | $208,999 | 2,024 | $226,215 | 11,716 | $216,748 | 796 | $77,872 | 10 | $6,409,700 | 352 | $159,716 | 35 | $169,057 |
| APPLICATIONS APPROVED, NOT ACCEPTED | 127 | $206,457 | 164 | $231,256 | 1,028 | $213,588 | 121 | $49,446 | 3 | $464,000 | 39 | $134,000 | 11 | $57,636 |
| APPLICATIONS DENIED | 319 | $198,298 | 320 | $224,206 | 4,349 | $225,231 | 677 | $55,165 | 3 | $10,005,333 | 215 | $123,321 | 55 | $53,800 |
| APPLICATIONS WITHDRAWN | 227 | $201,586 | 264 | $238,352 | 2,902 | $221,113 | 177 | $93,542 | 1 | $400,000 | 87 | $157,724 | 7 | $86,571 |
| FILES CLOSED FOR INCOMPLETENESS | 90 | $201,178 | 71 | $242,014 | 714 | $229,762 | 38 | $93,079 | 0 | $0 | 20 | $130,850 | 1 | $230,000 |
| Private Mortgage Insurance Companies Aggregated Statistics For Year 2009 (Based on 103 full tracts) | ||||||
| A) Conventional Home Purchase Loans | B) Refinancings | C) Non-occupant Loans on < 5 Family Dwellings (A & B) | ||||
|---|---|---|---|---|---|---|
| Number | Average Value | Number | Average Value | Number | Average Value | |
| LOANS ORIGINATED | 331 | $248,598 | 213 | $269,836 | 1 | $122,000 |
| APPLICATIONS APPROVED, NOT ACCEPTED | 141 | $263,773 | 116 | $268,026 | 4 | $215,250 |
| APPLICATIONS DENIED | 59 | $242,492 | 81 | $267,630 | 0 | $0 |
| APPLICATIONS WITHDRAWN | 32 | $273,031 | 27 | $240,444 | 0 | $0 |
| FILES CLOSED FOR INCOMPLETENESS | 22 | $300,045 | 6 | $250,667 | 1 | $121,000 |
| Most common first names in Burlington County, NJ among deceased individuals | ||
| Name | Count | Lived (average) |
|---|---|---|
| John | 1,505 | 73.8 years |
| William | 1,260 | 74.2 years |
| Mary | 1,248 | 80.8 years |
| Joseph | 912 | 74.3 years |
| James | 737 | 71.9 years |
| Helen | 730 | 80.6 years |
| Charles | 717 | 75.0 years |
| Robert | 716 | 70.4 years |
| George | 676 | 75.5 years |
| Anna | 660 | 82.4 years |
| Most common last names in Burlington County, NJ among deceased individuals | ||
| Last name | Count | Lived (average) |
|---|---|---|
| Smith | 366 | 75.9 years |
| Johnson | 250 | 74.9 years |
| Brown | 205 | 74.6 years |
| Jones | 195 | 76.5 years |
| Williams | 190 | 74.1 years |
| Miller | 175 | 77.5 years |
| Taylor | 158 | 75.3 years |
| Anderson | 151 | 75.5 years |
| Davis | 118 | 74.9 years |
| Wilson | 116 | 78.5 years |
| Businesses in Burlington County, NJ | ||||
| Name | Count | Name | Count | |
|---|---|---|---|---|
| 7-Eleven | 17 | Justice | 3 | |
| ALDI | 1 | KFC | 3 | |
| AT&T | 6 | Kmart | 1 | |
| Ace Hardware | 2 | Kohl's | 1 | |
| Advance Auto Parts | 2 | Kroger | 2 | |
| Aeropostale | 2 | LA Fitness | 1 | |
| Aerosoles | 1 | La-Z-Boy | 3 | |
| American Eagle Outfitters | 2 | Lane Bryant | 1 | |
| Ann Taylor | 3 | Lane Furniture | 2 | |
| Apple Store | 1 | LensCrafters | 2 | |
| Arby's | 2 | Macy's | 1 | |
| AutoZone | 3 | Marriott | 5 | |
| Avenue | 1 | Marshalls | 2 | |
| BMW | 1 | MasterBrand Cabinets | 10 | |
| Baja Fresh Mexican Grill | 1 | McDonald's | 12 | |
| Banana Republic | 1 | Men's Wearhouse | 1 | |
| Barnes & Noble | 2 | Motherhood Maternity | 2 | |
| Baskin-Robbins | 1 | New Balance | 7 | |
| Bath & Body Works | 3 | New York & Co | 1 | |
| Bed Bath & Beyond | 2 | Nike | 6 | |
| Bentleymotors.Com | 1 | OfficeMax | 1 | |
| Best Western | 1 | Old Navy | 2 | |
| Blockbuster | 2 | On The Border | 1 | |
| Brooks Brothers | 1 | Outback | 1 | |
| Budget Car Rental | 1 | Outback Steakhouse | 1 | |
| Burger King | 11 | Pac Sun | 1 | |
| CVS | 13 | Panera Bread | 3 | |
| Catherines | 1 | Papa John's Pizza | 4 | |
| Chevrolet | 1 | Payless | 4 | |
| Chick-Fil-A | 3 | Penske | 1 | |
| Chico's | 2 | PetSmart | 3 | |
| Chipotle | 2 | Pier 1 Imports | 1 | |
| Cinnabon | 2 | Pizza Hut | 2 | |
| Circle K | 1 | Popeyes | 1 | |
| Clarks | 1 | Pottery Barn | 1 | |
| Cold Stone Creamery | 3 | Pottery Barn Kids | 1 | |
| Coldwater Creek | 1 | Quiznos | 1 | |
| Comfort Inn | 2 | RadioShack | 6 | |
| Costco | 1 | Ramada | 1 | |
| Cracker Barrel | 1 | Red Roof Inn | 1 | |
| Cricket Wireless | 3 | Rite Aid | 13 | |
| Curves | 5 | Rodeway Inn | 1 | |
| DHL | 5 | Ruby Tuesday | 1 | |
| Dairy Queen | 1 | Rue21 | 1 | |
| Days Inn | 2 | SONIC Drive-In | 1 | |
| Decora Cabinetry | 2 | Safeway | 1 | |
| Dennys | 1 | Sam's Club | 1 | |
| Domino's Pizza | 5 | Sears | 4 | |
| DressBarn | 1 | Sleep Inn | 1 | |
| Dressbarn | 1 | Spencer Gifts | 1 | |
| Dunkin Donuts | 25 | Sprint Nextel | 4 | |
| Econo Lodge | 2 | Staples | 2 | |
| Express | 1 | Starbucks | 8 | |
| Extended Stay America | 1 | Stop & Shop | 1 | |
| Extended Stay Deluxe | 1 | Subway | 17 | |
| Famous Footwear | 2 | Super 8 | 1 | |
| Fashion Bug | 3 | T-Mobile | 9 | |
| FedEx | 39 | T.G.I. Driday's | 3 | |
| Firestone Complete Auto Care | 3 | T.J.Maxx | 2 | |
| Foot Locker | 2 | Taco Bell | 3 | |
| Ford | 2 | Talbots | 2 | |
| GNC | 14 | Target | 3 | |
| GameStop | 7 | The Room Place | 1 | |
| Gap | 2 | Toyota | 2 | |
| Gymboree | 1 | Toys"R"Us | 5 | |
| H&R Block | 10 | Trader Joe's | 1 | |
| Hilton | 3 | True Value | 3 | |
| Holiday Inn | 3 | U-Haul | 14 | |
| Hollister Co. | 1 | UPS | 66 | |
| Home Depot | 1 | Value City Furniture | 1 | |
| Honda | 2 | Verizon Wireless | 3 | |
| Hot Topic | 1 | Victoria's Secret | 3 | |
| Hyatt | 2 | Volkswagen | 1 | |
| Hyundai | 2 | Walgreens | 4 | |
| IHOP | 2 | Walmart | 3 | |
| J. Jill | 1 | Wendy's | 6 | |
| J.Crew | 1 | Westin | 1 | |
| JCPenney | 1 | Whole Foods Market | 1 | |
| JoS. A. Bank | 3 | Wingate | 2 | |
| Jones New York | 4 | YMCA | 3 | |
| Journeys | 1 | |||
Burlington County on our top lists:
- #43 on the list of "Top 101 counties with the highest average weight of females"
- #46 on the list of "Top 101 counties with the lowest percentage of residents that keep firearms around their homes"
- #50 on the list of "Top 101 counties with the highest percentage of residents that visited a dentist within the past year"
- #68 on the list of "Top 101 counties with the lowest number of infant deaths per 1000 residents 2007-2013 (pop. 50,000+)"
- #77 on the list of "Top 101 counties with the highest ground withdrawal of fresh water for public supply (pop. 50,000+)"
- #78 on the list of "Top 101 counties with the highest ground withdrawal of fresh water for public supply"
- #82 on the list of "Top 101 counties with the lowest percentage of residents that drank alcohol in the past 30 days"
- #85 on the list of "Top 101 counties with the most Mainline Protestant congregations (pop. 50,000+)"
- #86 on the list of "Top 101 counties with the best general health status score of residents (1-5), 3 years of data"
- #86 on the list of "Top 101 counties with the most Mainline Protestant congregations"
- #96 on the list of "Top 101 counties with the lowest number of births per 1000 residents 2007-2013"
- #96 on the list of "Top 101 counties with the lowest number of births per 1000 residents 2007-2013 (pop 50,000+)"
- #96 on the list of "Top 101 counties with the largest decrease in the number of births per 1000 residents 2000-2006 to 2007-2013 (pop 50,000+)"