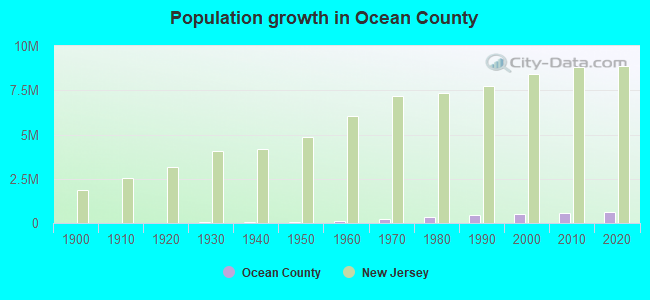
Ocean County, New Jersey (NJ)
County owner-occupied free and clear houses and condos in 2010: 63,127
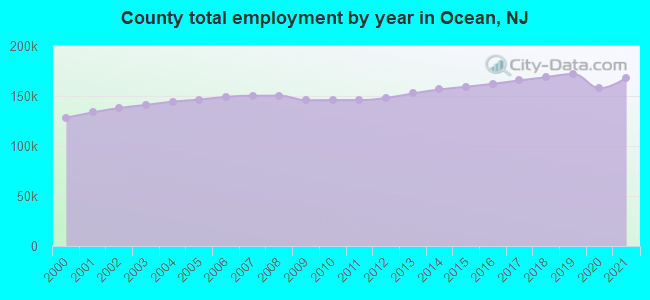
County owner-occupied houses and condos in 2000: 166,779
Renter-occupied apartments: 41,725 (it was 33,623 in 2000)
| % of renters here: | 17% |
| State: | 35% |
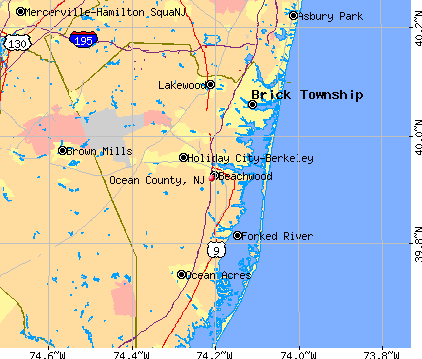
Land area: 636 sq. mi.
Water area: 279.6 sq. mi.
Population density: 1031 people per square mile (very high).
Industries providing employment: Educational, health and social services (27.9%), Professional, scientific, management, administrative, and waste management services (12.3%), Retail trade (12.3%).
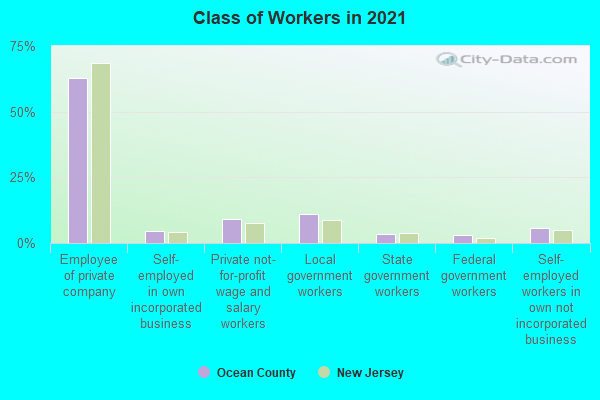
Type of workers:
- Private wage or salary: 78%
- Government: 17%
- Self-employed, not incorporated: 5%
- Unpaid family work: 0%
- OSM Map
- General Map
- Google Map
- MSN Map

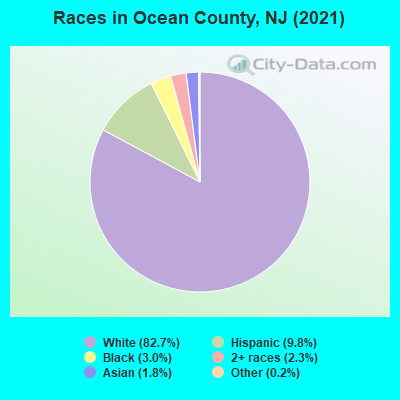
- 533,13881.3%White Non-Hispanic Alone
- 66,60210.2%Hispanic or Latino
- 19,6563.0%Two or more races
- 19,4033.0%Black Non-Hispanic Alone
- 10,1641.6%Asian alone
- 6,5741.0%Some other race alone
- 1170.02%Native Hawaiian and Other
Pacific Islander alone - 810.01%American Indian and Alaska Native alone
| Median resident age: | 41.4 years |
| New Jersey median age: | 40.4 years |
| Males: 319,610 | |
| Females: 336,125 |

 | Pavers and Property Tax in 55+ Ocean County, NJ (5 replies) |
| Town recommendations in Ocean County (18 replies) |
| Ocean County growth (8 replies) |
| NJ Real Estate Market. (125 replies) |
| Need opinions from Ocean County pet owners (4 replies) |
| Monmouth/Ocean County Schools vs. Bergen? (1 reply) |
| Ocean County: | 2.0 people |
| New Jersey: | 3 people |
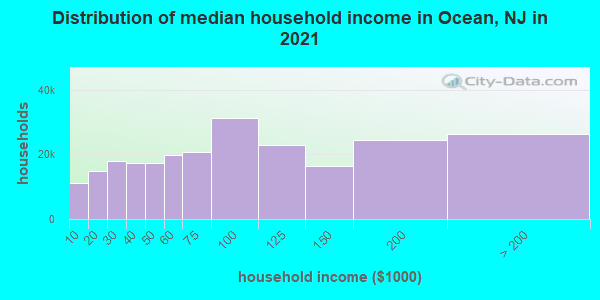
Estimated median household income in 2022: $81,101 ($46,443 in 1999)
| This county: | $81,101 |
| New Jersey: | $96,346 |
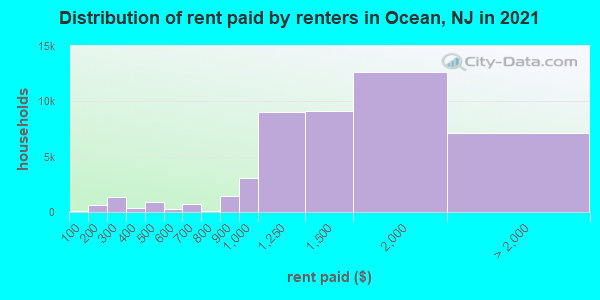
Median contract rent in 2022 for apartments: $1,418 (lower quartile is $1,113, upper quartile is $1,788)
| This county: | $1418 |
| State: | $1399 |
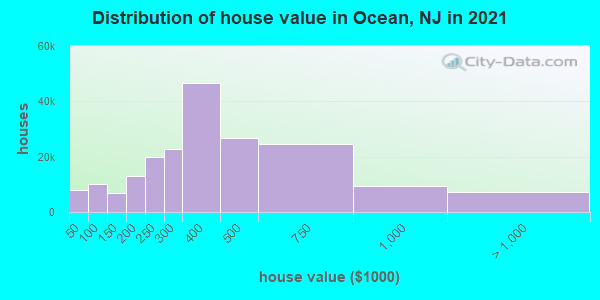
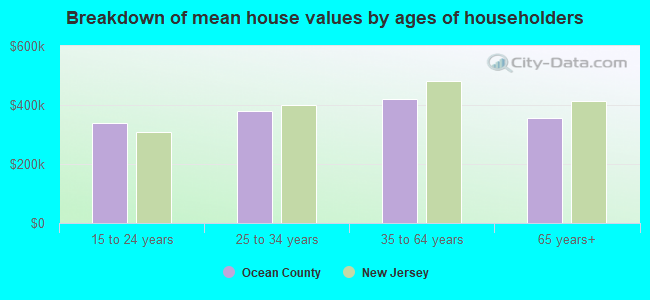
Estimated median house or condo value in 2022: $379,400 (it was $128,000 in 2000)
| Ocean: | $379,400 |
| New Jersey: | $428,900 |
Mean price in 2022:
Median monthly housing costs for homes and condos with a mortgage: $2,077Detached houses: $483,861
Here: $483,861 State: $537,591 Townhouses or other attached units: $271,082
Here: $271,082 State: $381,113 In 2-unit structures: $436,064
Here: $436,064 State: $444,476 In 3-to-4-unit structures: $245,533
Here: $245,533 State: $457,463 In 5-or-more-unit structures: $323,292
Here: $323,292 State: $368,745 Mobile homes: $98,712
Here: $98,712 State: $119,788
Median monthly housing costs for units without a mortgage: $833
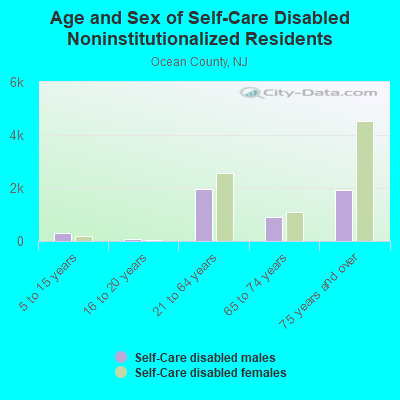
Institutionalized population: 4,956
Crime in 2020 (reported by the sheriff's office or county police, not the county total):
- Murders: 0
- Rapes: 0
- Robberies: 0
- Assaults: 2
- Burglaries: 1
- Thefts: 1
- Auto thefts: 0
Crime in 2019 (reported by the sheriff's office or county police, not the county total):
- Murders: 0
- Rapes: 0
- Robberies: 0
- Assaults: 0
- Burglaries: 0
- Thefts: 8
- Auto thefts: 0
Health of residents in Ocean County based on CDC Behavioral Risk Factor Surveillance System Survey Questionnaires from 2003 to 2012:
General health status score of residents in this county from 1 (poor) to 5 (excellent) is 3.5. This is about average.69.7% of residents exercised in the past month. This is less than average.
54.6% of residents smoked 100+ cigarettes in their lives. This is more than average.
74.3% of adult residents drank alcohol in the past 30 days. This is about average.
74.0% of residents visited a dentist within the past year. This is about average.
Average weight of males is 198 pounds. This is about average.
Average weight of females is 164 pounds. This is about average.
11.1% of residents keep firearms around their homes. This is less than average.
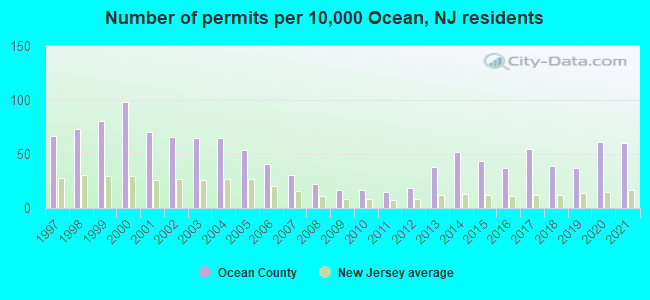
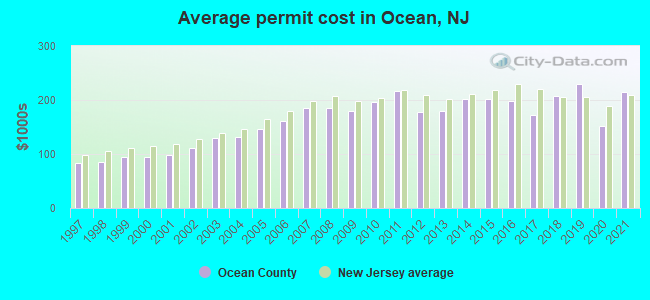
Single-family new house construction building permits:
- 2022: 2988 buildings, average cost: $199,800
- 2021: 3075 buildings, average cost: $214,100
- 2020: 3108 buildings, average cost: $151,300
- 2019: 1901 buildings, average cost: $230,300
- 2018: 2003 buildings, average cost: $207,400
- 2017: 2791 buildings, average cost: $172,500
- 2016: 1913 buildings, average cost: $197,500
- 2015: 2237 buildings, average cost: $202,300
- 2014: 2660 buildings, average cost: $202,300
- 2013: 1959 buildings, average cost: $179,900
- 2012: 937 buildings, average cost: $177,200
- 2011: 759 buildings, average cost: $215,600
- 2010: 861 buildings, average cost: $197,400
- 2009: 874 buildings, average cost: $180,400
- 2008: 1115 buildings, average cost: $186,400
- 2007: 1544 buildings, average cost: $184,600
- 2006: 2079 buildings, average cost: $162,200
- 2005: 2743 buildings, average cost: $145,500
- 2004: 3300 buildings, average cost: $132,300
- 2003: 3305 buildings, average cost: $129,400
- 2002: 3376 buildings, average cost: $110,800
- 2001: 3578 buildings, average cost: $98,300
- 2000: 5032 buildings, average cost: $95,100
- 1999: 4107 buildings, average cost: $95,200
- 1998: 3756 buildings, average cost: $85,600
- 1997: 3391 buildings, average cost: $83,800
Median real estate property taxes paid for housing units with mortgages in 2022: $6,294 (1.6%)
Median real estate property taxes paid for housing units with no mortgage in 2022: $5,660 (1.6%)
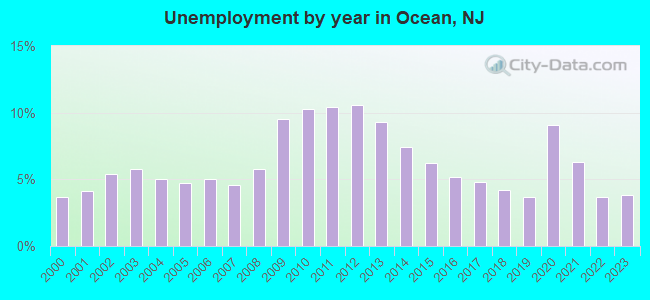
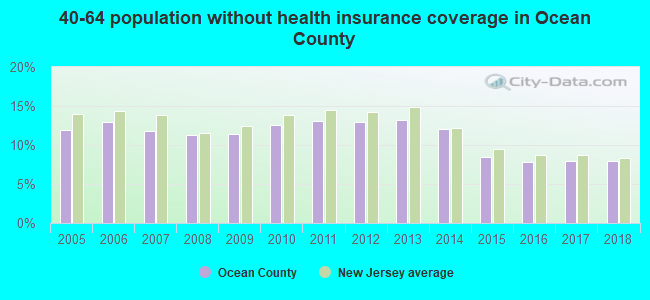
| Ocean County: | 11.7% |
| New Jersey: | 9.7% |
Median age of residents in 2022: 41.4 years old
(Males: 38.9 years old, Females: 43.8 years old)
(Median age for: White residents: 44.1 years old, Black residents: 34.9 years old, American Indian residents: 43.1 years old, Asian residents: 48.3 years old, Hispanic or Latino residents: 29.9 years old, Other race residents: 27.1 years old)
Area name: New York-Monmouth-Ocean, NY-NJ HUD Metro FMR Area
Fair market rent in 2006 for a 1-bedroom apartment in Ocean County is $1003 a month.
Fair market rent for a 2-bedroom apartment is $1133 a month.
Fair market rent for a 3-bedroom apartment is $1406 a month.
Cities in this county include: Toms River, Lakewood, Point Pleasant, Holiday City-Berkeley, Ocean Acres, Leisure Village West-Pine Lake Park, Beachwood, Pine Lake Park, Mystic Island, Crestwood Village.
2023 air pollution in Ocean County:
Ozone (1-hour): 0.038 ppm (standard limit: 0.12 ppm). Near U.S. average.
Particulate Matter (PM2.5) Annual: 9.0 µg/m3(standard limit: 15.0 µg/m3). Near U.S. average.
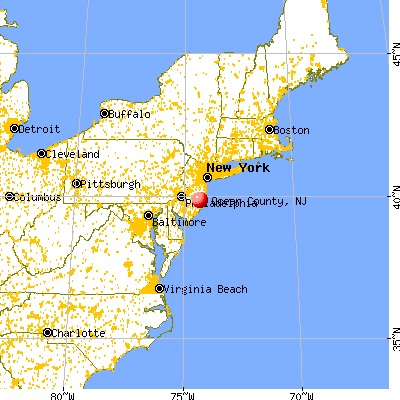
Neighboring counties: Monmouth County  , Gilpin County, Colorado
  , Sierra County, California , Rio Blanco County, Colorado , Piatt County, Illinois , Shelby County, Missouri .
| Here: | 4.3% |
| New Jersey: | 4.5% |

Current college students: 20,490
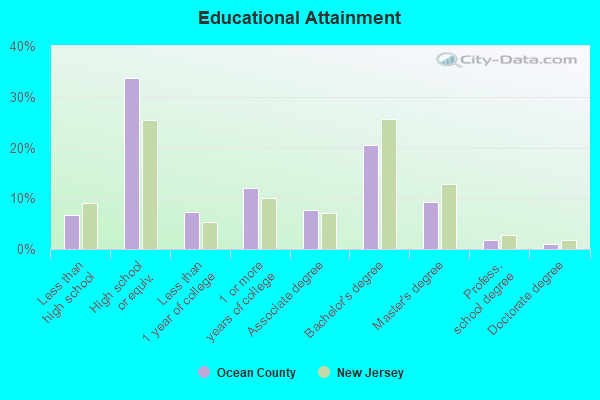
People 25 years of age or older with a high school degree or higher: 94.4%
People 25 years of age or older with a bachelor's degree or higher: 34.3%
Number of foreign born residents: 50,223 (61.2% naturalized citizens)
| Ocean County: | 7.7% |
| Whole state: | 23.5% |
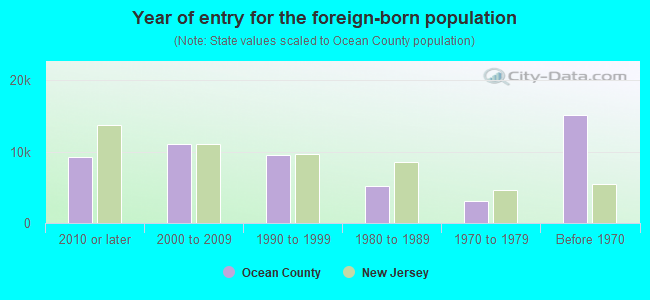
- Year of entry for the foreign-born population
- 12,0752010 or later
- 12,7862000 to 2009
- 7,4081990 to 1999
- 5,2051980 to 1989
- 3,1201970 to 1979
- 15,115Before 1970
Mean travel time to work (commute): minutes
Percentage of county residents living and working in this county: 95.8%
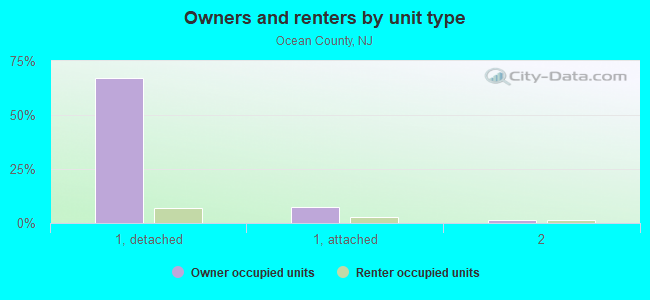
Housing units in structures:
- One, detached: 219,619
- One, attached: 32,679
- Two: 7,179
- 3 or 4: 7,778
- 5 to 9: 5,524
- 10 to 19: 4,048
- 20 to 49: 5,061
- 50 or more: 7,445
- Mobile homes: 6,265
- Boats, RVs, vans, etc.: 50
Housing units in Ocean County with a mortgage: 112,410 (10,205 second mortgage, 64 home equity loan, 8,750 both second mortgage and home equity loan)
Houses without a mortgage: 6,509
| Here: | 94.9% with mortgage |
| State: | 95.9% with mortgage |
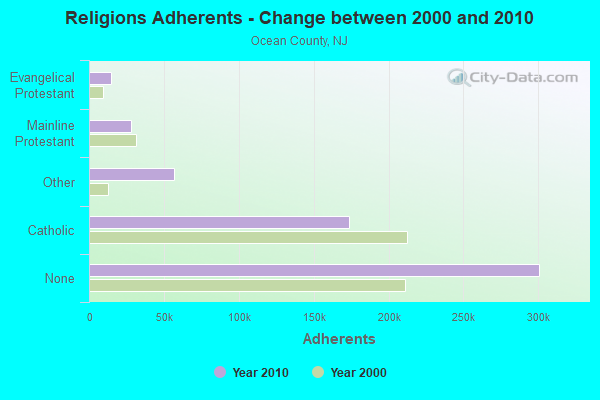
Religion statistics for Ocean County
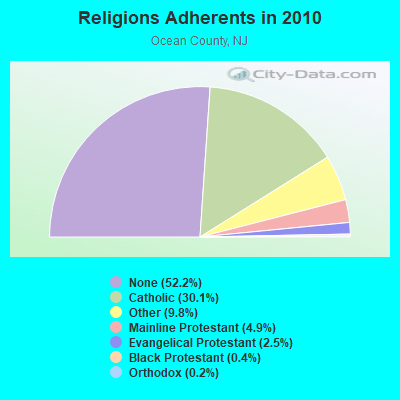
| Religion | Adherents | Congregations |
|---|---|---|
| Catholic | 173,318 | 26 |
| Other | 56,416 | 108 |
| Mainline Protestant | 28,029 | 74 |
| Evangelical Protestant | 14,510 | 79 |
| Black Protestant | 2,303 | 11 |
| Orthodox | 1,280 | 4 |
| None | 300,711 | - |
Source: Clifford Grammich, Kirk Hadaway, Richard Houseal, Dale E.Jones, Alexei Krindatch, Richie Stanley and Richard H.Taylor. 2012. 2010 U.S.Religion Census: Religious Congregations & Membership Study. Association of Statisticians of American Religious Bodies. Jones, Dale E., et al. 2002. Congregations and Membership in the United States 2000. Nashville, TN: Glenmary Research Center.
Food Environment Statistics:
| Ocean County: | 1.59 / 10,000 pop. |
| State: | 2.90 / 10,000 pop. |
| Here: | 0.04 / 10,000 pop. |
| New Jersey: | 0.06 / 10,000 pop. |
| This county: | 1.95 / 10,000 pop. |
| New Jersey: | 1.76 / 10,000 pop. |
| Ocean County: | 0.87 / 10,000 pop. |
| New Jersey: | 0.81 / 10,000 pop. |
| This county: | 6.36 / 10,000 pop. |
| State: | 7.15 / 10,000 pop. |
| Ocean County: | 9.2% |
| New Jersey: | 8.3% |
| Ocean County: | 26.4% |
| State: | 23.3% |
| Here: | 13.2% |
| State: | 18.0% |
Agriculture in Ocean County:
Average size of farms: 56 acresAverage value of agricultural products sold per farm: $49,434
Average value of crops sold per acre for harvested cropland: $3125.38
The value of nursery, greenhouse, floriculture, and sod as a percentage of the total market value of agricultural products sold: 55.04%
The value of livestock, poultry, and their products as a percentage of the total market value of agricultural products sold: 16.41%
Average total farm production expenses per farm: $42,461
Harvested cropland as a percentage of land in farms: 23.44%
Irrigated harvested cropland as a percentage of land in farms: 36.70%
Average market value of all machinery and equipment per farm: $35,164
The percentage of farms operated by a family or individual: 86.18%
Average age of principal farm operators: 54 years
Average number of cattle and calves per 100 acres of all land in farms: 2.61
Corn for grain: 378 harvested acres
Vegetables: 875 harvested acres
Land in orchards: 47 acres
Earthquake activity:
Ocean County-area historical earthquake activity is significantly above New Jersey state average. It is 69% smaller than the overall U.S. average.On 8/23/2011 at 17:51:04, a magnitude 5.8 (5.8 MW, Depth: 3.7 mi, Class: Moderate, Intensity: VI - VII) earthquake occurred 243.9 miles away from Ocean County center
On 1/16/1994 at 01:49:16, a magnitude 4.6 (4.6 MB, 4.6 LG, Depth: 3.1 mi, Class: Light, Intensity: IV - V) earthquake occurred 100.7 miles away from the county center
On 10/7/1983 at 10:18:46, a magnitude 5.3 (5.1 MB, 5.3 LG, 5.1 ML) earthquake occurred 279.1 miles away from the county center
On 8/22/1992 at 12:20:32, a magnitude 4.8 (4.8 MB, 3.8 MS, 4.7 LG, Depth: 6.2 mi) earthquake occurred 215.1 miles away from the county center
On 1/16/1994 at 00:42:43, a magnitude 4.2 (4.2 MB, 4.0 LG, Depth: 3.1 mi) earthquake occurred 99.1 miles away from Ocean County center
On 11/30/2017 at 21:47:31, a magnitude 4.1 (4.1 MW, Depth: 6.1 mi) earthquake occurred 82.0 miles away from the county center
Magnitude types: regional Lg-wave magnitude (LG), body-wave magnitude (MB), local magnitude (ML), surface-wave magnitude (MS), moment magnitude (MW)
Most recent natural disasters:
- New Jersey Covid-19 Pandemic, Incident Period: January 20, 2020, Major Disaster (Presidential) Declared DR-4488-NJ: March 25, 2020, FEMA Id: 4488, Natural disaster type: Other
- New Jersey Severe Winter Storm and Snowstorm, Incident Period: January 22, 2016 to January 24, 2016, Major Disaster (Presidential) Declared DR-4264: March 14, 2016, FEMA Id: 4264, Natural disaster type: Snowstorm, Winter Storm
- New Jersey Hurricane Sandy, Incident Period: October 26, 2012 to November 08, 2012, Emergency Declared EM-3354: October 28, 2012, FEMA Id: 3354, Natural disaster type: Hurricane
- New Jersey Hurricane Sandy, Incident Period: October 26, 2012 to November 08, 2012, Major Disaster (Presidential) Declared DR-4086: October 30, 2012, FEMA Id: 4086, Natural disaster type: Hurricane
- New Jersey Hurricane Irene, Incident Period: August 27, 2011 to September 05, 2011, Major Disaster (Presidential) Declared DR-4021: August 31, 2011, FEMA Id: 4021, Natural disaster type: Hurricane
- New Jersey Hurricane Irene, Incident Period: August 26, 2011 to September 05, 2011, Emergency Declared EM-3332: August 27, 2011, FEMA Id: 3332, Natural disaster type: Hurricane
- New Jersey Severe Winter Storm and Snowstorm, Incident Period: December 26, 2010 to December 27, 2010, Major Disaster (Presidential) Declared DR-1954: February 04, 2011, FEMA Id: 1954, Natural disaster type: Snowstorm, Winter Storm
- New Jersey Severe Storms and Flooding, Incident Period: March 12, 2010 to April 15, 2010, Major Disaster (Presidential) Declared DR-1897: April 02, 2010, FEMA Id: 1897, Natural disaster type: Storm, Flood
- New Jersey Snowstorm, Incident Period: December 19, 2009 to December 20, 2009, Major Disaster (Presidential) Declared DR-1873: February 05, 2010, FEMA Id: 1873, Natural disaster type: Snowstorm
- New Jersey Severe Storms and Flooding Associated with Tropical Depression Ida and a Nor'easter, Incident Period: November 11, 2009 to November 15, 2009, Major Disaster (Presidential) Declared DR-1867: December 22, 2009, FEMA Id: 1867, Natural disaster type: Storm, Flood, Tropical Depression
- 17 other natural disasters have been reported since 1953.
The number of natural disasters in Ocean County (27) is a lot greater than the US average (15).
Major Disasters (Presidential) Declared: 16
Emergencies Declared: 9
Causes of natural disasters: Storms: 7, Floods: 6, Hurricanes: 6, Snowstorms: 4, Blizzards: 2, Fires: 2, Heavy Rains: 2, Water Shortages: 2, Winter Storms: 2, Tropical Depression: 1, Wind: 1, Other: 3 (Note: some incidents may be assigned to more than one category).
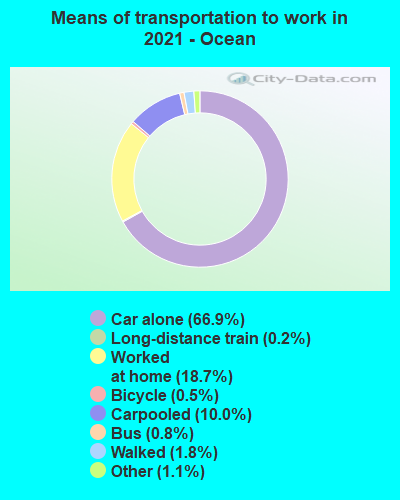
Means of transportation to work:
- Drove a car alone: 148,515 (70.1%)
- Carpooled: 19,910 (9.4%)
- Bus: 854 (0.4%)
- Subway or elevated rail: 75 (0.0%)
- Taxicab, motorcycle, or other means: 2,700 (1.3%)
- Bicycle: 1,240 (0.6%)
- Walked: 4,330 (2.0%)
- Worked at home: 34,214 (16.2%)
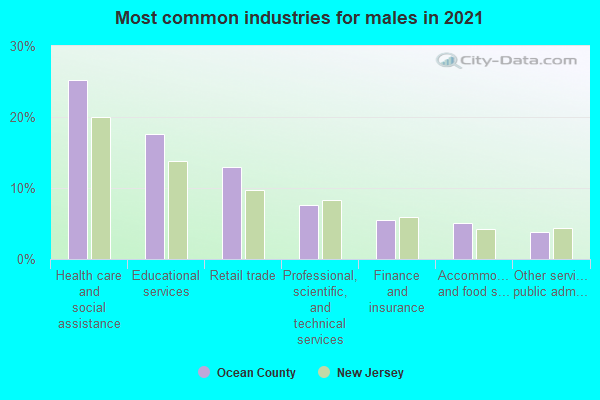
- Health care and social assistance (24%)
- Educational services (18%)
- Retail trade (11%)
- Professional, scientific, and technical services (7%)
- Finance and insurance (6%)
- Accommodation and food services (5%)
- Other services, except public administration (4%)
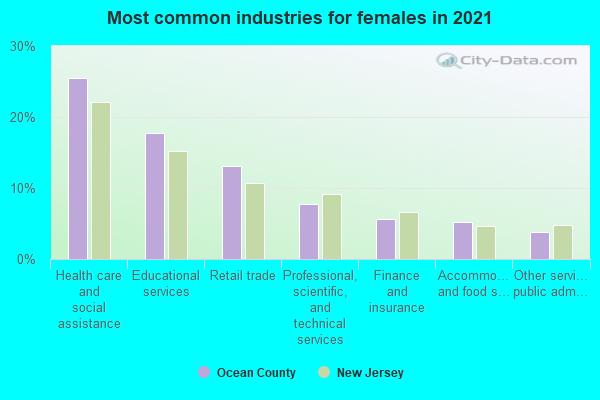
- Health care and social assistance (26%)
- Educational services (19%)
- Retail trade (12%)
- Professional, scientific, and technical services (8%)
- Finance and insurance (6%)
- Accommodation and food services (6%)
- Other services, except public administration (4%)
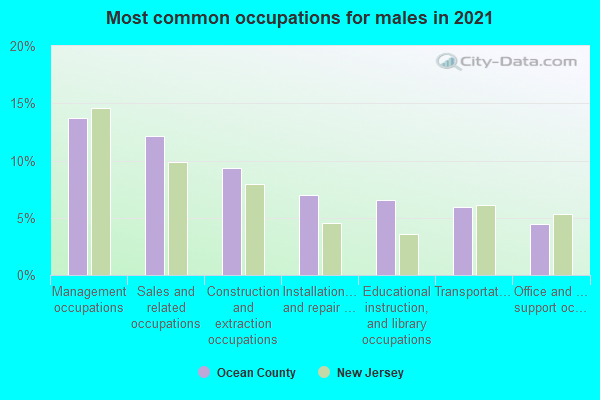
- Management occupations (13%)
- Construction and extraction occupations (11%)
- Sales and related occupations (10%)
- Business and financial operations occupations (7%)
- Installation, maintenance, and repair occupations (7%)
- Office and administrative support occupations (6%)
- Transportation occupations (6%)
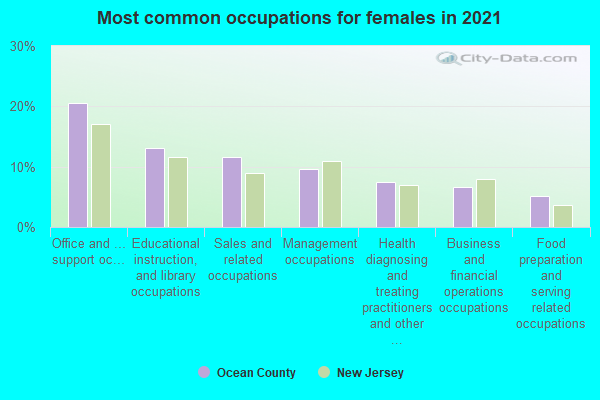
- Office and administrative support occupations (22%)
- Educational instruction, and library occupations (13%)
- Sales and related occupations (10%)
- Management occupations (10%)
- Health diagnosing and treating practitioners and other technical occupations (7%)
- Business and financial operations occupations (5%)
- Personal care and service occupations (5%)
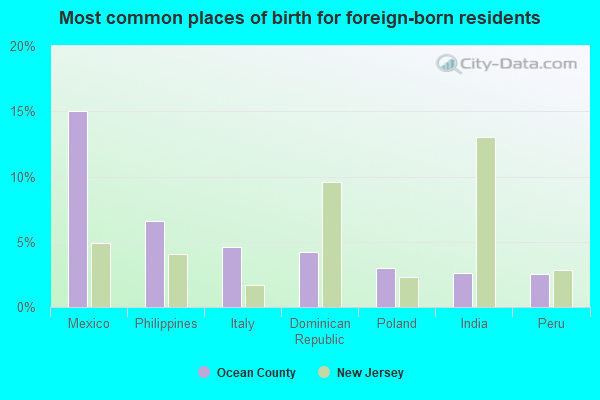
- Mexico (14%)
- Philippines (7%)
- Italy (5%)
- Israel (4%)
- Dominican Republic (4%)
- Germany (4%)
- Colombia (4%)
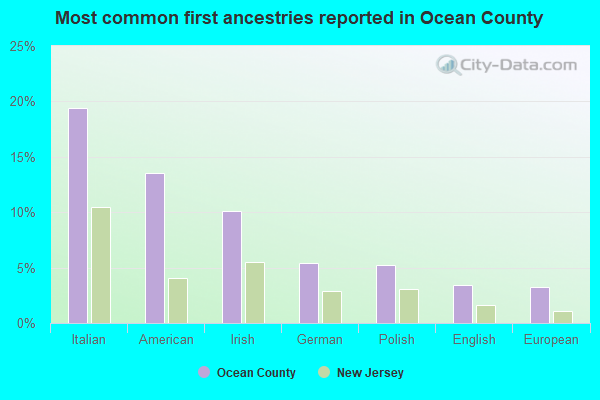
- Italian (19%)
- American (14%)
- Irish (9%)
- Polish (6%)
- German (5%)
- English (3%)
- European (3%)
People in group quarters in Ocean County, New Jersey in 2010:
- 4,277 people in nursing facilities/skilled-nursing facilities
- 1,261 people in college/university student housing
- 581 people in group homes intended for adults
- 540 people in local jails and other municipal confinement facilities
- 187 people in other noninstitutional facilities
- 75 people in emergency and transitional shelters (with sleeping facilities) for people experiencing homelessness
- 63 people in residential treatment centers for adults
- 52 people in correctional facilities intended for juveniles
- 31 people in workers' group living quarters and job corps centers
- 30 people in group homes for juveniles (non-correctional)
- 30 people in military treatment facilities with assigned patients
- 27 people in residential treatment centers for juveniles (non-correctional)
- 9 people in military barracks and dormitories (nondisciplinary)
People in group quarters in Ocean County, New Jersey in 2000:
- 4,570 people in nursing homes
- 851 people in other noninstitutional group quarters
- 800 people in college dormitories (includes college quarters off campus)
- 422 people in wards in general hospitals for patients who have no usual home elsewhere
- 318 people in local jails and other confinement facilities (including police lockups)
- 210 people in schools, hospitals, or wards for the intellectually disabled
- 187 people in military barracks, etc.
- 105 people in orthopedic wards and institutions for the physically handicapped
- 93 people in homes for the mentally retarded
- 61 people in homes for the mentally ill
- 52 people in other nonhousehold living situations
- 41 people in short-term care, detention or diagnostic centers for delinquent children
- 40 people in homes or halfway houses for drug/alcohol abuse
- 31 people in hospitals/wards and hospices for chronically ill
- 31 people in hospices or homes for chronically ill
- 30 people in religious group quarters
- 28 people in other group homes
- 24 people in residential treatment centers for emotionally disturbed children
- 20 people in unknown juvenile institutions
- 8 people in homes for the physically handicapped
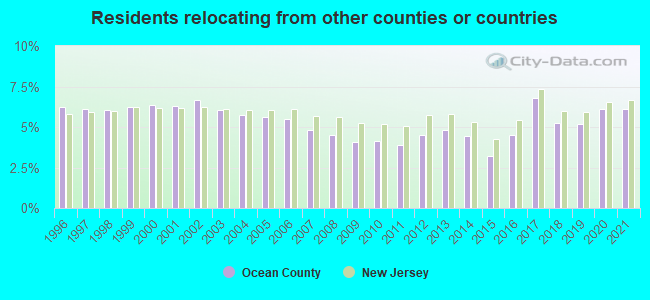
6.12% of this county's 2021 resident taxpayers lived in other counties in 2020 ($95,565 average adjusted gross income)
| Here: | 6.12% |
| New Jersey average: | 6.70% |
0.01% of residents moved from foreign countries ($88 average AGI)
Ocean County: 0.01% New Jersey average: 0.01%
4.01% relocated from other counties in New Jersey ($66,521 average AGI)
2.10% relocated from other states ($28,957 average AGI)
Ocean County: 2.10% New Jersey average: 2.98%
Top counties from which taxpayers relocated into this county between 2020 and 2021:
| from Monmouth County, NJ | |
| from Middlesex County, NJ | |
| from Bergen County, NJ | |
| from Kings County, NY | |
| from Union County, NJ | |
| from Hudson County, NJ | |
| from Essex County, NJ |
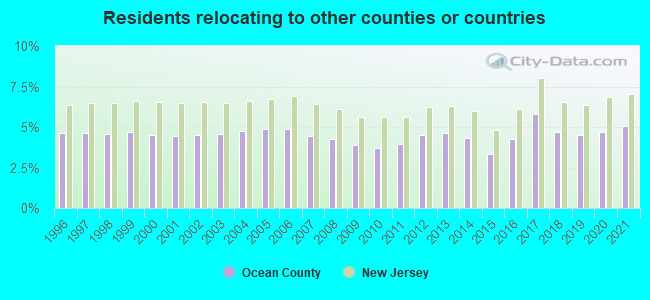
5.03% of this county's 2020 resident taxpayers moved to other counties in 2021 ($85,282 average adjusted gross income)
| Here: | 5.03% |
| New Jersey average: | 7.02% |
0.01% of residents moved to foreign countries ($90 average AGI)
Ocean County: 0.01% New Jersey average: 0.02%
2.50% relocated to other counties in New Jersey ($39,783 average AGI)
2.53% relocated to other states ($45,409 average AGI)
Ocean County: 2.53% New Jersey average: 3.32%
Top counties to which taxpayers relocated from this county between 2020 and 2021:
| to Monmouth County, NJ | |
| to Burlington County, NJ | |
| to Middlesex County, NJ | |
| to Atlantic County, NJ | |
| to Mercer County, NJ | |
| to Bergen County, NJ | |
| to Hudson County, NJ |
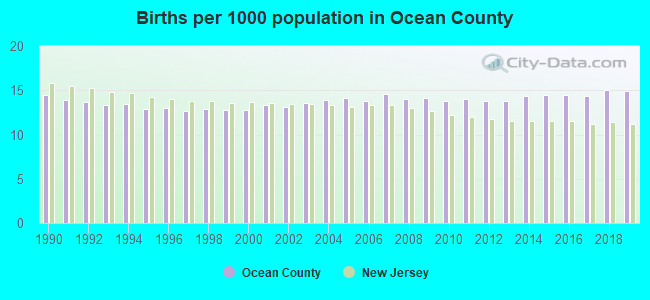
Births per 1000 population from 1990 to 1999: 13.3
Births per 1000 population from 2000 to 2009: 13.7
Births per 1000 population from 2010 to 2022: 12.2
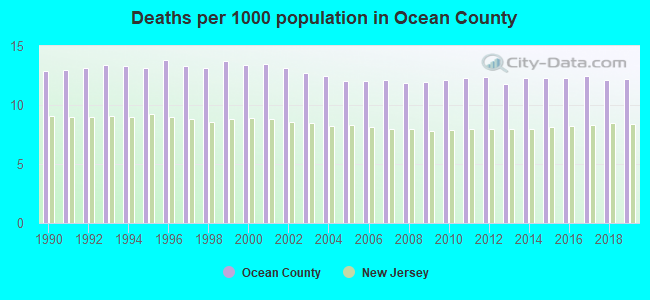
Deaths per 1000 population from 1990 to 1999: 13.3
Deaths per 1000 population from 2000 to 2009: 12.5
Deaths per 1000 population from 2010 to 2020: 12.4
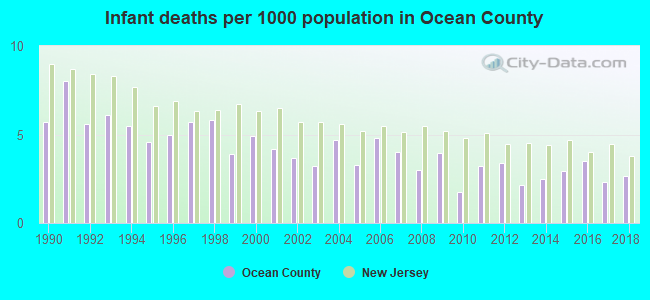
Infant deaths per 1000 live births from 1990 to 1999: 5.6
Infant deaths per 1000 live births from 2000 to 2009: 4.0
Infant deaths per 1000 live births from 2010 to 2021: 2.8
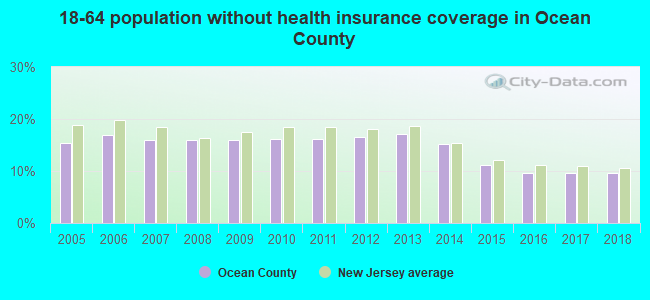
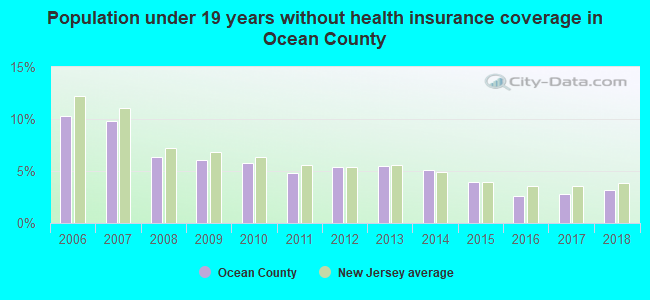
Persons under 19 years old without health insurance coverage in 2018: 3.2%
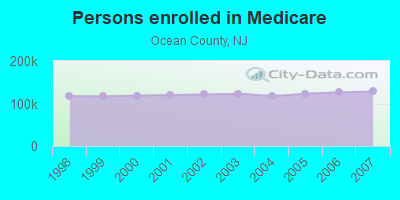
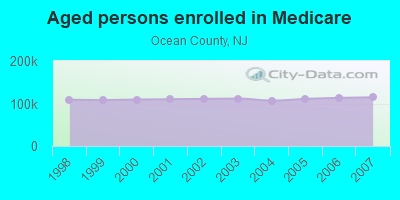
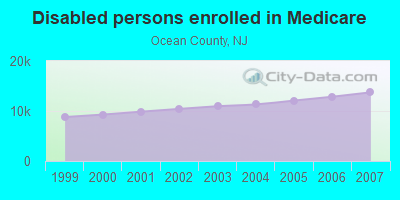
Persons enrolled in hospital insurance and/or supplemental medical insurance (Medicare) in July 1, 2007: 128,296 (114,559 aged, 13,737 disabled)
Children under 18 without health insurance coverage in 2007: 9,920 (7%)
Most common underlying causes of death in Ocean County, New Jersey in 1999 - 2019:
- Atherosclerotic heart disease (19,654)
- Bronchus or lung, unspecified - Malignant neoplasms (9,572)
- Acute myocardial infarction, unspecified (6,764)
- Chronic obstructive pulmonary disease, unspecified (5,514)
- Alzheimer disease, unspecified (4,808)
- Unspecified dementia (3,797)
- Congestive heart failure (3,778)
- Stroke, not specified as haemorrhage or infarction (3,542)
- Septicaemia, unspecified (3,439)
- Atherosclerotic cardiovascular disease, so described (2,901)
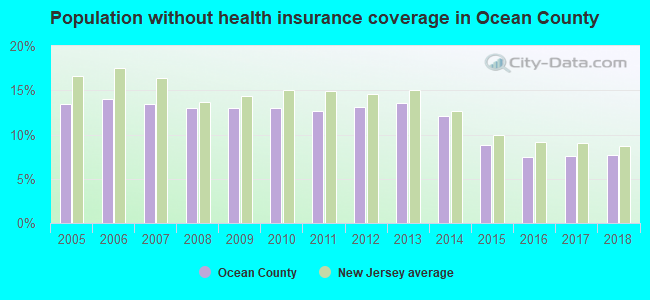
Population without health insurance coverage in 2000: 11%
Children under 18 without health insurance coverage in 2000: 10%
Short term general hospital admissions per 100,000 population in 2004: 11,385
Short term general hospital beds per 100,000 population in 2004: 208
Emergency room visits per 100,000 population in 2004: 36,535
General practice office based MDs per 100,000 population in 2005: 1,298
Medical specialist MDs per 100,000 population in 2005: 1,196
Dentists per 100,000 population in 1998: 16
Total births per 100,000 population, July 2005 - July 2006 : 47
Total deaths per 100,000 population, July 2005 - July 2006: 93
Limited-service eating places per 100,000 population in 2005 : 15
Beer, wine & liquor stores per 100,000 population in 2005: 1
EPA green book nonattainment status in 2004-2006: 1
Homicides per 1,000,000 population from 2000 to 2006: 20.6. This is less than state average.
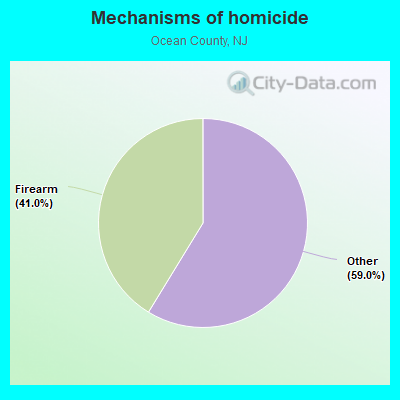
- Firearm - 8.5
- Other - 12.1
Suicides per 1,000,000 population from 2000 to 2006: 87.1. This is more than state average.
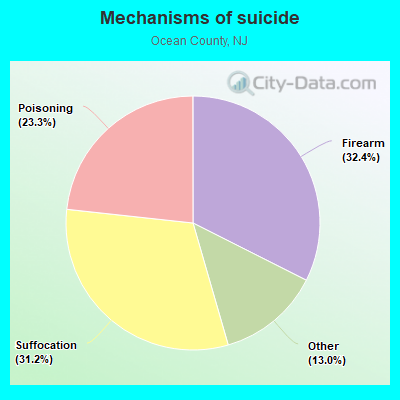
- Firearm - 28.3
- Suffocation - 27.2
- Poisoning - 20.3
- Other - 11.4
Household type by relationship:
Households: 655,735- Male householders: 120,484 (22,916 living alone), Female householders: 121,499 (42,166 living alone)
129,353 spouses (128,256 opposite-sex spouses), 12,303 unmarried partners, (11,873 opposite-sex unmarried partners), 222,044 children (214,518 natural, 3,076 adopted, 4,450 stepchildren), 8,455 grandchildren, 5,846 brothers or sisters, 6,105 parents, 92 foster children, 9,773 other relatives, 12,436 non-relatives
- In group quarters: 7,345
Size of family households: 75,821 2-persons, 31,572 3-persons, 30,687 4-persons, 11,456 5-persons, 4,832 6-persons, 10,973 7-or-more-persons.
Size of nonfamily households: 65,082 1-person, 10,277 2-persons, 579 3-persons, 704 4-persons.
126,498 married couples with children.
25,442 single-parent households (5,633 men, 19,809 women).
87.8% of residents of Ocean speak English at home.
5.9% of residents speak Spanish at home (61% speak English very well, 22% speak English well, 14% speak English not well, 4% don't speak English at all).
3.7% of residents speak other Indo-European language at home (79% speak English very well, 17% speak English well, 4% speak English not well).
1.0% of residents speak Asian or Pacific Island language at home (65% speak English very well, 27% speak English well, 7% speak English not well, 1% don't speak English at all).
1.6% of residents speak other language at home (78% speak English very well, 13% speak English well, 8% speak English not well, 1% don't speak English at all).
In fiscal year 2004:
Federal Government expenditure: $3,374,923,000 ($6,100 per capita)
Department of Defense expenditure: $241,334,000
Federal direct payments to individuals for retirement and disability: $1,838,323,000
Federal other direct payments to individuals: $950,208,000
Federal direct payments not to individuals: $2,851,000
Federal grants: $267,417,000
Federal procurement contracts: $120,230,000 ($86,640,000 Department of Defense)
Federal salaries and wages: $195,895,000 ($110,697,000 Department of Defense)
Federal Government direct loans: $10,395,000
Federal guaranteed/insured loans: $406,692,000
Federal Government insurance: $9,279,343,000
Population change from April 1, 2000 to July 1, 2005:
Births: 36,570| Here: | 65 per 1000 residents |
| State: | 69 per 1000 residents |
Deaths: 36,265
| Here: | 65 per 1000 residents |
| State: | 44 per 1000 residents |
Net international migration: +3,803
| Here: | +7 per 1000 residents |
| State: | +33 per 1000 residents |
Net internal migration: +43,472
| Here: | |
| State: |
Total withdrawal of fresh water for public supply: 49.64 millions of gallons per day (87% from ground, 13% from surface)
| Here: | 6.4 |
| State: | 6.8 |
| Here: | 4.7 |
| State: | 3.9 |
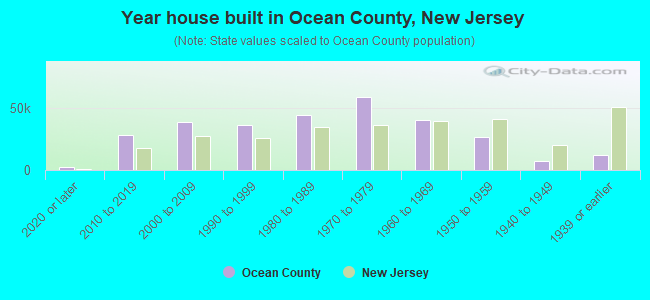
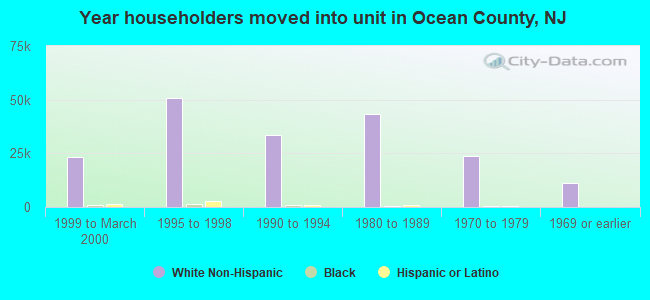
- Year house built in Ocean County, New Jersey
- 3,1242020 or later
- 28,1722010 to 2019
- 42,5412000 to 2009
- 33,0821990 to 1999
- 46,0211980 to 1989
- 56,7221970 to 1979
- 41,7841960 to 1969
- 24,9331950 to 1959
- 7,0071940 to 1949
- 12,2621939 or earlier
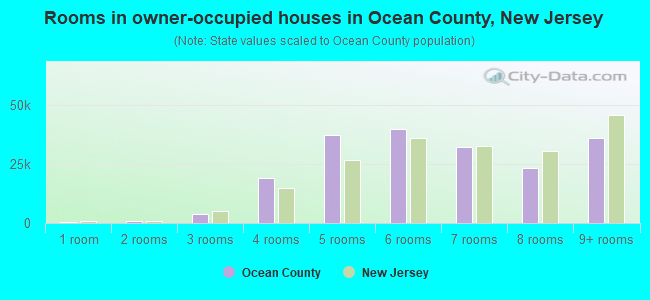
- Rooms in owner-occupied houses in Ocean County, New Jersey
- 3551 room
- 6942 rooms
- 5,4383 rooms
- 21,8494 rooms
- 34,5015 rooms
- 40,4436 rooms
- 30,7577 rooms
- 23,6828 rooms
- 37,7969+ rooms
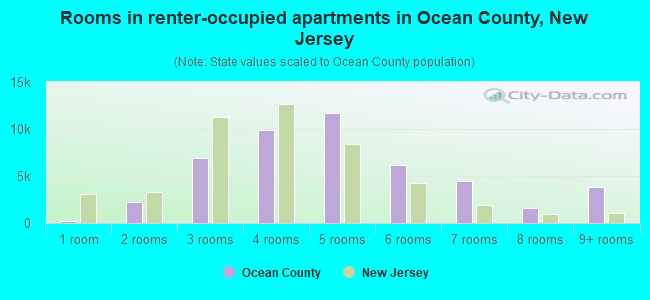
- Rooms in renter-occupied apartments in Ocean County, New Jersey
- 1,2501 room
- 1,7732 rooms
- 5,6563 rooms
- 13,0034 rooms
- 9,6765 rooms
- 5,2166 rooms
- 3,3557 rooms
- 1,9818 rooms
- 4,5589+ rooms
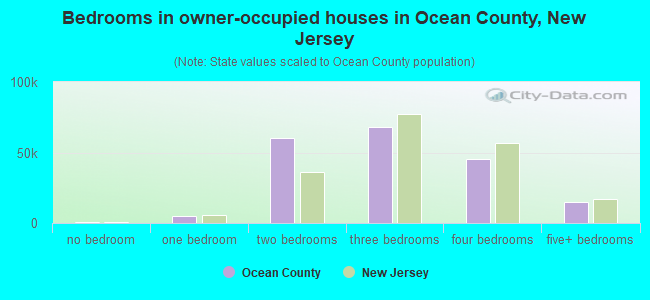
- Bedrooms in owner-occupied houses in Ocean County, New Jersey
- 355no bedroom
- 5,1951 bedroom
- 62,6062 bedrooms
- 67,4433 bedrooms
- 43,2304 bedrooms
- 16,6865+ bedrooms
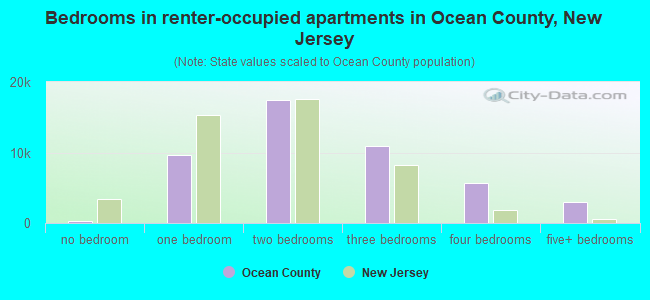
- Bedrooms in renter-occupied apartments in Ocean County, New Jersey
- 1,250no bedroom
- 11,0791 bedroom
- 17,1962 bedrooms
- 9,2243 bedrooms
- 3,4654 bedrooms
- 4,2545+ bedrooms
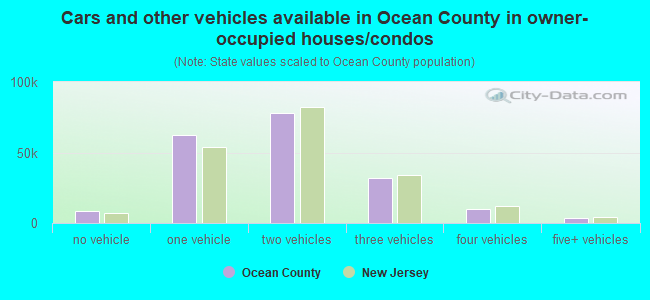
- Cars and other vehicles available in Ocean County in owner-occupied houses/condos
- 7,771no vehicle
- 66,4391 vehicle
- 78,2522 vehicles
- 26,8803 vehicles
- 12,2724 vehicles
- 3,9015+ vehicles
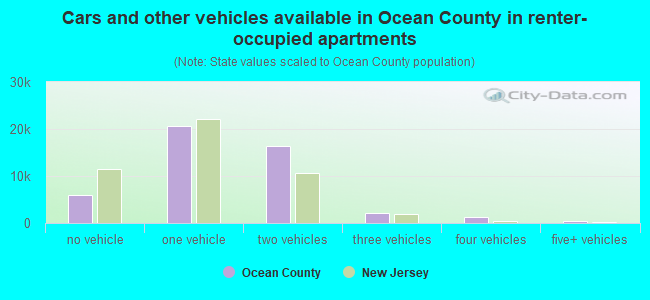
- Cars and other vehicles available in Ocean County in renter-occupied apartments
- 6,361no vehicle
- 19,6401 vehicle
- 17,2692 vehicles
- 2,5613 vehicles
- 4504 vehicles
- 1875+ vehicles
92.0% of Ocean County residents lived in the same house 1 years ago.
Out of people who lived in different houses, 35% lived in this county.
Out of people who lived in different counties, 57% lived in New Jersey.
| Ocean County: | 92.0% |
| State average: | 90.4% |
Place of birth for U.S.-born residents:
- This state: 432,701
- Other state: 162,097
- Northeast: 131,432
- Midwest: 10,407
- South: 13,640
- West: 6,618
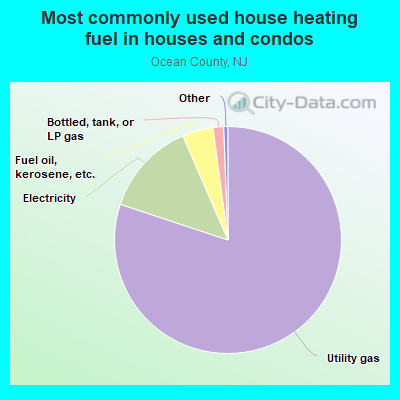
- 80.9%Utility gas
- 12.8%Electricity
- 3.9%Fuel oil, kerosene, etc.
- 0.9%Bottled, tank, or LP gas
- 0.5%Wood
- 0.3%No fuel used
- 0.3%Solar energy
- 0.3%Other fuel
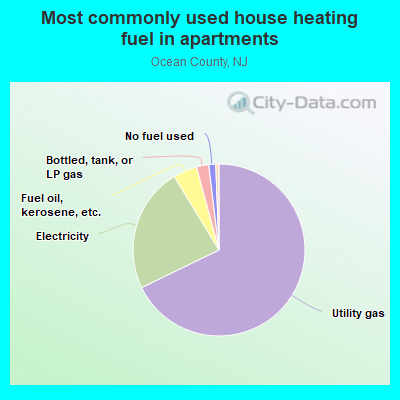
- 66.6%Utility gas
- 25.8%Electricity
- 4.3%Bottled, tank, or LP gas
- 1.6%Fuel oil, kerosene, etc.
- 1.0%Other fuel
- 0.4%Solar energy
- 0.2%No fuel used
- 0.1%Coal or coke
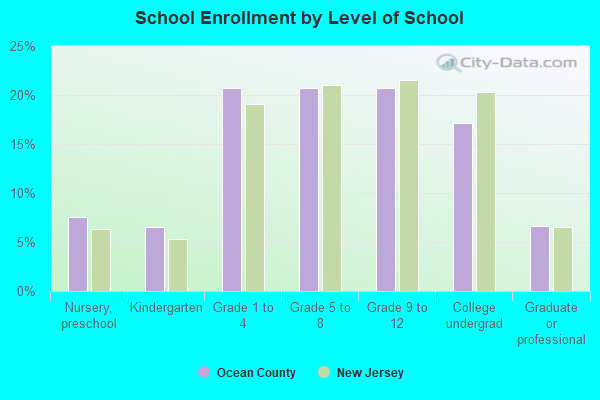
Private vs. public school enrollment:
| Here: | 47.9% |
| New Jersey: | 12.3% |
| Here: | 39.4% |
| New Jersey: | 13.1% |
| Here: | 46.8% |
| New Jersey: | 33.2% |
Ocean County government finances - Expenditure in 2020:
- Assistance and Subsidies - Public Welfare, Federal Categorical Assistance Programs: $4,253,000
Public Welfare, Federal Categorical Assistance Programs: $3,982,000
Public Welfare, Cash Assistance Programs - Other: $1,454,000
Public Welfare, Cash Assistance Programs - Other: $1,362,000
- Bond Funds - Cash and Securities: $173,314,000
Cash and Securities: $142,053,000
- Charges - Higher Education - Other: $32,049,000
Higher Education - Other: $30,760,000
Other: $15,779,000
Other: $14,636,000
Higher Education Auxiliary Enterprises: $5,566,000
Elementary and Secondary Education School Tuition and Transportation: $4,098,000
Elementary and Secondary Education School Tuition and Transportation: $3,801,000
Higher Education Auxiliary Enterprises: $3,681,000
Parks and Recreation: $1,318,000
Parks and Recreation: $1,222,000
Air Transportation: $328,000
Air Transportation: $305,000
Regular Highways: $290,000
Regular Highways: $269,000
Elementary and Secondary Education School Lunch: $192,000
Elementary and Secondary Education School Lunch: $178,000
Elementary and Secondary Education - Other: $32,000
Elementary and Secondary Education - Other: $30,000
Solid Waste Management: $4,000
Solid Waste Management: $4,000
- Construction - Regular Highways: $23,965,000
Other Higher Education: $20,339,000
Regular Highways: $15,406,000
Other Higher Education: $15,404,000
Elementary and Secondary Education: $14,233,000
General Public Buildings: $3,583,000
Elementary and Secondary Education: $2,925,000
General Public Buildings: $2,303,000
Parks and Recreation: $980,000
General - Other: $712,000
Parks and Recreation: $630,000
General - Other: $458,000
Sewerage: $330,000
Air Transportation: $271,000
Sewerage: $212,000
Libraries: $194,000
Air Transportation: $174,000
Libraries: $125,000
Correctional Institutions: $61,000
Correctional Institutions: $39,000
- Current Operations - General - Other: $119,560,000
General - Other: $107,582,000
Other Higher Education: $75,655,000
Other Higher Education: $68,075,000
Public Welfare - Other: $46,323,000
Public Welfare - Other: $41,682,000
Libraries: $35,966,000
Libraries: $32,362,000
Elementary and Secondary Education: $32,289,000
Elementary and Secondary Education: $30,816,000
Correctional Institutions: $21,368,000
Regular Highways: $19,316,000
Correctional Institutions: $19,227,000
Police Protection: $17,505,000
Regular Highways: $17,381,000
Police Protection: $15,751,000
Public Welfare, Vendor Payments for Other Purposes: $15,044,000
Judicial and Legal Services: $14,577,000
Public Welfare, Vendor Payments for Other Purposes: $13,536,000
Judicial and Legal Services: $13,117,000
Higher Education Auxiliary Enterprises: $7,325,000
General Public Buildings: $6,530,000
General Public Buildings: $5,875,000
Financial Administration: $5,838,000
Financial Administration: $5,253,000
Higher Education Auxiliary Enterprises: $5,100,000
Parks and Recreation: $4,882,000
Central Staff Services: $4,710,000
Parks and Recreation: $4,393,000
Central Staff Services: $4,238,000
Corrections - Other: $3,322,000
Corrections - Other: $2,989,000
Solid Waste Management: $2,732,000
Solid Waste Management: $2,458,000
Health - Other: $2,131,000
Housing and Community Development: $1,956,000
Health - Other: $1,917,000
Housing and Community Development: $1,760,000
Local Fire Protection: $471,000
Natural Resources - Other: $435,000
Local Fire Protection: $423,000
Natural Resources - Other: $391,000
Transit Utilities: $60,000
Transit Utilities: $60,000
Air Transportation: $58,000
Air Transportation: $52,000
- Federal Intergovernmental - Other: $6,509,000
Other: $6,397,000
Education: $3,245,000
Housing and Community Development: $2,109,000
Housing and Community Development: $2,073,000
Education: $2,002,000
Air Transportation: $495,000
Air Transportation: $487,000
Transit Utilities: $55,000
Transit Utilities: $54,000
- General - Interest on Debt: $14,660,000
Interest on Debt: $3,503,000
- Intergovernmental to Local - Other - Other Higher Education: $74,000
Other - Other Higher Education: $45,000
- Intergovernmental to State - Hospitals: $918,000
Hospitals: $562,000
Elementary and Secondary Education: $50,000
Elementary and Secondary Education: $50,000
- Local Intergovernmental - Education: $24,481,000
Highways: $1,222,000
Highways: $1,200,000
Education: $716,000
Other: $485,000
Other: $477,000
- Long Term Debt - Beginning Outstanding - Unspecified Public Purpose: $303,303,000
Outstanding Unspecified Public Purpose: $189,475,000
Retired Unspecified Public Purpose: $113,828,000
Beginning Outstanding - Unspecified Public Purpose: $75,647,000
Retired Unspecified Public Purpose: $75,647,000
- Miscellaneous - Donations From Private Sources: $10,792,000
Donations From Private Sources: $8,517,000
Fines and Forfeits: $4,234,000
General Revenue - Other: $3,631,000
Fines and Forfeits: $3,341,000
General Revenue - Other: $2,865,000
Rents: $591,000
Interest Earnings: $590,000
Rents: $466,000
Interest Earnings: $388,000
- Other Capital Outlay - General - Other: $930,000
Other Higher Education: $830,000
Elementary and Secondary Education: $715,000
Financial Administration: $582,000
General - Other: $475,000
Other Higher Education: $424,000
Regular Highways: $416,000
Elementary and Secondary Education: $365,000
Parks and Recreation: $304,000
Financial Administration: $297,000
Regular Highways: $212,000
Parks and Recreation: $155,000
Solid Waste Management: $139,000
Solid Waste Management: $71,000
Higher Education - Auxiliary Enterprises: $48,000
Higher Education - Auxiliary Enterprises: $40,000
Correctional Institutions: $1,000
- Other Funds - Cash and Securities: $128,089,000
Cash and Securities: $106,213,000
- State Intergovernmental - Education: $27,053,000
Education: $26,934,000
Public Welfare: $24,269,000
Public Welfare: $24,162,000
Other: $14,622,000
Other: $14,558,000
Health and Hospitals: $1,080,000
Health and Hospitals: $1,075,000
- Tax - Property: $384,517,000
Property: $376,391,000
Other License: $40,000
Other License: $40,000
- Total Salaries and Wages: $69,594,000
: $67,191,000
Ocean County government finances - Revenue in 2020:
- Assistance and Subsidies - Public Welfare, Federal Categorical Assistance Programs: $4,253,000
Public Welfare, Federal Categorical Assistance Programs: $3,982,000
Public Welfare, Cash Assistance Programs - Other: $1,454,000
Public Welfare, Cash Assistance Programs - Other: $1,362,000
- Bond Funds - Cash and Securities: $173,314,000
Cash and Securities: $142,053,000
- Charges - Higher Education - Other: $32,049,000
Higher Education - Other: $30,760,000
Other: $15,779,000
Other: $14,636,000
Higher Education Auxiliary Enterprises: $5,566,000
Elementary and Secondary Education School Tuition and Transportation: $4,098,000
Elementary and Secondary Education School Tuition and Transportation: $3,801,000
Higher Education Auxiliary Enterprises: $3,681,000
Parks and Recreation: $1,318,000
Parks and Recreation: $1,222,000
Air Transportation: $328,000
Air Transportation: $305,000
Regular Highways: $290,000
Regular Highways: $269,000
Elementary and Secondary Education School Lunch: $192,000
Elementary and Secondary Education School Lunch: $178,000
Elementary and Secondary Education - Other: $32,000
Elementary and Secondary Education - Other: $30,000
Solid Waste Management: $4,000
Solid Waste Management: $4,000
- Construction - Regular Highways: $23,965,000
Other Higher Education: $20,339,000
Regular Highways: $15,406,000
Other Higher Education: $15,404,000
Elementary and Secondary Education: $14,233,000
General Public Buildings: $3,583,000
Elementary and Secondary Education: $2,925,000
General Public Buildings: $2,303,000
Parks and Recreation: $980,000
General - Other: $712,000
Parks and Recreation: $630,000
General - Other: $458,000
Sewerage: $330,000
Air Transportation: $271,000
Sewerage: $212,000
Libraries: $194,000
Air Transportation: $174,000
Libraries: $125,000
Correctional Institutions: $61,000
Correctional Institutions: $39,000
- Current Operations - General - Other: $119,560,000
General - Other: $107,582,000
Other Higher Education: $75,655,000
Other Higher Education: $68,075,000
Public Welfare - Other: $46,323,000
Public Welfare - Other: $41,682,000
Libraries: $35,966,000
Libraries: $32,362,000
Elementary and Secondary Education: $32,289,000
Elementary and Secondary Education: $30,816,000
Correctional Institutions: $21,368,000
Regular Highways: $19,316,000
Correctional Institutions: $19,227,000
Police Protection: $17,505,000
Regular Highways: $17,381,000
Police Protection: $15,751,000
Public Welfare, Vendor Payments for Other Purposes: $15,044,000
Judicial and Legal Services: $14,577,000
Public Welfare, Vendor Payments for Other Purposes: $13,536,000
Judicial and Legal Services: $13,117,000
Higher Education Auxiliary Enterprises: $7,325,000
General Public Buildings: $6,530,000
General Public Buildings: $5,875,000
Financial Administration: $5,838,000
Financial Administration: $5,253,000
Higher Education Auxiliary Enterprises: $5,100,000
Parks and Recreation: $4,882,000
Central Staff Services: $4,710,000
Parks and Recreation: $4,393,000
Central Staff Services: $4,238,000
Corrections - Other: $3,322,000
Corrections - Other: $2,989,000
Solid Waste Management: $2,732,000
Solid Waste Management: $2,458,000
Health - Other: $2,131,000
Housing and Community Development: $1,956,000
Health - Other: $1,917,000
Housing and Community Development: $1,760,000
Local Fire Protection: $471,000
Natural Resources - Other: $435,000
Local Fire Protection: $423,000
Natural Resources - Other: $391,000
Transit Utilities: $60,000
Transit Utilities: $60,000
Air Transportation: $58,000
Air Transportation: $52,000
- Federal Intergovernmental - Other: $6,509,000
Other: $6,397,000
Education: $3,245,000
Housing and Community Development: $2,109,000
Housing and Community Development: $2,073,000
Education: $2,002,000
Air Transportation: $495,000
Air Transportation: $487,000
Transit Utilities: $55,000
Transit Utilities: $54,000
- General - Interest on Debt: $14,660,000
Interest on Debt: $3,503,000
- Intergovernmental to Local - Other - Other Higher Education: $74,000
Other - Other Higher Education: $45,000
- Intergovernmental to State - Hospitals: $918,000
Hospitals: $562,000
Elementary and Secondary Education: $50,000
Elementary and Secondary Education: $50,000
- Local Intergovernmental - Education: $24,481,000
Highways: $1,222,000
Highways: $1,200,000
Education: $716,000
Other: $485,000
Other: $477,000
- Long Term Debt - Beginning Outstanding - Unspecified Public Purpose: $303,303,000
Outstanding Unspecified Public Purpose: $189,475,000
Retired Unspecified Public Purpose: $113,828,000
Beginning Outstanding - Unspecified Public Purpose: $75,647,000
Retired Unspecified Public Purpose: $75,647,000
- Miscellaneous - Donations From Private Sources: $10,792,000
Donations From Private Sources: $8,517,000
Fines and Forfeits: $4,234,000
General Revenue - Other: $3,631,000
Fines and Forfeits: $3,341,000
General Revenue - Other: $2,865,000
Rents: $591,000
Interest Earnings: $590,000
Rents: $466,000
Interest Earnings: $388,000
- Other Capital Outlay - General - Other: $930,000
Other Higher Education: $830,000
Elementary and Secondary Education: $715,000
Financial Administration: $582,000
General - Other: $475,000
Other Higher Education: $424,000
Regular Highways: $416,000
Elementary and Secondary Education: $365,000
Parks and Recreation: $304,000
Financial Administration: $297,000
Regular Highways: $212,000
Parks and Recreation: $155,000
Solid Waste Management: $139,000
Solid Waste Management: $71,000
Higher Education - Auxiliary Enterprises: $48,000
Higher Education - Auxiliary Enterprises: $40,000
Correctional Institutions: $1,000
- Other Funds - Cash and Securities: $128,089,000
Cash and Securities: $106,213,000
- State Intergovernmental - Education: $27,053,000
Education: $26,934,000
Public Welfare: $24,269,000
Public Welfare: $24,162,000
Other: $14,622,000
Other: $14,558,000
Health and Hospitals: $1,080,000
Health and Hospitals: $1,075,000
- Tax - Property: $384,517,000
Property: $376,391,000
Other License: $40,000
Other License: $40,000
- Total Salaries and Wages: $69,594,000
: $67,191,000
Ocean County government finances - Debt in 2020:
- Assistance and Subsidies - Public Welfare, Federal Categorical Assistance Programs: $4,253,000
Public Welfare, Federal Categorical Assistance Programs: $3,982,000
Public Welfare, Cash Assistance Programs - Other: $1,454,000
Public Welfare, Cash Assistance Programs - Other: $1,362,000
- Bond Funds - Cash and Securities: $173,314,000
Cash and Securities: $142,053,000
- Charges - Higher Education - Other: $32,049,000
Higher Education - Other: $30,760,000
Other: $15,779,000
Other: $14,636,000
Higher Education Auxiliary Enterprises: $5,566,000
Elementary and Secondary Education School Tuition and Transportation: $4,098,000
Elementary and Secondary Education School Tuition and Transportation: $3,801,000
Higher Education Auxiliary Enterprises: $3,681,000
Parks and Recreation: $1,318,000
Parks and Recreation: $1,222,000
Air Transportation: $328,000
Air Transportation: $305,000
Regular Highways: $290,000
Regular Highways: $269,000
Elementary and Secondary Education School Lunch: $192,000
Elementary and Secondary Education School Lunch: $178,000
Elementary and Secondary Education - Other: $32,000
Elementary and Secondary Education - Other: $30,000
Solid Waste Management: $4,000
Solid Waste Management: $4,000
- Construction - Regular Highways: $23,965,000
Other Higher Education: $20,339,000
Regular Highways: $15,406,000
Other Higher Education: $15,404,000
Elementary and Secondary Education: $14,233,000
General Public Buildings: $3,583,000
Elementary and Secondary Education: $2,925,000
General Public Buildings: $2,303,000
Parks and Recreation: $980,000
General - Other: $712,000
Parks and Recreation: $630,000
General - Other: $458,000
Sewerage: $330,000
Air Transportation: $271,000
Sewerage: $212,000
Libraries: $194,000
Air Transportation: $174,000
Libraries: $125,000
Correctional Institutions: $61,000
Correctional Institutions: $39,000
- Current Operations - General - Other: $119,560,000
General - Other: $107,582,000
Other Higher Education: $75,655,000
Other Higher Education: $68,075,000
Public Welfare - Other: $46,323,000
Public Welfare - Other: $41,682,000
Libraries: $35,966,000
Libraries: $32,362,000
Elementary and Secondary Education: $32,289,000
Elementary and Secondary Education: $30,816,000
Correctional Institutions: $21,368,000
Regular Highways: $19,316,000
Correctional Institutions: $19,227,000
Police Protection: $17,505,000
Regular Highways: $17,381,000
Police Protection: $15,751,000
Public Welfare, Vendor Payments for Other Purposes: $15,044,000
Judicial and Legal Services: $14,577,000
Public Welfare, Vendor Payments for Other Purposes: $13,536,000
Judicial and Legal Services: $13,117,000
Higher Education Auxiliary Enterprises: $7,325,000
General Public Buildings: $6,530,000
General Public Buildings: $5,875,000
Financial Administration: $5,838,000
Financial Administration: $5,253,000
Higher Education Auxiliary Enterprises: $5,100,000
Parks and Recreation: $4,882,000
Central Staff Services: $4,710,000
Parks and Recreation: $4,393,000
Central Staff Services: $4,238,000
Corrections - Other: $3,322,000
Corrections - Other: $2,989,000
Solid Waste Management: $2,732,000
Solid Waste Management: $2,458,000
Health - Other: $2,131,000
Housing and Community Development: $1,956,000
Health - Other: $1,917,000
Housing and Community Development: $1,760,000
Local Fire Protection: $471,000
Natural Resources - Other: $435,000
Local Fire Protection: $423,000
Natural Resources - Other: $391,000
Transit Utilities: $60,000
Transit Utilities: $60,000
Air Transportation: $58,000
Air Transportation: $52,000
- Federal Intergovernmental - Other: $6,509,000
Other: $6,397,000
Education: $3,245,000
Housing and Community Development: $2,109,000
Housing and Community Development: $2,073,000
Education: $2,002,000
Air Transportation: $495,000
Air Transportation: $487,000
Transit Utilities: $55,000
Transit Utilities: $54,000
- General - Interest on Debt: $14,660,000
Interest on Debt: $3,503,000
- Intergovernmental to Local - Other - Other Higher Education: $74,000
Other - Other Higher Education: $45,000
- Intergovernmental to State - Hospitals: $918,000
Hospitals: $562,000
Elementary and Secondary Education: $50,000
Elementary and Secondary Education: $50,000
- Local Intergovernmental - Education: $24,481,000
Highways: $1,222,000
Highways: $1,200,000
Education: $716,000
Other: $485,000
Other: $477,000
- Long Term Debt - Beginning Outstanding - Unspecified Public Purpose: $303,303,000
Outstanding Unspecified Public Purpose: $189,475,000
Retired Unspecified Public Purpose: $113,828,000
Beginning Outstanding - Unspecified Public Purpose: $75,647,000
Retired Unspecified Public Purpose: $75,647,000
- Miscellaneous - Donations From Private Sources: $10,792,000
Donations From Private Sources: $8,517,000
Fines and Forfeits: $4,234,000
General Revenue - Other: $3,631,000
Fines and Forfeits: $3,341,000
General Revenue - Other: $2,865,000
Rents: $591,000
Interest Earnings: $590,000
Rents: $466,000
Interest Earnings: $388,000
- Other Capital Outlay - General - Other: $930,000
Other Higher Education: $830,000
Elementary and Secondary Education: $715,000
Financial Administration: $582,000
General - Other: $475,000
Other Higher Education: $424,000
Regular Highways: $416,000
Elementary and Secondary Education: $365,000
Parks and Recreation: $304,000
Financial Administration: $297,000
Regular Highways: $212,000
Parks and Recreation: $155,000
Solid Waste Management: $139,000
Solid Waste Management: $71,000
Higher Education - Auxiliary Enterprises: $48,000
Higher Education - Auxiliary Enterprises: $40,000
Correctional Institutions: $1,000
- Other Funds - Cash and Securities: $128,089,000
Cash and Securities: $106,213,000
- State Intergovernmental - Education: $27,053,000
Education: $26,934,000
Public Welfare: $24,269,000
Public Welfare: $24,162,000
Other: $14,622,000
Other: $14,558,000
Health and Hospitals: $1,080,000
Health and Hospitals: $1,075,000
- Tax - Property: $384,517,000
Property: $376,391,000
Other License: $40,000
Other License: $40,000
- Total Salaries and Wages: $69,594,000
: $67,191,000
Ocean County government finances - Cash and Securities in 2020:
- Assistance and Subsidies - Public Welfare, Federal Categorical Assistance Programs: $4,253,000
Public Welfare, Federal Categorical Assistance Programs: $3,982,000
Public Welfare, Cash Assistance Programs - Other: $1,454,000
Public Welfare, Cash Assistance Programs - Other: $1,362,000
- Bond Funds - Cash and Securities: $173,314,000
Cash and Securities: $142,053,000
- Charges - Higher Education - Other: $32,049,000
Higher Education - Other: $30,760,000
Other: $15,779,000
Other: $14,636,000
Higher Education Auxiliary Enterprises: $5,566,000
Elementary and Secondary Education School Tuition and Transportation: $4,098,000
Elementary and Secondary Education School Tuition and Transportation: $3,801,000
Higher Education Auxiliary Enterprises: $3,681,000
Parks and Recreation: $1,318,000
Parks and Recreation: $1,222,000
Air Transportation: $328,000
Air Transportation: $305,000
Regular Highways: $290,000
Regular Highways: $269,000
Elementary and Secondary Education School Lunch: $192,000
Elementary and Secondary Education School Lunch: $178,000
Elementary and Secondary Education - Other: $32,000
Elementary and Secondary Education - Other: $30,000
Solid Waste Management: $4,000
Solid Waste Management: $4,000
- Construction - Regular Highways: $23,965,000
Other Higher Education: $20,339,000
Regular Highways: $15,406,000
Other Higher Education: $15,404,000
Elementary and Secondary Education: $14,233,000
General Public Buildings: $3,583,000
Elementary and Secondary Education: $2,925,000
General Public Buildings: $2,303,000
Parks and Recreation: $980,000
General - Other: $712,000
Parks and Recreation: $630,000
General - Other: $458,000
Sewerage: $330,000
Air Transportation: $271,000
Sewerage: $212,000
Libraries: $194,000
Air Transportation: $174,000
Libraries: $125,000
Correctional Institutions: $61,000
Correctional Institutions: $39,000
- Current Operations - General - Other: $119,560,000
General - Other: $107,582,000
Other Higher Education: $75,655,000
Other Higher Education: $68,075,000
Public Welfare - Other: $46,323,000
Public Welfare - Other: $41,682,000
Libraries: $35,966,000
Libraries: $32,362,000
Elementary and Secondary Education: $32,289,000
Elementary and Secondary Education: $30,816,000
Correctional Institutions: $21,368,000
Regular Highways: $19,316,000
Correctional Institutions: $19,227,000
Police Protection: $17,505,000
Regular Highways: $17,381,000
Police Protection: $15,751,000
Public Welfare, Vendor Payments for Other Purposes: $15,044,000
Judicial and Legal Services: $14,577,000
Public Welfare, Vendor Payments for Other Purposes: $13,536,000
Judicial and Legal Services: $13,117,000
Higher Education Auxiliary Enterprises: $7,325,000
General Public Buildings: $6,530,000
General Public Buildings: $5,875,000
Financial Administration: $5,838,000
Financial Administration: $5,253,000
Higher Education Auxiliary Enterprises: $5,100,000
Parks and Recreation: $4,882,000
Central Staff Services: $4,710,000
Parks and Recreation: $4,393,000
Central Staff Services: $4,238,000
Corrections - Other: $3,322,000
Corrections - Other: $2,989,000
Solid Waste Management: $2,732,000
Solid Waste Management: $2,458,000
Health - Other: $2,131,000
Housing and Community Development: $1,956,000
Health - Other: $1,917,000
Housing and Community Development: $1,760,000
Local Fire Protection: $471,000
Natural Resources - Other: $435,000
Local Fire Protection: $423,000
Natural Resources - Other: $391,000
Transit Utilities: $60,000
Transit Utilities: $60,000
Air Transportation: $58,000
Air Transportation: $52,000
- Federal Intergovernmental - Other: $6,509,000
Other: $6,397,000
Education: $3,245,000
Housing and Community Development: $2,109,000
Housing and Community Development: $2,073,000
Education: $2,002,000
Air Transportation: $495,000
Air Transportation: $487,000
Transit Utilities: $55,000
Transit Utilities: $54,000
- General - Interest on Debt: $14,660,000
Interest on Debt: $3,503,000
- Intergovernmental to Local - Other - Other Higher Education: $74,000
Other - Other Higher Education: $45,000
- Intergovernmental to State - Hospitals: $918,000
Hospitals: $562,000
Elementary and Secondary Education: $50,000
Elementary and Secondary Education: $50,000
- Local Intergovernmental - Education: $24,481,000
Highways: $1,222,000
Highways: $1,200,000
Education: $716,000
Other: $485,000
Other: $477,000
- Long Term Debt - Beginning Outstanding - Unspecified Public Purpose: $303,303,000
Outstanding Unspecified Public Purpose: $189,475,000
Retired Unspecified Public Purpose: $113,828,000
Beginning Outstanding - Unspecified Public Purpose: $75,647,000
Retired Unspecified Public Purpose: $75,647,000
- Miscellaneous - Donations From Private Sources: $10,792,000
Donations From Private Sources: $8,517,000
Fines and Forfeits: $4,234,000
General Revenue - Other: $3,631,000
Fines and Forfeits: $3,341,000
General Revenue - Other: $2,865,000
Rents: $591,000
Interest Earnings: $590,000
Rents: $466,000
Interest Earnings: $388,000
- Other Capital Outlay - General - Other: $930,000
Other Higher Education: $830,000
Elementary and Secondary Education: $715,000
Financial Administration: $582,000
General - Other: $475,000
Other Higher Education: $424,000
Regular Highways: $416,000
Elementary and Secondary Education: $365,000
Parks and Recreation: $304,000
Financial Administration: $297,000
Regular Highways: $212,000
Parks and Recreation: $155,000
Solid Waste Management: $139,000
Solid Waste Management: $71,000
Higher Education - Auxiliary Enterprises: $48,000
Higher Education - Auxiliary Enterprises: $40,000
Correctional Institutions: $1,000
- Other Funds - Cash and Securities: $128,089,000
Cash and Securities: $106,213,000
- State Intergovernmental - Education: $27,053,000
Education: $26,934,000
Public Welfare: $24,269,000
Public Welfare: $24,162,000
Other: $14,622,000
Other: $14,558,000
Health and Hospitals: $1,080,000
Health and Hospitals: $1,075,000
- Tax - Property: $384,517,000
Property: $376,391,000
Other License: $40,000
Other License: $40,000
- Total Salaries and Wages: $69,594,000
: $67,191,000
Supplemental Security Income (SSI) in 2006:
- Total number of recipients: 5,479
- Number of aged recipients: 723
- Number of blind and disabled recipients: 4,756
- Number of recipients under 18: 748
- Number of recipients between 18 and 64: 3,508
- Number of recipients older than 64: 1,223
- Number of recipients also receiving OASDI: 2,078
- Amount of payments (thousands of dollars): 2,493
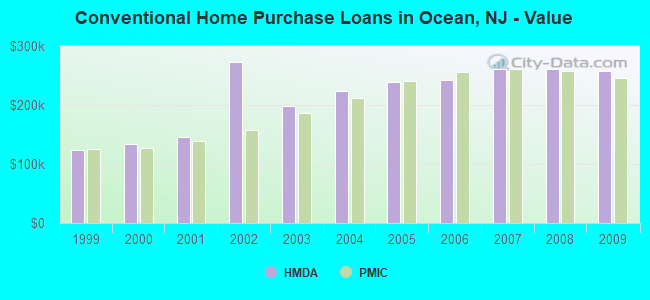
| Home Mortgage Disclosure Act Aggregated Statistics For Year 2009 (Based on 116 full tracts) | ||||||||||||||
| A) FHA, FSA/RHS & VA Home Purchase Loans | B) Conventional Home Purchase Loans | C) Refinancings | D) Home Improvement Loans | E) Loans on Dwellings For 5+ Families | F) Non-occupant Loans on < 5 Family Dwellings (A B C & D) | G) Loans On Manufactured Home Dwelling (A B C & D) | ||||||||
|---|---|---|---|---|---|---|---|---|---|---|---|---|---|---|
| Number | Average Value | Number | Average Value | Number | Average Value | Number | Average Value | Number | Average Value | Number | Average Value | Number | Average Value | |
| LOANS ORIGINATED | 2,075 | $232,844 | 3,348 | $258,309 | 15,970 | $243,325 | 1,047 | $100,709 | 9 | $5,720,667 | 3,467 | $333,065 | 56 | $66,446 |
| APPLICATIONS APPROVED, NOT ACCEPTED | 164 | $211,463 | 342 | $247,585 | 1,333 | $238,409 | 144 | $50,021 | 0 | $0 | 264 | $328,955 | 18 | $46,722 |
| APPLICATIONS DENIED | 370 | $239,346 | 563 | $235,536 | 5,820 | $261,272 | 787 | $60,957 | 3 | $1,540,000 | 944 | $297,892 | 35 | $54,257 |
| APPLICATIONS WITHDRAWN | 218 | $232,881 | 360 | $247,781 | 3,534 | $246,548 | 175 | $105,874 | 0 | $0 | 464 | $293,655 | 6 | $91,000 |
| FILES CLOSED FOR INCOMPLETENESS | 122 | $239,131 | 83 | $261,602 | 929 | $259,941 | 47 | $95,809 | 0 | $0 | 115 | $329,157 | 1 | $60,000 |
| Private Mortgage Insurance Companies Aggregated Statistics For Year 2009 (Based on 108 full tracts) | ||||||
| A) Conventional Home Purchase Loans | B) Refinancings | C) Non-occupant Loans on < 5 Family Dwellings (A & B) | ||||
|---|---|---|---|---|---|---|
| Number | Average Value | Number | Average Value | Number | Average Value | |
| LOANS ORIGINATED | 305 | $245,964 | 159 | $286,849 | 19 | $267,737 |
| APPLICATIONS APPROVED, NOT ACCEPTED | 137 | $273,547 | 98 | $301,337 | 34 | $309,882 |
| APPLICATIONS DENIED | 65 | $267,000 | 74 | $277,338 | 6 | $283,333 |
| APPLICATIONS WITHDRAWN | 19 | $232,632 | 25 | $282,480 | 4 | $249,750 |
| FILES CLOSED FOR INCOMPLETENESS | 18 | $258,778 | 12 | $282,083 | 3 | $234,667 |
| Most common first names in Ocean County, NJ among deceased individuals | ||
| Name | Count | Lived (average) |
|---|---|---|
| John | 6,191 | 75.9 years |
| William | 4,197 | 76.0 years |
| Mary | 4,157 | 81.2 years |
| Joseph | 4,031 | 76.2 years |
| Helen | 2,805 | 81.1 years |
| George | 2,592 | 76.5 years |
| Robert | 2,463 | 72.4 years |
| James | 2,421 | 74.6 years |
| Charles | 2,418 | 76.7 years |
| Margaret | 2,394 | 80.0 years |
| Most common last names in Ocean County, NJ among deceased individuals | ||
| Last name | Count | Lived (average) |
|---|---|---|
| Smith | 1,003 | 77.9 years |
| Johnson | 600 | 76.9 years |
| Miller | 560 | 78.1 years |
| Brown | 457 | 76.7 years |
| Anderson | 314 | 77.4 years |
| Jones | 312 | 75.4 years |
| Williams | 301 | 76.6 years |
| Kelly | 292 | 77.6 years |
| Thompson | 267 | 76.8 years |
| Murphy | 260 | 77.4 years |
| Businesses in Ocean County, NJ | ||||
| Name | Count | Name | Count | |
|---|---|---|---|---|
| 7-Eleven | 23 | KFC | 4 | |
| A&P | 1 | Kmart | 2 | |
| ALDI | 1 | Kohl's | 3 | |
| ALDO | 1 | Kroger | 2 | |
| AT&T | 13 | LA Fitness | 1 | |
| Ace Hardware | 3 | La-Z-Boy | 1 | |
| Advance Auto Parts | 6 | Lane Bryant | 1 | |
| Aeropostale | 2 | Lane Furniture | 5 | |
| Aerosoles | 1 | LensCrafters | 1 | |
| American Eagle Outfitters | 1 | Levi Strauss & Co. | 1 | |
| Ann Taylor | 1 | Little Caesars Pizza | 1 | |
| Applebee's | 4 | Lowe's | 3 | |
| Arby's | 1 | Macy's | 1 | |
| AutoZone | 3 | Marshalls | 1 | |
| Avenue | 1 | MasterBrand Cabinets | 78 | |
| Banana Republic | 1 | McDonald's | 16 | |
| Baskin-Robbins | 11 | Men's Wearhouse | 2 | |
| Bath & Body Works | 1 | Motherhood Maternity | 3 | |
| Bed Bath & Beyond | 2 | New Balance | 3 | |
| Ben & Jerry's | 4 | New York & Co | 1 | |
| Best Western | 1 | Nike | 1 | |
| Blockbuster | 6 | Nissan | 2 | |
| Brooks Brothers | 1 | Old Navy | 1 | |
| Brunswick Bowling & Billiards | 1 | Olive Garden | 2 | |
| Budget Car Rental | 1 | Pac Sun | 2 | |
| Burger King | 12 | Panda Express | 1 | |
| CVS | 13 | Papa John's Pizza | 1 | |
| Casual Male XL | 2 | Pathmark | 1 | |
| Catherines | 1 | Payless | 3 | |
| Charlotte Russe | 2 | Penske | 2 | |
| Cinnabon | 1 | PetSmart | 2 | |
| Circle K | 1 | Pier 1 Imports | 2 | |
| Clarks | 1 | Pizza Hut | 2 | |
| Cold Stone Creamery | 3 | Quality | 2 | |
| Comfort Inn | 2 | RadioShack | 8 | |
| Costco | 1 | Red Lobster | 1 | |
| Curves | 4 | Red Roof Inn | 1 | |
| DHL | 2 | Rite Aid | 25 | |
| Dairy Queen | 5 | Rodeway Inn | 1 | |
| Decora Cabinetry | 22 | Ruby Tuesday | 2 | |
| Domino's Pizza | 6 | SONIC Drive-In | 2 | |
| DressBarn | 2 | Safeway | 1 | |
| Dressbarn | 2 | Sears | 8 | |
| Dunkin Donuts | 32 | Sephora | 1 | |
| Express | 1 | Skechers USA | 1 | |
| Famous Footwear | 3 | Spencer Gifts | 1 | |
| Fashion Bug | 3 | Sprint Nextel | 2 | |
| FedEx | 56 | Staples | 4 | |
| Firestone Complete Auto Care | 1 | Starbucks | 5 | |
| Foot Locker | 1 | Stop & Shop | 6 | |
| Ford | 4 | Subaru | 2 | |
| Forever 21 | 1 | Subway | 14 | |
| GNC | 14 | Superfresh | 1 | |
| GameStop | 3 | T-Mobile | 13 | |
| Gap | 2 | T.G.I. Driday's | 2 | |
| Goodwill | 1 | T.J.Maxx | 2 | |
| Gymboree | 2 | Taco Bell | 3 | |
| H&R Block | 14 | Target | 2 | |
| Hilton | 1 | Toyota | 2 | |
| Holiday Inn | 2 | Toys"R"Us | 4 | |
| Hollister Co. | 1 | True Value | 3 | |
| Home Depot | 4 | U-Haul | 16 | |
| Honda | 1 | UPS | 87 | |
| Hot Topic | 1 | Verizon Wireless | 6 | |
| Hyundai | 2 | Victoria's Secret | 1 | |
| IHOP | 3 | Volkswagen | 1 | |
| IZOD | 1 | Walgreens | 10 | |
| J.Crew | 1 | Walmart | 2 | |
| JCPenney | 1 | Wendy's | 6 | |
| Johnny Rockets | 3 | White Castle | 1 | |
| Journeys | 2 | Wine & Spirits | 1 | |
| Justice | 1 | YMCA | 1 | |
Ocean County on our top lists:
- #10 on the list of "Top 101 counties with the highest percentage of residents that smoked 100+ cigarettes in their lives"
- #12 on the list of "Top 101 counties with the lowest number of infant deaths per 1000 residents 2007-2013 (pop. 50,000+)"
- #16 on the list of "Top 101 counties with the largest increase in the number of births per 1000 residents 2000-2006 to 2007-2013 (pop 50,000+)"
- #21 on the list of "Top 101 counties with the largest number of people without health insurance coverage in 2000 (pop. 50,000+)"
- #23 on the list of "Top 101 counties with the lowest percentage of residents that keep firearms around their homes"
- #27 on the list of "Top 101 counties with the largest decrease in the number of infant deaths per 1000 residents 2000-2006 to 2007-2013 (pop. 50,000+)"
- #41 on the list of "Top 101 counties with the lowest percentage of residents relocating to other counties in 2011 (pop. 50,000+)"
- #44 on the list of "Top 101 counties with the most Other adherents"
- #44 on the list of "Top 101 counties with the most Other adherents (pop. 50,000+)"
- #53 on the list of "Top 101 counties with the most Other congregations (pop. 50,000+)"
- #54 on the list of "Top 101 counties with the highest number of deaths per 1000 residents 2007-2013 (pop. 50,000+)"
- #54 on the list of "Top 101 counties with the highest ground withdrawal of fresh water for public supply"
- #54 on the list of "Top 101 counties with the highest ground withdrawal of fresh water for public supply (pop. 50,000+)"
- #54 on the list of "Top 101 counties with the most Other congregations"
- #60 on the list of "Top 101 counties with the lowest percentage of residents that drank alcohol in the past 30 days"
- #60 on the list of "Top 101 counties with the lowest percentage of residents relocating to other counties in 2011"
- #63 on the list of "Top 101 counties with the highest average weight of females"
- #65 on the list of "Top 101 counties with the lowest percentage of residents relocating from foreign countries between 2010 and 2011 (pop. 50,000+)"
- #73 on the list of "Top 101 counties with the lowest percentage of residents relocating to foreign countries in 2011"
- #76 on the list of "Top 101 counties with the lowest percentage of residents relocating from other counties between 2010 and 2011 (pop. 50,000+)"