Kings County, New York (NY)
County owner-occupied free and clear houses and condos in 2010: 81,991
County owner-occupied houses and condos in 2000: 238,290
Renter-occupied apartments: 662,615 (it was 642,437 in 2000)
| % of renters here: | 73% |
| State: | 47% |
Land area: 71 sq. mi.
Water area: 26.3 sq. mi.
Population density: 36690 people per square mile (very high).
Industries providing employment: Educational, health and social services (27.6%), Professional, scientific, management, administrative, and waste management services (16.8%).
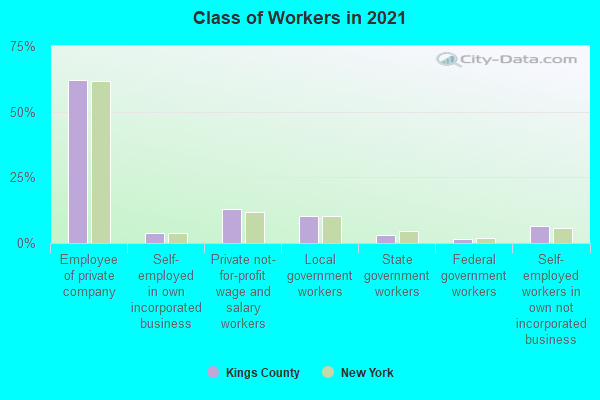
Type of workers:
- Private wage or salary: 80%
- Government: 14%
- Self-employed, not incorporated: 6%
- Unpaid family work: 0%
- OSM Map
- General Map
- Google Map
- MSN Map

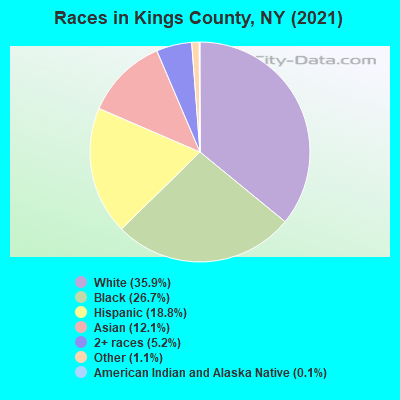
- 925,50035.7%White Non-Hispanic Alone
- 697,51826.9%Black Non-Hispanic Alone
- 489,45118.9%Hispanic or Latino
- 318,56012.3%Asian alone
- 116,5124.5%Two or more races
- 38,2651.5%Some other race alone
- 3,7130.1%American Indian and Alaska Native alone
- 9970.04%Native Hawaiian and Other
Pacific Islander alone
| Median resident age: | 36.6 years |
| New York median age: | 40.0 years |
| Males: 1,235,007 | |
| Females: 1,355,509 |


| Kings County: | 2.0 people |
| New York: | 3 people |
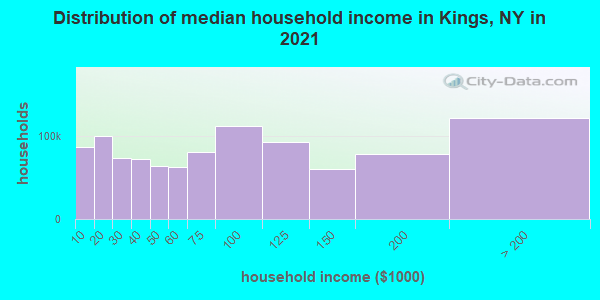
Estimated median household income in 2022: $73,951 ($32,135 in 1999)
| This county: | $73,951 |
| New York: | $79,557 |
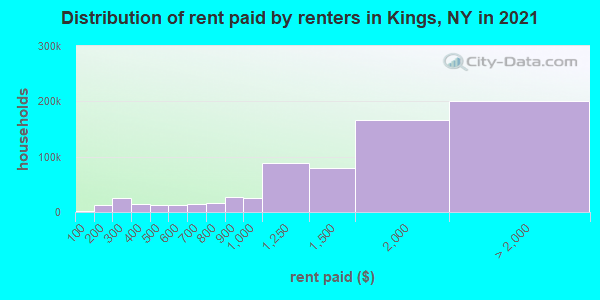
Median contract rent in 2022 for apartments: $1,578 (lower quartile is $1,034, upper quartile is $2,170)
| This county: | $1578 |
| State: | $1354 |
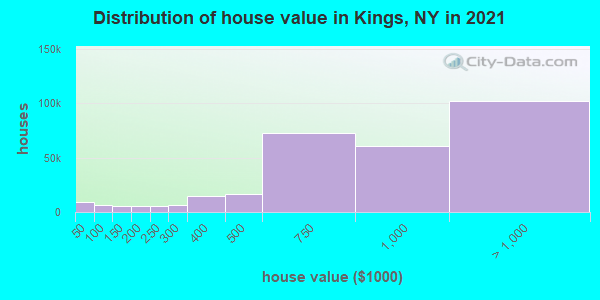
Estimated median house or condo value in 2022: $849,900 (it was $229,200 in 2000)
| Kings: | $849,900 |
| New York: | $400,400 |
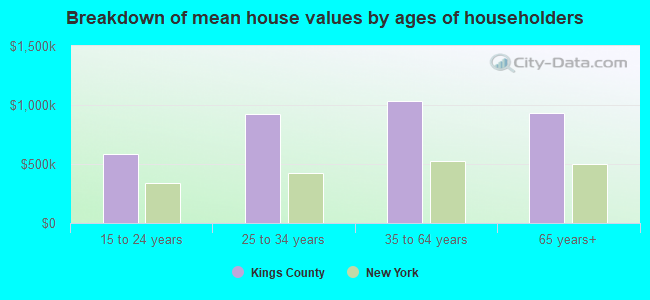
Mean price in 2022:
Median monthly housing costs for homes and condos with a mortgage: $3,225Detached houses: $1,151,492
Here: $1,151,492 State: $476,719 Townhouses or other attached units: $1,083,161
Here: $1,083,161 State: $699,270 In 2-unit structures: $1,088,428
Here: $1,088,428 State: $713,077 In 3-to-4-unit structures: $1,147,254
Here: $1,147,254 State: $764,568 In 5-or-more-unit structures: $853,091
Here: $853,091 State: $912,009 Mobile homes: $492,292
Here: $492,292 State: $88,925
Median monthly housing costs for units without a mortgage: $1,059
Institutionalized population: 13,297
Health of residents in Kings County based on CDC Behavioral Risk Factor Surveillance System Survey Questionnaires from 2003 to 2012:
General health status score of residents in this county from 1 (poor) to 5 (excellent) is 3.4. This is about average.69.9% of residents exercised in the past month. This is less than average.
39.2% of residents smoked 100+ cigarettes in their lives. This is less than average.
71.7% of adult residents drank alcohol in the past 30 days. This is about average.
67.1% of residents visited a dentist within the past year. This is about average.
Average weight of males is 186 pounds. This is less than average.
Average weight of females is 162 pounds. This is about average.
4.0% of residents keep firearms around their homes. This is less than average.
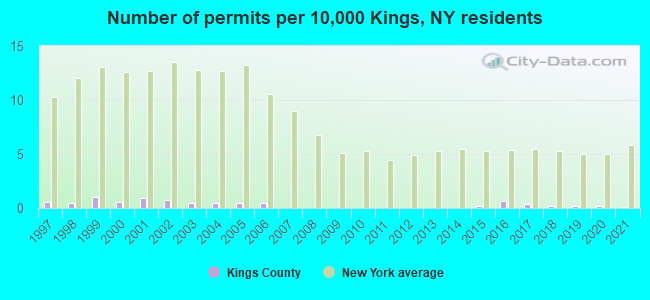
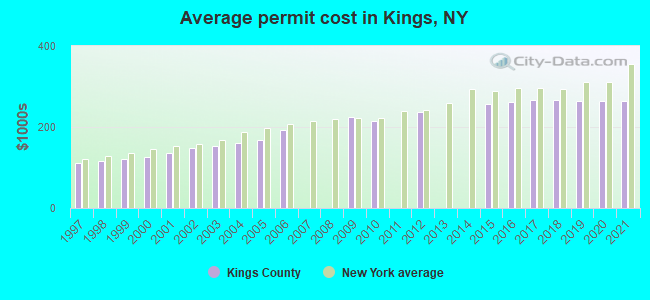
Single-family new house construction building permits:
- 2022: 13 buildings, average cost: $287,600
- 2021: 12 buildings, average cost: $264,200
- 2020: 44 buildings, average cost: $264,300
- 2019: 35 buildings, average cost: $264,200
- 2018: 50 buildings, average cost: $266,800
- 2017: 82 buildings, average cost: $266,100
- 2016: 149 buildings, average cost: $261,400
- 2015: 43 buildings, average cost: $257,200
- 2014: 0 buildings
- 2013: 0 buildings
- 2012: 1 building, cost: $236,600
- 2011: 0 buildings
- 2010: 5 buildings, average cost: $214,600
- 2009: 1 building, cost: $225,300
- 2008: 0 buildings
- 2007: 0 buildings
- 2006: 113 buildings, average cost: $193,100
- 2005: 105 buildings, average cost: $168,200
- 2004: 113 buildings, average cost: $161,100
- 2003: 118 buildings, average cost: $152,800
- 2002: 189 buildings, average cost: $146,900
- 2001: 229 buildings, average cost: $137,000
- 2000: 133 buildings, average cost: $127,000
- 1999: 248 buildings, average cost: $120,100
- 1998: 112 buildings, average cost: $116,000
- 1997: 144 buildings, average cost: $111,900
Median real estate property taxes paid for housing units with mortgages in 2022: $5,860 (0.7%)
Median real estate property taxes paid for housing units with no mortgage in 2022: $6,254 (0.8%)
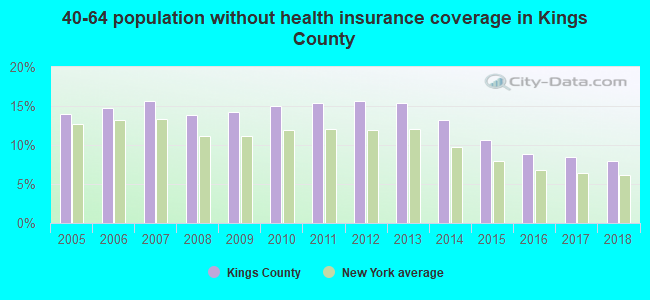
| Kings County: | 19.8% |
| New York: | 14.3% |
Median age of residents in 2022: 36.6 years old
(Males: 35.3 years old, Females: 37.9 years old)
(Median age for: White residents: 36.0 years old, Black residents: 39.2 years old, American Indian residents: 35.8 years old, Asian residents: 38.3 years old, Hispanic or Latino residents: 34.3 years old, Other race residents: 34.5 years old)
Area name: New York-Monmouth-Ocean, NY-NJ HUD Metro FMR Area
Fair market rent in 2006 for a 1-bedroom apartment in Kings County is $1003 a month.
Fair market rent for a 2-bedroom apartment is $1133 a month.
Fair market rent for a 3-bedroom apartment is $1406 a month.
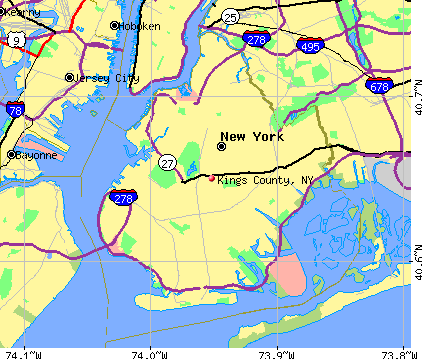
Cities in this county include: Brooklyn.
2023 air pollution in Kings County:
Particulate Matter (PM2.5) Annual: 10.6 µg/m3(standard limit: 15.0 µg/m3). Near U.S. average.
Neighboring counties: Bronx County  , Blackford County, Indiana
  , Indiana County, Pennsylvania , Howard County, Indiana , Harrison County, Ohio .
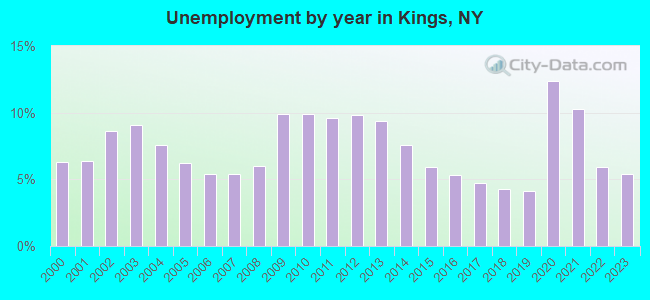
| Here: | 5.4% |
| New York: | 4.4% |
Current college students: 174,210
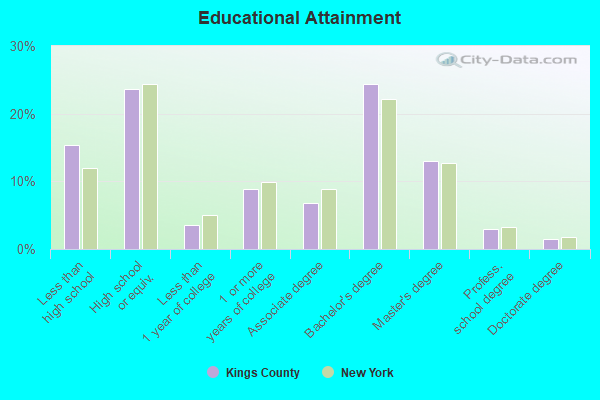
People 25 years of age or older with a high school degree or higher: 83.9%
People 25 years of age or older with a bachelor's degree or higher: 42.4%
Number of foreign born residents: 907,780 (63.3% naturalized citizens)
| Kings County: | 35.0% |
| Whole state: | 22.7% |
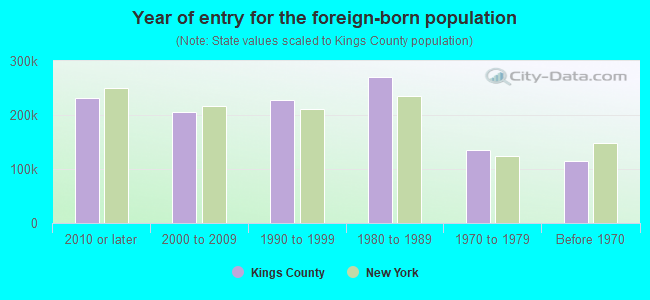
- Year of entry for the foreign-born population
- 249,2192010 or later
- 192,9662000 to 2009
- 203,8371990 to 1999
- 270,3821980 to 1989
- 135,6561970 to 1979
- 114,628Before 1970
Mean travel time to work (commute): ) minutes
Percentage of county residents living and working in this county: 97.9%


Housing units in structures:
- One, detached: 49,541
- One, attached: 89,960
- Two: 181,164
- 3 or 4: 171,372
- 5 to 9: 112,608
- 10 to 19: 71,371
- 20 to 49: 161,978
- 50 or more: 260,566
- Mobile homes: 2,454
- Boats, RVs, vans, etc.: 415
Housing units in Kings County with a mortgage: 176,181 (15,012 second mortgage, 989 home equity loan, 11,572 both second mortgage and home equity loan)
Houses without a mortgage: 5,368
| Here: | 97.2% with mortgage |
| State: | 95.5% with mortgage |
Religion statistics for Kings County
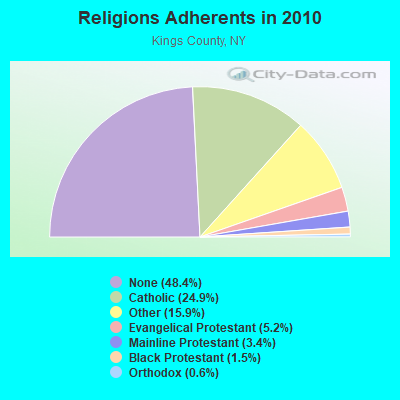
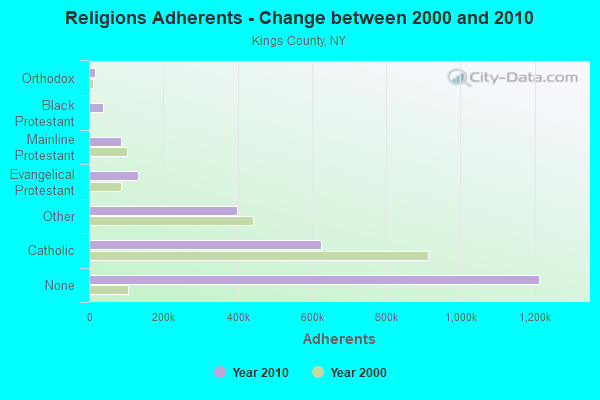
| Religion | Adherents | Congregations |
|---|---|---|
| Catholic | 623,796 | 108 |
| Other | 397,277 | 471 |
| Evangelical Protestant | 131,374 | 499 |
| Mainline Protestant | 85,439 | 226 |
| Black Protestant | 38,019 | 106 |
| Orthodox | 15,945 | 16 |
| None | 1,212,850 | - |
Source: Clifford Grammich, Kirk Hadaway, Richard Houseal, Dale E.Jones, Alexei Krindatch, Richie Stanley and Richard H.Taylor. 2012. 2010 U.S.Religion Census: Religious Congregations & Membership Study. Association of Statisticians of American Religious Bodies. Jones, Dale E., et al. 2002. Congregations and Membership in the United States 2000. Nashville, TN: Glenmary Research Center.
Food Environment Statistics:
| Kings County: | 5.79 / 10,000 pop. |
| State: | 4.13 / 10,000 pop. |
| Here: | 0.01 / 10,000 pop. |
| New York: | 0.06 / 10,000 pop. |
| This county: | 0.55 / 10,000 pop. |
| New York: | 0.92 / 10,000 pop. |
| Kings County: | 0.27 / 10,000 pop. |
| New York: | 1.68 / 10,000 pop. |
| This county: | 5.03 / 10,000 pop. |
| State: | 8.82 / 10,000 pop. |
| Kings County: | 8.5% |
| New York: | 8.2% |
| Kings County: | 24.7% |
| State: | 23.8% |
| Here: | 13.0% |
| State: | 15.6% |
Agriculture in Kings County:
The percentage of farms operated by a family or individual: 100.00%Earthquake activity:
Kings County-area historical earthquake activity is significantly above New York state average. It is 69% smaller than the overall U.S. average.On 8/23/2011 at 17:51:04, a magnitude 5.8 (5.8 MW, Depth: 3.7 mi, Class: Moderate, Intensity: VI - VII) earthquake occurred 285.3 miles away from Kings County center
On 10/7/1983 at 10:18:46, a magnitude 5.3 (5.1 MB, 5.3 LG, 5.1 ML) earthquake occurred 229.3 miles away from the county center
On 1/16/1994 at 01:49:16, a magnitude 4.6 (4.6 MB, 4.6 LG, Depth: 3.1 mi, Class: Light, Intensity: IV - V) earthquake occurred 111.9 miles away from the county center
On 4/20/2002 at 10:50:47, a magnitude 5.3 (5.3 ML, Depth: 3.0 mi) earthquake occurred 267.5 miles away from the county center
On 4/20/2002 at 10:50:47, a magnitude 5.2 (5.2 MB, 4.2 MS, 5.2 MW, 5.0 MW) earthquake occurred 265.7 miles away from Kings County center
On 8/22/1992 at 12:20:32, a magnitude 4.8 (4.8 MB, 3.8 MS, 4.7 LG, Depth: 6.2 mi) earthquake occurred 220.4 miles away from the county center
Magnitude types: regional Lg-wave magnitude (LG), body-wave magnitude (MB), local magnitude (ML), surface-wave magnitude (MS), moment magnitude (MW)
Most recent natural disasters:
- New York Covid-19 Pandemic, Incident Period: January 20, 2020, Major Disaster (Presidential) Declared DR-4480-NY: March 20, 2020, FEMA Id: 4480, Natural disaster type: Other
- New York Hurricane Sandy, Incident Period: October 27, 2012 to November 09, 2012, Emergency Declared EM-3351: October 28, 2012, FEMA Id: 3351, Natural disaster type: Hurricane
- New York Hurricane Sandy, Incident Period: October 27, 2012 to November 09, 2012, Major Disaster (Presidential) Declared DR-4085: October 30, 2012, FEMA Id: 4085, Natural disaster type: Hurricane
- New York Hurricane Irene, Incident Period: August 26, 2011 to September 05, 2011, Major Disaster (Presidential) Declared DR-4020: August 31, 2011, FEMA Id: 4020, Natural disaster type: Hurricane
- New York Hurricane Irene, Incident Period: August 25, 2011 to September 05, 2011, Emergency Declared EM-3328: August 26, 2011, FEMA Id: 3328, Natural disaster type: Hurricane
- New York Severe Storms, Tornadoes, and Straight-line Winds, Incident Period: September 16, 2010, Major Disaster (Presidential) Declared DR-1943: October 14, 2010, FEMA Id: 1943, Natural disaster type: Storm, Tornado, Wind
- New York Severe Storms, Flooding, and Tornado, Incident Period: August 08, 2007, Major Disaster (Presidential) Declared DR-1724: August 31, 2007, FEMA Id: 1724, Natural disaster type: Storm, Tornado, Flood
- New York Hurricane Katrina Evacuation, Incident Period: August 29, 2005 to October 01, 2005, Emergency Declared EM-3262: September 30, 2005, FEMA Id: 3262, Natural disaster type: Hurricane
- New York Power Outage, Incident Period: August 14, 2003 to August 16, 2003, Emergency Declared EM-3186: August 23, 2003, FEMA Id: 3186, Natural disaster type: Power Outage
- New York Snowstorm, Incident Period: February 17, 2003 to February 18, 2003, Emergency Declared EM-3184: March 27, 2003, FEMA Id: 3184, Natural disaster type: Snowstorm
- 7 other natural disasters have been reported since 1953.
The number of natural disasters in Kings County (17) is near the US average (15).
Major Disasters (Presidential) Declared: 10
Emergencies Declared: 7
Causes of natural disasters: Hurricanes: 5, Storms: 4, Floods: 3, Blizzards: 2, Tornadoes: 2, Power Outage: 1, Snowstorm: 1, Water Shortage: 1, Wind: 1, Other: 3 (Note: some incidents may be assigned to more than one category).
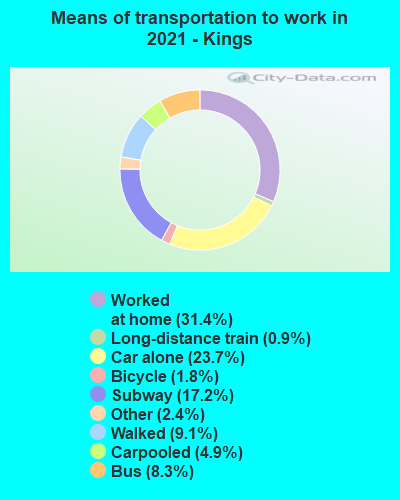
Means of transportation to work:
- Drove a car alone: 276,526 (27.1%)
- Carpooled: 53,537 (5.3%)
- Bus: 89,839 (8.8%)
- Subway or elevated rail: 199,645 (19.6%)
- Long-distance train or commuter rail: 13,781 (1.4%)
- Light rail, streetcar or trolley: 2,284 (0.2%)
- Ferryboat: 2,454 (0.2%)
- Taxicab, motorcycle, or other means: 26,985 (2.6%)
- Bicycle: 23,088 (2.3%)
- Walked: 102,012 (10.0%)
- Worked at home: 229,179 (22.5%)
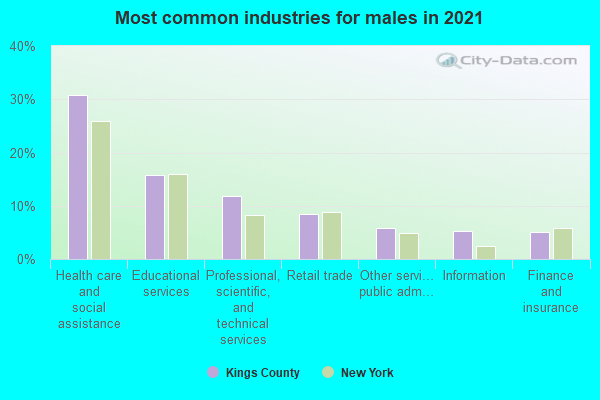
- Health care and social assistance (28%)
- Educational services (13%)
- Professional, scientific, and technical services (12%)
- Retail trade (9%)
- Other services, except public administration (7%)
- Accommodation and food services (5%)
- Finance and insurance (5%)

- Health care and social assistance (28%)
- Educational services (13%)
- Professional, scientific, and technical services (12%)
- Retail trade (9%)
- Other services, except public administration (7%)
- Accommodation and food services (5%)
- Finance and insurance (5%)
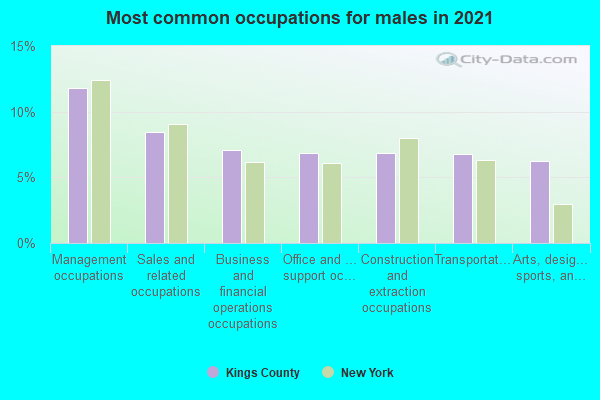
- Management occupations (12%)
- Sales and related occupations (8%)
- Transportation occupations (8%)
- Computer and mathematical occupations (7%)
- Construction and extraction occupations (7%)
- Office and administrative support occupations (7%)
- Arts, design, entertainment, sports, and media occupations (7%)
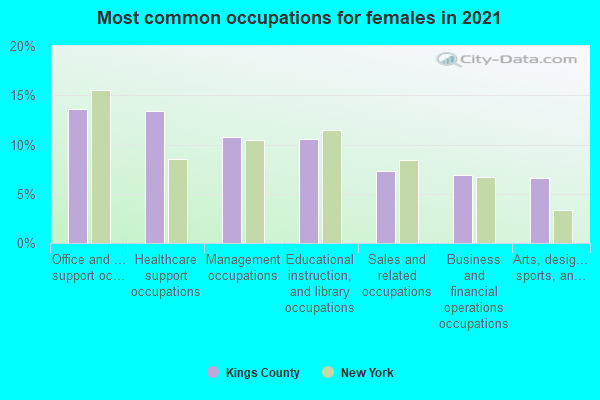
- Office and administrative support occupations (14%)
- Healthcare support occupations (12%)
- Management occupations (11%)
- Educational instruction, and library occupations (10%)
- Business and financial operations occupations (7%)
- Sales and related occupations (7%)
- Arts, design, entertainment, sports, and media occupations (7%)
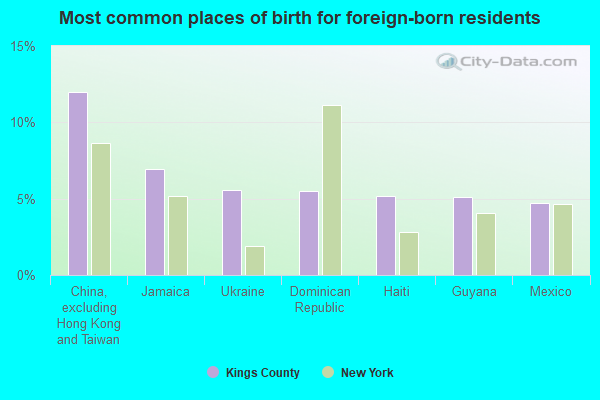
- China, excluding Hong Kong and Taiwan (13%)
- Jamaica (6%)
- Dominican Republic (6%)
- Haiti (5%)
- Ukraine (5%)
- Guyana (5%)
- Mexico (4%)
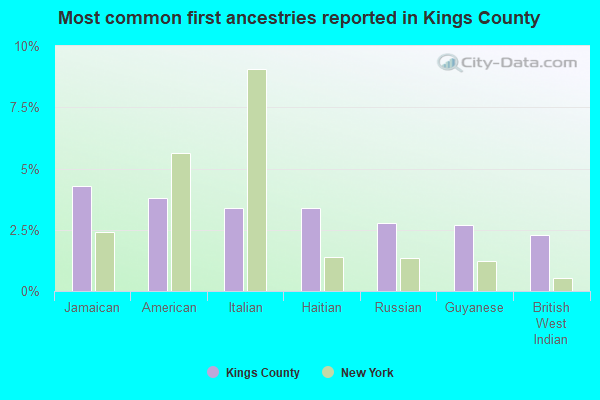
- American (4%)
- Haitian (4%)
- Jamaican (4%)
- Italian (3%)
- Trinidadian and Tobagonian (2%)
- Ukrainian (2%)
- Guyanese (2%)

People in group quarters in Kings County, New York in 2010:
- 9,461 people in nursing facilities/skilled-nursing facilities
- 8,409 people in emergency and transitional shelters (with sleeping facilities) for people experiencing homelessness
- 4,527 people in college/university student housing
- 4,252 people in other noninstitutional facilities
- 3,096 people in group homes intended for adults
- 2,089 people in federal detention centers
- 1,637 people in residential treatment centers for adults
- 972 people in mental (psychiatric) hospitals and psychiatric units in other hospitals
- 378 people in workers' group living quarters and job corps centers
- 222 people in group homes for juveniles (non-correctional)
- 136 people in state prisons
- 120 people in correctional residential facilities
- 118 people in correctional facilities intended for juveniles
- 70 people in hospitals with patients who have no usual home elsewhere
- 69 people in residential schools for people with disabilities
- 32 people in residential treatment centers for juveniles (non-correctional)
- 13 people in military barracks and dormitories (nondisciplinary)
- 8 people in local jails and other municipal confinement facilities
People in group quarters in Kings County, New York in 2000:
- 10,577 people in other noninstitutional group quarters
- 9,594 people in nursing homes
- 3,654 people in religious group quarters
- 2,931 people in college dormitories (includes college quarters off campus)
- 1,708 people in other group homes
- 1,655 people in homes for the mentally retarded
- 1,421 people in federal prisons and detention centers
- 1,303 people in homes for the mentally ill
- 1,237 people in hospitals/wards and hospices for chronically ill
- 1,237 people in other hospitals or wards for chronically ill
- 1,029 people in mental (psychiatric) hospitals or wards
- 1,016 people in other nonhousehold living situations
- 796 people in local jails and other confinement facilities (including police lockups)
- 670 people in hospitals or wards for drug/alcohol abuse
- 561 people in homes or halfway houses for drug/alcohol abuse
- 294 people in schools, hospitals, or wards for the intellectually disabled
- 230 people in wards in general hospitals for patients who have no usual home elsewhere
- 154 people in homes for the physically handicapped
- 142 people in training schools for juvenile delinquents
- 99 people in military barracks, etc.
- 66 people in unknown juvenile institutions
- 62 people in homes for abused, dependent, and neglected children
- 50 people in agriculture workers' dormitories on farms
- 40 people in other types of correctional institutions
- 9 people in job corps and vocational training facilities
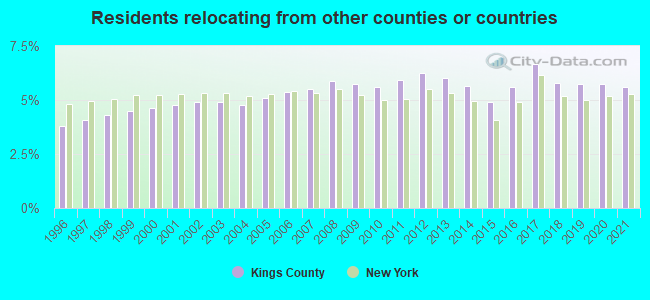
5.58% of this county's 2021 resident taxpayers lived in other counties in 2020 ($85,156 average adjusted gross income)
| Here: | 5.58% |
| New York average: | 5.29% |
0.01% of residents moved from foreign countries ($71 average AGI)
Kings County: 0.01% New York average: 0.01%
3.36% relocated from other counties in New York ($53,782 average AGI)
2.22% relocated from other states ($31,302 average AGI)
Kings County: 2.22% New York average: 1.86%
Top counties from which taxpayers relocated into this county between 2020 and 2021:
| from New York County, NY | |
| from Queens County, NY | |
| from Bronx County, NY | |
| from Richmond County, NY | |
| from Nassau County, NY | |
| from Suffolk County, NY | |
| from Los Angeles County, CA |
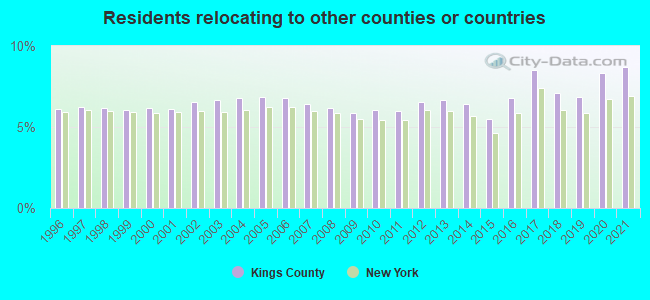
8.71% of this county's 2020 resident taxpayers moved to other counties in 2021 ($91,142 average adjusted gross income)
| Here: | 8.71% |
| New York average: | 6.93% |
0.02% of residents moved to foreign countries ($119 average AGI)
Kings County: 0.02% New York average: 0.02%
4.09% relocated to other counties in New York ($39,465 average AGI)
4.60% relocated to other states ($51,557 average AGI)
Kings County: 4.60% New York average: 3.55%
Top counties to which taxpayers relocated from this county between 2020 and 2021:
| to Queens County, NY | |
| to New York County, NY | |
| to Richmond County, NY | |
| to Nassau County, NY | |
| to Hudson County, NJ | |
| to Los Angeles County, CA | |
| to Bronx County, NY |
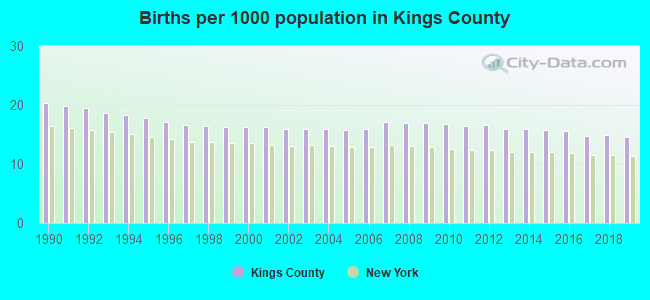
Births per 1000 population from 1990 to 1999: 18.1
Births per 1000 population from 2000 to 2009: 16.3
Births per 1000 population from 2010 to 2022: 13.1
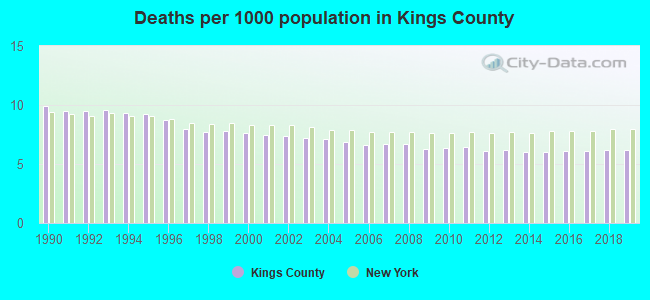
Deaths per 1000 population from 1990 to 1999: 8.9
Deaths per 1000 population from 2000 to 2009: 7.0
Deaths per 1000 population from 2010 to 2020: 6.5
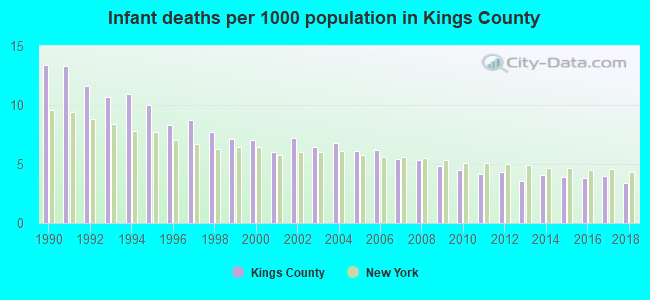
Infant deaths per 1000 live births from 1990 to 1999: 10.2
Infant deaths per 1000 live births from 2000 to 2009: 6.1
Infant deaths per 1000 live births from 2010 to 2021: 3.8
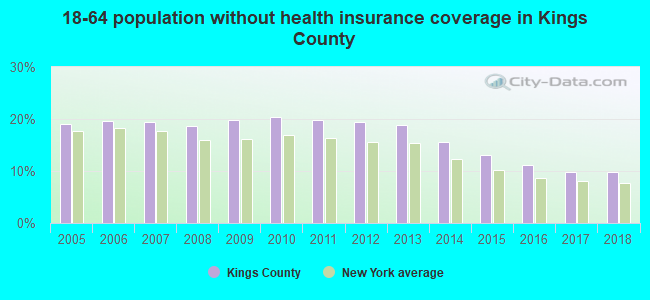
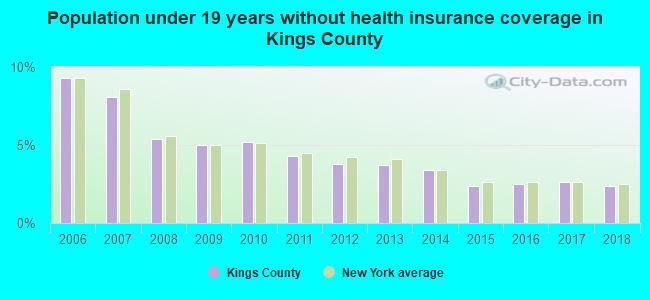
Persons under 19 years old without health insurance coverage in 2018: 2.4%


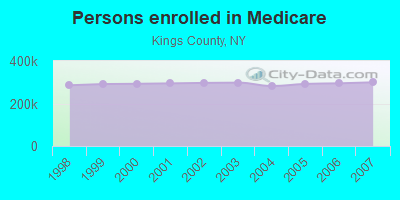
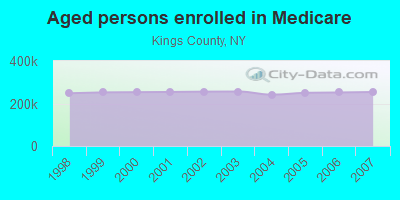
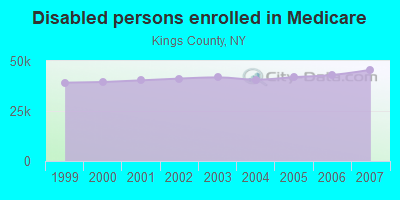
Persons enrolled in hospital insurance and/or supplemental medical insurance (Medicare) in July 1, 2007: 299,652 (254,029 aged, 45,623 disabled)
Children under 18 without health insurance coverage in 2007: 62,283 (10%)
Most common underlying causes of death in Kings County, New York in 1999 - 2019:
- Atherosclerotic heart disease (75,186)
- Acute myocardial infarction, unspecified (20,164)
- Bronchus or lung, unspecified - Malignant neoplasms (16,427)
- Atherosclerotic cardiovascular disease, so described (15,081)
- Hypertensive heart disease without (congestive) heart failure (8,721)
- Unspecified diabetes mellitus, without complications (7,994)
- Colon, unspecified - Malignant neoplasms (7,409)
- Breast, unspecified - Malignant neoplasms (7,365)
- Pneumonia, unspecified (7,322)
- Chronic obstructive pulmonary disease, unspecified (6,250)
Population without health insurance coverage in 2000: 21%
Children under 18 without health insurance coverage in 2000: 14%
Short term general hospital admissions per 100,000 population in 2004: 11,707
Short term general hospital beds per 100,000 population in 2004: 320
Emergency room visits per 100,000 population in 2004: 34,718
General practice office based MDs per 100,000 population in 2005: 1,613
Medical specialist MDs per 100,000 population in 2005: 729
Dentists per 100,000 population in 1998: 10
Total births per 100,000 population, July 2005 - July 2006 : 45
Total deaths per 100,000 population, July 2005 - July 2006: 60
Limited-service eating places per 100,000 population in 2005 : 5
Beer, wine & liquor stores per 100,000 population in 2005: 1
Fitness & recreation sports centers per 100,000 population in 2005: 5,219
EPA green book nonattainment status in 2004-2006: 1
Crimes per 100,000 population in 1996: 1
Suicides per 1,000,000 population from 2000 to 2006: 45.3. This is less than state average.
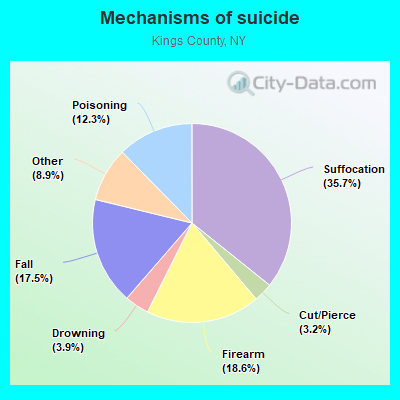
- Suffocation - 16.2
- Firearm - 8.4
- Fall - 7.9
- Poisoning - 5.6
- Drowning - 1.8
- Cut/Pierce - 1.4
- Other - 4.0
Household type by relationship:
Households: 2,590,516- Male householders: 460,926 (132,942 living alone), Female householders: 565,435 (194,025 living alone)
361,360 spouses (352,189 opposite-sex spouses), 85,639 unmarried partners, (77,273 opposite-sex unmarried partners), 730,779 children (709,327 natural, 8,581 adopted, 12,871 stepchildren), 72,708 grandchildren, 35,925 brothers or sisters, 51,916 parents, 3,823 foster children, 60,159 other relatives, 117,800 non-relatives
- In group quarters: 44,046
Size of family households: 223,420 2-persons, 141,983 3-persons, 110,738 4-persons, 55,495 5-persons, 26,134 6-persons, 26,690 7-or-more-persons.
Size of nonfamily households: 326,967 1-person, 89,353 2-persons, 18,263 3-persons, 4,716 4-persons, 1,835 5-persons, 238 6-persons, 529 7-or-more-persons.
330,790 married couples with children.
151,965 single-parent households (28,638 men, 123,327 women).
55.8% of residents of Kings speak English at home.
14.6% of residents speak Spanish at home (51% speak English very well, 22% speak English well, 18% speak English not well, 9% don't speak English at all).
17.4% of residents speak other Indo-European language at home (51% speak English very well, 31% speak English well, 16% speak English not well, 3% don't speak English at all).
8.4% of residents speak Asian or Pacific Island language at home (34% speak English very well, 22% speak English well, 29% speak English not well, 15% don't speak English at all).
3.7% of residents speak other language at home (64% speak English very well, 23% speak English well, 10% speak English not well, 2% don't speak English at all).
In fiscal year 2004:
Federal Government expenditure: $63,702,634,000 ($25,735 per capita)
Department of Defense expenditure: $631,446,000
Federal direct payments to individuals for retirement and disability: $13,978,169,000
Federal other direct payments to individuals: $13,544,166,000
Federal direct payments not to individuals: $850,407,000
Federal grants: $29,543,211,000
Federal procurement contracts: $2,016,467,000 ($265,410,000 Department of Defense)
Federal salaries and wages: $3,770,214,000 ($240,556,000 Department of Defense)
Federal Government direct loans: $388,518,000
Federal guaranteed/insured loans: $2,554,862,000
Federal Government insurance: $2,808,191,000
Population change from April 1, 2000 to July 1, 2005:
Births: 214,175| Here: | 86 per 1000 residents |
| State: | 70 per 1000 residents |
Deaths: 94,944
| Here: | 38 per 1000 residents |
| State: | 42 per 1000 residents |
Net international migration: +159,862
| Here: | +64 per 1000 residents |
| State: | +35 per 1000 residents |
Net internal migration: -291,748
| Here: | |
| State: |
Total withdrawal of fresh water for public supply: 0.00 millions of gallons per day (all from surface)
| Here: | 5.1 |
| State: | 6.3 |
| Here: | 3.6 |
| State: | 3.8 |
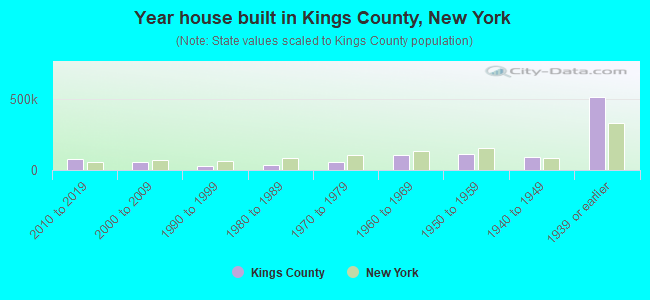
- Year house built in Kings County, New York
- 12,5462020 or later
- 87,4882010 to 2019
- 57,4222000 to 2009
- 29,0461990 to 1999
- 32,0251980 to 1989
- 59,3161970 to 1979
- 105,6621960 to 1969
- 118,5781950 to 1959
- 101,9451940 to 1949
- 497,4011939 or earlier
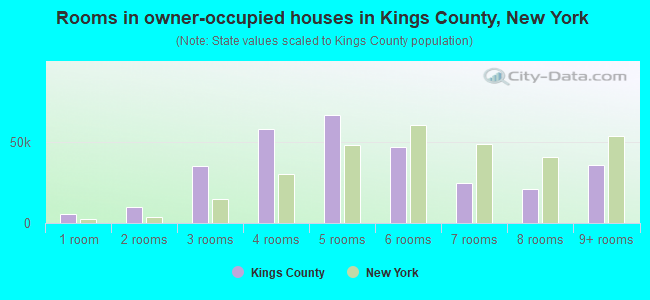
- Rooms in owner-occupied houses in Kings County, New York
- 10,1571 room
- 9,3502 rooms
- 40,7003 rooms
- 57,2044 rooms
- 59,3275 rooms
- 49,9666 rooms
- 23,9797 rooms
- 17,1358 rooms
- 34,5439+ rooms

- Rooms in renter-occupied apartments in Kings County, New York
- 77,9961 room
- 68,3222 rooms
- 200,1753 rooms
- 206,2684 rooms
- 106,3075 rooms
- 42,5046 rooms
- 11,0497 rooms
- 5,3468 rooms
- 6,0339+ rooms
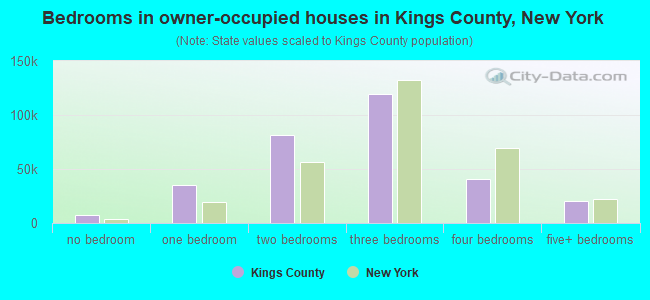
- Bedrooms in owner-occupied houses in Kings County, New York
- 11,295no bedroom
- 35,6771 bedroom
- 88,6402 bedrooms
- 110,5033 bedrooms
- 36,5424 bedrooms
- 19,7045+ bedrooms
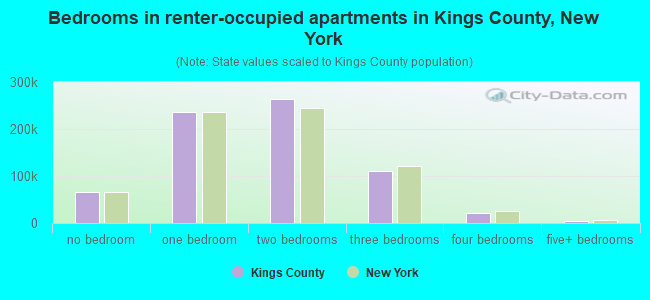
- Bedrooms in renter-occupied apartments in Kings County, New York
- 84,101no bedroom
- 238,6751 bedroom
- 256,2142 bedrooms
- 119,2083 bedrooms
- 21,6834 bedrooms
- 4,1195+ bedrooms
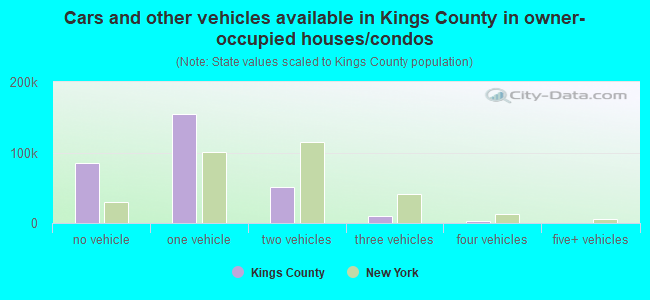
- Cars and other vehicles available in Kings County in owner-occupied houses/condos
- 88,637no vehicle
- 153,5191 vehicle
- 47,5792 vehicles
- 9,7143 vehicles
- 2,0624 vehicles
- 8505+ vehicles
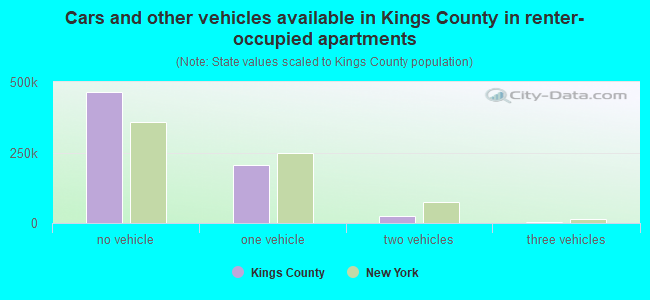
- Cars and other vehicles available in Kings County in renter-occupied apartments
- 477,435no vehicle
- 218,1451 vehicle
- 24,6472 vehicles
- 3,0543 vehicles
- 5414 vehicles
- 1785+ vehicles
89.1% of Kings County residents lived in the same house 1 years ago.
Out of people who lived in different houses, 36% lived in this county.
Out of people who lived in different counties, 30% lived in New York.
| Kings County: | 89.1% |
| State average: | 89.6% |
Place of birth for U.S.-born residents:
- This state: 1,262,988
- Other state: 335,454
- Northeast: 97,829
- Midwest: 59,053
- South: 123,868
- West: 54,704
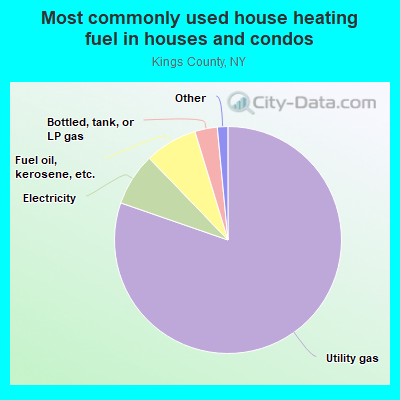
- 80.5%Utility gas
- 8.4%Electricity
- 6.2%Fuel oil, kerosene, etc.
- 3.0%Bottled, tank, or LP gas
- 1.1%No fuel used
- 0.6%Other fuel
- 0.2%Solar energy
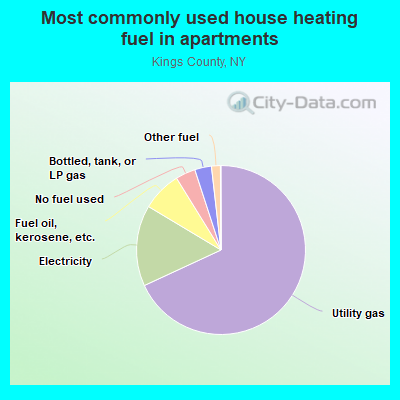
- 68.3%Utility gas
- 17.1%Electricity
- 6.3%Fuel oil, kerosene, etc.
- 3.3%No fuel used
- 2.8%Bottled, tank, or LP gas
- 2.0%Other fuel
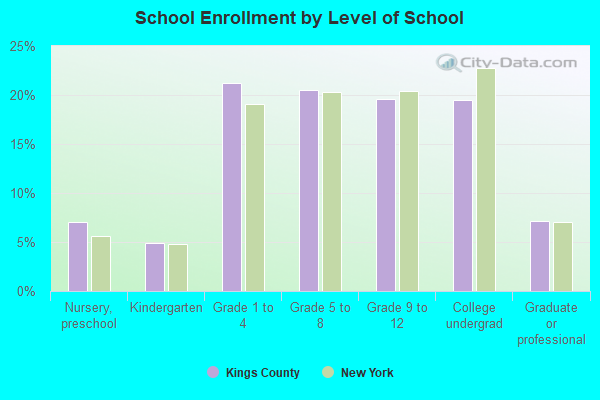
Private vs. public school enrollment:
| Here: | 27.6% |
| New York: | 15.6% |
| Here: | 24.7% |
| New York: | 15.0% |
| Here: | 38.0% |
| New York: | 39.2% |
Supplemental Security Income (SSI) in 2006:
- Total number of recipients: 141,929
- Number of aged recipients: 39,937
- Number of blind and disabled recipients: 101,992
- Number of recipients under 18: 13,727
- Number of recipients between 18 and 64: 60,297
- Number of recipients older than 64: 67,905
- Number of recipients also receiving OASDI: 35,710
- Amount of payments (thousands of dollars): 75,429
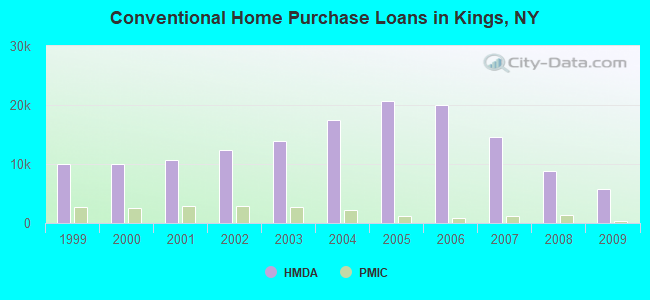
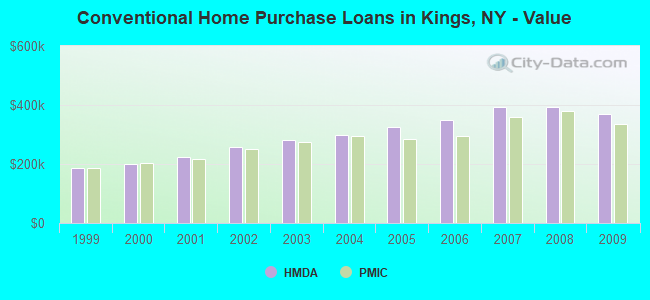
| Home Mortgage Disclosure Act Aggregated Statistics For Year 2009 (Based on 764 full tracts) | ||||||||||||||
| A) FHA, FSA/RHS & VA Home Purchase Loans | B) Conventional Home Purchase Loans | C) Refinancings | D) Home Improvement Loans | E) Loans on Dwellings For 5+ Families | F) Non-occupant Loans on < 5 Family Dwellings (A B C & D) | G) Loans On Manufactured Home Dwelling (A B C & D) | ||||||||
|---|---|---|---|---|---|---|---|---|---|---|---|---|---|---|
| Number | Average Value | Number | Average Value | Number | Average Value | Number | Average Value | Number | Average Value | Number | Average Value | Number | Average Value | |
| LOANS ORIGINATED | 918 | $453,983 | 5,698 | $371,144 | 8,413 | $339,326 | 427 | $197,923 | 592 | $1,410,167 | 874 | $396,197 | 48 | $404,958 |
| APPLICATIONS APPROVED, NOT ACCEPTED | 98 | $468,969 | 813 | $413,335 | 1,530 | $371,851 | 134 | $98,687 | 53 | $1,359,094 | 139 | $390,576 | 3 | $317,000 |
| APPLICATIONS DENIED | 561 | $486,041 | 2,249 | $381,674 | 6,909 | $378,949 | 1,064 | $109,042 | 157 | $1,197,822 | 920 | $322,634 | 22 | $84,364 |
| APPLICATIONS WITHDRAWN | 399 | $466,880 | 934 | $411,171 | 2,995 | $370,550 | 180 | $250,483 | 130 | $1,751,877 | 299 | $363,913 | 3 | $455,667 |
| FILES CLOSED FOR INCOMPLETENESS | 140 | $477,336 | 428 | $391,827 | 1,411 | $370,189 | 82 | $197,012 | 9 | $2,131,889 | 119 | $398,513 | 1 | $330,000 |
| Private Mortgage Insurance Companies Aggregated Statistics For Year 2009 (Based on 404 full tracts) | ||||||
| A) Conventional Home Purchase Loans | B) Refinancings | C) Non-occupant Loans on < 5 Family Dwellings (A & B) | ||||
|---|---|---|---|---|---|---|
| Number | Average Value | Number | Average Value | Number | Average Value | |
| LOANS ORIGINATED | 403 | $334,980 | 77 | $332,753 | 2 | $293,000 |
| APPLICATIONS APPROVED, NOT ACCEPTED | 306 | $379,000 | 51 | $406,667 | 2 | $359,500 |
| APPLICATIONS DENIED | 210 | $364,152 | 86 | $378,291 | 0 | $0 |
| APPLICATIONS WITHDRAWN | 97 | $339,371 | 24 | $360,958 | 1 | $360,000 |
| FILES CLOSED FOR INCOMPLETENESS | 50 | $407,460 | 6 | $462,000 | 0 | $0 |
Kings County on our top lists:
- #3 on the list of "Top 101 counties with the lowest percentage of residents that keep firearms around their homes"
- #4 on the list of "Top 101 counties with the most Other adherents (pop. 50,000+)"
- #4 on the list of "Top 101 counties with the most Other adherents"
- #6 on the list of "Top 101 counties with the most Other congregations (pop. 50,000+)"
- #6 on the list of "Top 101 counties with the most Other congregations"
- #10 on the list of "Top 101 counties with the most Orthodox adherents"
- #10 on the list of "Top 101 counties with the most Orthodox adherents (pop. 50,000+)"
- #10 on the list of "Top 101 counties with the most Catholic adherents"
- #10 on the list of "Top 101 counties with the most Catholic adherents (pop. 50,000+)"
- #11 on the list of "Top 101 counties with the largest increase in the number of births per 1000 residents 2000-2006 to 2007-2013 (pop 50,000+)"
- #12 on the list of "Top 101 counties with the most Catholic congregations"
- #12 on the list of "Top 101 counties with the most Catholic congregations (pop. 50,000+)"
- #12 on the list of "Top 101 counties with the most Black Protestant congregations (pop. 50,000+)"
- #12 on the list of "Top 101 counties with the most Black Protestant congregations"
- #14 on the list of "Top 101 counties with highest percentage of residents voting for Obama (Democrat) in the 2012 Presidential Election (pop. 50,000+)"
- #14 on the list of "Top 101 counties with the most Mainline Protestant congregations"
- #14 on the list of "Top 101 counties with the most Mainline Protestant congregations (pop. 50,000+)"
- #21 on the list of "Top 101 counties with the most Black Protestant adherents"
- #21 on the list of "Top 101 counties with the most Black Protestant adherents (pop. 50,000+)"
- #22 on the list of "Top 101 counties with the most Mainline Protestant adherents"