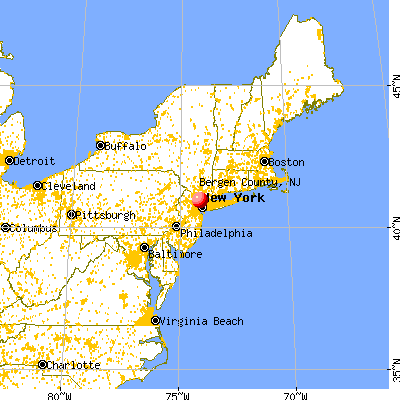
Bergen County, New Jersey (NJ)
County owner-occupied free and clear houses and condos in 2010: 67,349
County owner-occupied houses and condos in 2000: 222,237
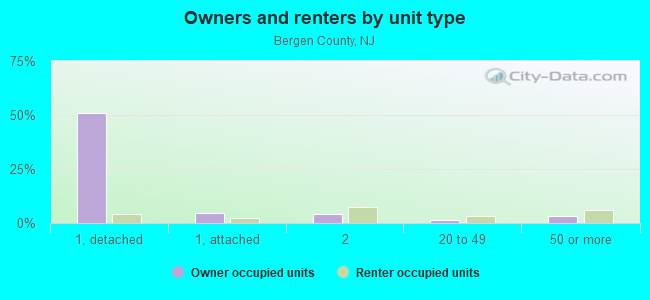
Renter-occupied apartments: 113,764 (it was 108,580 in 2000)
| % of renters here: | 33% |
| State: | 35% |
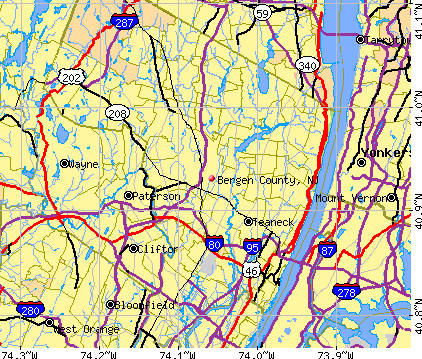
Land area: 234 sq. mi.
Water area: 12.6 sq. mi.
Population density: 4070 people per square mile (very high).
Industries providing employment: Educational, health and social services (25.6%), Professional, scientific, management, administrative, and waste management services (16.3%), Retail trade (10.2%).
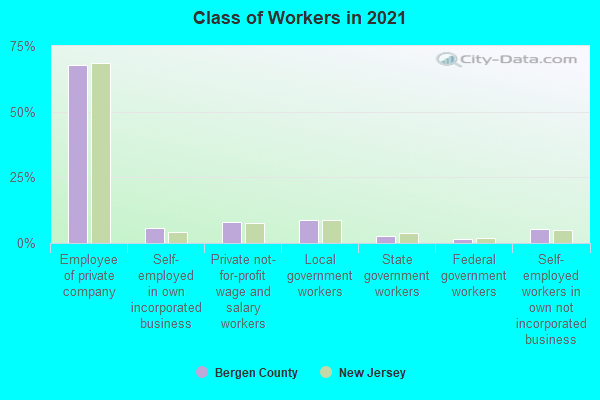
Type of workers:
- Private wage or salary: 82%
- Government: 13%
- Self-employed, not incorporated: 6%
- Unpaid family work: 0%
- OSM Map
- General Map
- Google Map
- MSN Map

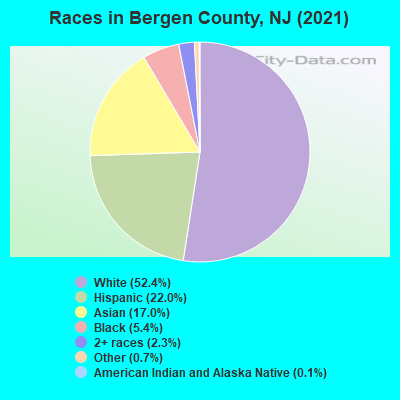
- 488,63651.3%White Non-Hispanic Alone
- 216,15022.7%Hispanic or Latino
- 156,55316.4%Asian alone
- 49,6435.2%Black Non-Hispanic Alone
- 29,1173.1%Two or more races
- 12,2601.3%Some other race alone
- 3510.04%American Indian and Alaska Native alone
- 2870.03%Native Hawaiian and Other
Pacific Islander alone
| Median resident age: | 42.2 years |
| New Jersey median age: | 40.4 years |
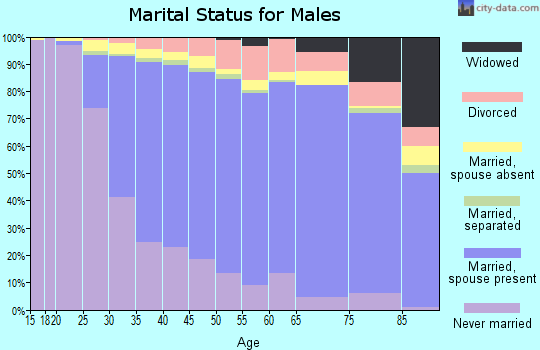
| Males: 467,647 | |
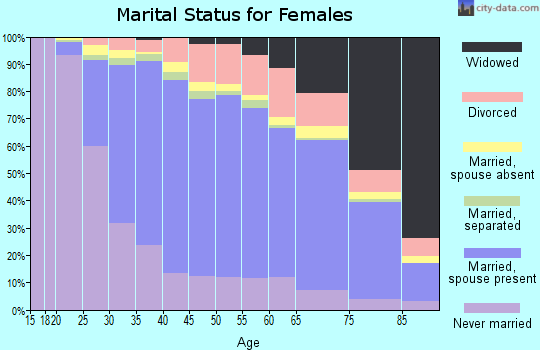
| Females: 485,350 |

 | Bergen County towns vs Holmdel (33 replies) |
| Bergen County Freeze (29 replies) |
| Bergen County NJ Catholic School Kindergarten Cutoff (32 replies) |
| Fun places to bring kids in Bergen County? (10 replies) |
| Seeking Distressed Properties for Purchase in Passaic, Essex, or Bergen County (1 reply) |
| Bergen County Retirees seeking Lower Tax Rate Move to Southern NJ (28 replies) |
| Bergen County: | 2.0 people |
| New Jersey: | 3 people |
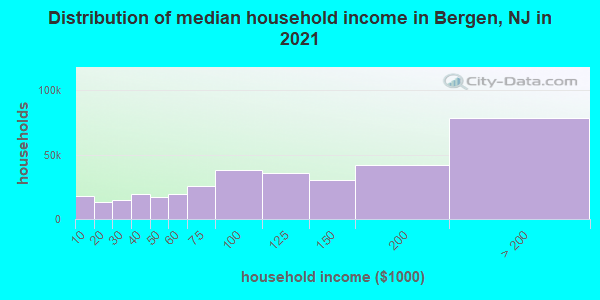
Estimated median household income in 2022: $114,336 ($65,241 in 1999)
| This county: | $114,336 |
| New Jersey: | $96,346 |
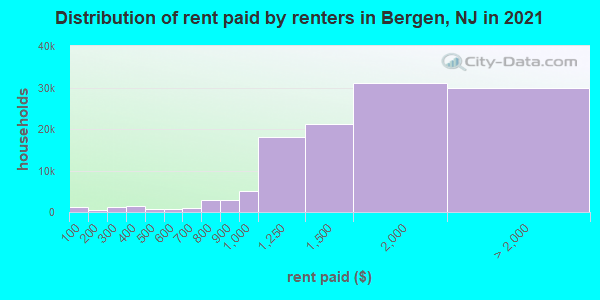
Median contract rent in 2022 for apartments: $1,644 (lower quartile is $1,266, upper quartile is $2,112)
| This county: | $1644 |
| State: | $1399 |
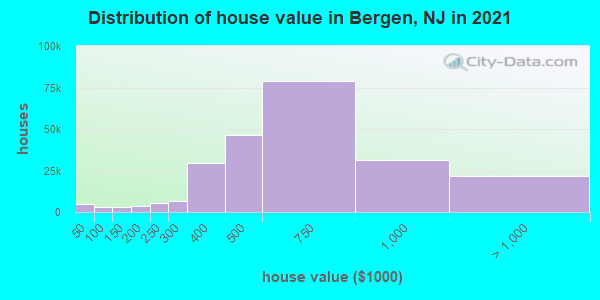
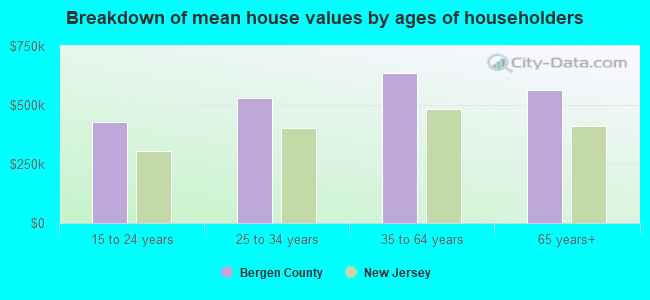
Estimated median house or condo value in 2022: $578,600 (it was $240,800 in 2000)
| Bergen: | $578,600 |
| New Jersey: | $428,900 |
Mean price in 2022:
Median monthly housing costs for homes and condos with a mortgage: $3,203Detached houses: $717,845
Here: $717,845 State: $537,591 Townhouses or other attached units: $671,656
Here: $671,656 State: $381,113 In 2-unit structures: $564,531
Here: $564,531 State: $444,476 In 3-to-4-unit structures: $569,909
Here: $569,909 State: $457,463 In 5-or-more-unit structures: $466,104
Here: $466,104 State: $368,745 Mobile homes: $410,347
Here: $410,347 State: $119,788
Median monthly housing costs for units without a mortgage: $1,341
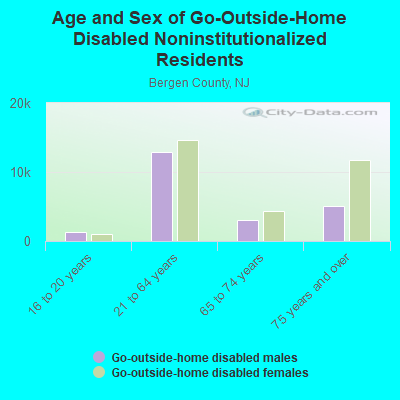
Institutionalized population: 5,047
Crime in 2020 (reported by the sheriff's office or county police, not the county total):
- Murders: 0
- Rapes: 0
- Robberies: 0
- Assaults: 0
- Burglaries: 0
- Thefts: 0
- Auto thefts: 0
Crime in 2019 (reported by the sheriff's office or county police, not the county total):
- Murders: 0
- Rapes: 2
- Robberies: 0
- Assaults: 0
- Burglaries: 2
- Thefts: 44
- Auto thefts: 0
Health of residents in Bergen County based on CDC Behavioral Risk Factor Surveillance System Survey Questionnaires from 2003 to 2012:
General health status score of residents in this county from 1 (poor) to 5 (excellent) is 3.7. This is better than average.74.8% of residents exercised in the past month. This is about average.
45.7% of residents smoked 100+ cigarettes in their lives. This is about average.
77.7% of adult residents drank alcohol in the past 30 days. This is about average.
78.1% of residents visited a dentist within the past year. This is more than average.
Average weight of males is 192 pounds. This is about average.
Average weight of females is 158 pounds. This is about average.
9.9% of residents keep firearms around their homes. This is less than average.
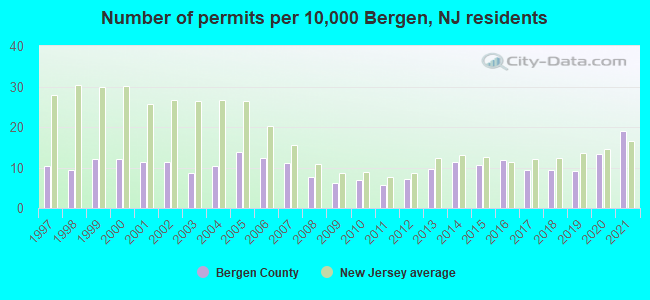
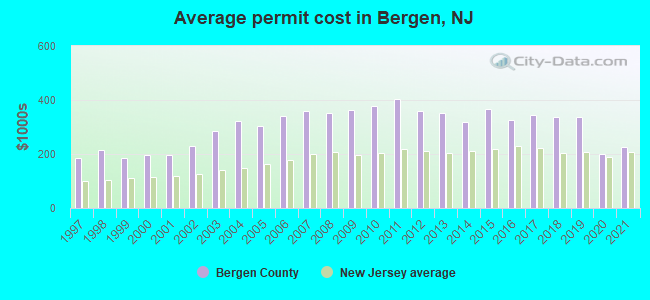
Single-family new house construction building permits:
- 2022: 1585 buildings, average cost: $206,200
- 2021: 1682 buildings, average cost: $224,800
- 2020: 1175 buildings, average cost: $200,300
- 2019: 806 buildings, average cost: $337,800
- 2018: 838 buildings, average cost: $337,500
- 2017: 833 buildings, average cost: $343,700
- 2016: 1057 buildings, average cost: $327,300
- 2015: 946 buildings, average cost: $365,900
- 2014: 1002 buildings, average cost: $316,700
- 2013: 846 buildings, average cost: $351,300
- 2012: 643 buildings, average cost: $359,200
- 2011: 498 buildings, average cost: $404,600
- 2010: 606 buildings, average cost: $378,400
- 2009: 544 buildings, average cost: $363,300
- 2008: 671 buildings, average cost: $351,400
- 2007: 981 buildings, average cost: $359,100
- 2006: 1096 buildings, average cost: $339,900
- 2005: 1220 buildings, average cost: $301,900
- 2004: 914 buildings, average cost: $321,100
- 2003: 760 buildings, average cost: $287,200
- 2002: 1015 buildings, average cost: $228,700
- 2001: 1010 buildings, average cost: $196,300
- 2000: 1076 buildings, average cost: $196,600
- 1999: 1062 buildings, average cost: $184,200
- 1998: 823 buildings, average cost: $213,000
- 1997: 921 buildings, average cost: $185,000
Median real estate property taxes paid for housing units with mortgages in 2022: $10,001 (1.6%)
Median real estate property taxes paid for housing units with no mortgage in 2022: $10,001 (1.9%)
| Bergen County: | 7.1% |
| New Jersey: | 9.7% |
Median age of residents in 2022: 42.2 years old
(Males: 41.0 years old, Females: 43.4 years old)
(Median age for: White residents: 47.9 years old, Black residents: 39.7 years old, American Indian residents: 40.8 years old, Asian residents: 42.9 years old, Hispanic or Latino residents: 36.1 years old, Other race residents: 35.1 years old)
Area name: Bergen-Passaic, NJ HUD Metro FMR Area
Fair market rent in 2006 for a 1-bedroom apartment in Bergen County is $979 a month.
Fair market rent for a 2-bedroom apartment is $1098 a month.
Fair market rent for a 3-bedroom apartment is $1356 a month.
Cities in this county include: Hackensack, Teaneck, Fort Lee, Fair Lawn, Garfield, Bergenfield, Englewood, Paramus, Ridgewood, Lodi.
2023 air pollution in Bergen County:
Carbon Monoxide: 0.337 ppm (standard limit: 9 ppm). Above U.S. average.
Nitrogen Dioxide: 0.02 ppm (standard limit: 0.053 ppm). Significanly above U.S. average.
Ozone (1-hour): 0.031 ppm (standard limit: 0.12 ppm). Near U.S. average.
Particulate Matter (PM2.5) Annual: 9.5 µg/m3(standard limit: 15.0 µg/m3). Near U.S. average.
Neighboring counties: Hunterdon County  , Pershing County, Nevada
  , Centre County, Pennsylvania , Defiance County, Ohio , Peoria County, Illinois .
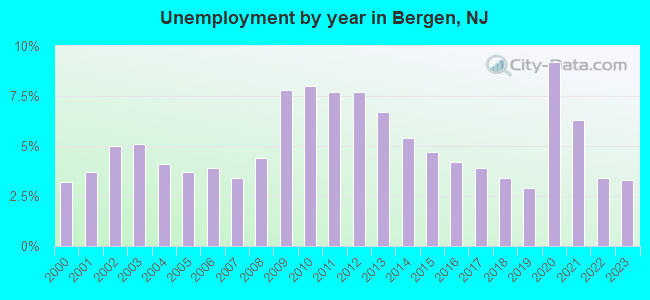
| Here: | 3.8% |
| New Jersey: | 4.5% |
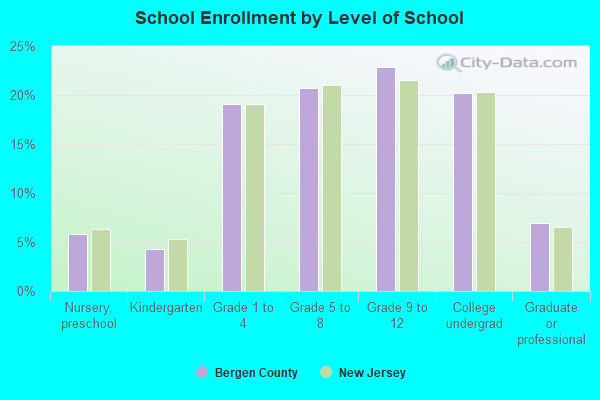
Current college students: 50,740
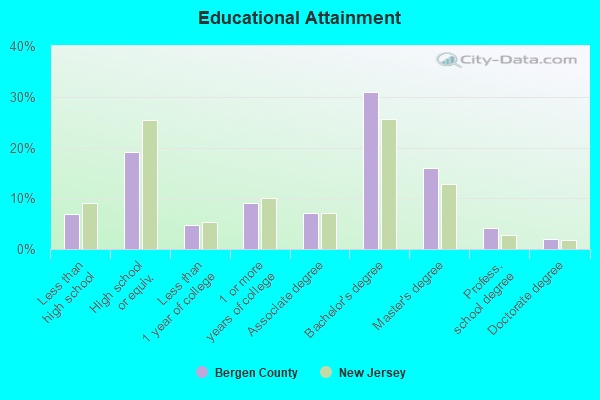
People 25 years of age or older with a high school degree or higher: 92.7%
People 25 years of age or older with a bachelor's degree or higher: 51.8%
Number of foreign born residents: 306,827 (67.2% naturalized citizens)
| Bergen County: | 32.2% |
| Whole state: | 23.5% |
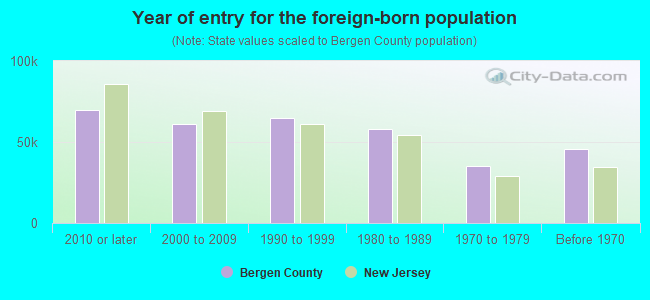
- Year of entry for the foreign-born population
- 78,7092010 or later
- 69,9562000 to 2009
- 66,9681990 to 1999
- 57,7921980 to 1989
- 35,1981970 to 1979
- 45,855Before 1970
Mean travel time to work (commute): minutes
Percentage of county residents living and working in this county: 82.0%
Housing units in structures:
- One, detached: 201,938
- One, attached: 20,579
- Two: 41,735
- 3 or 4: 18,658
- 5 to 9: 13,370
- 10 to 19: 13,541
- 20 to 49: 16,727
- 50 or more: 40,490
- Mobile homes: 2,278
- Boats, RVs, vans, etc.: 63
Housing units in Bergen County with a mortgage: 143,673 (17,556 second mortgage, 637 home equity loan, 15,791 both second mortgage and home equity loan)
Houses without a mortgage: 6,152
| Here: | 96.0% with mortgage |
| State: | 95.9% with mortgage |
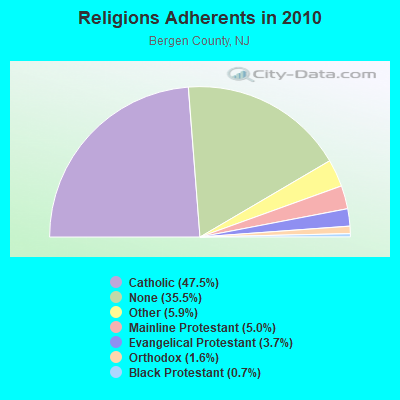
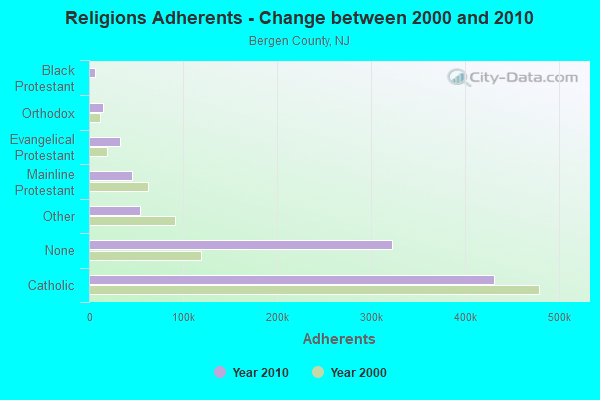
Religion statistics for Bergen County
| Religion | Adherents | Congregations |
|---|---|---|
| Catholic | 430,007 | 80 |
| Other | 53,728 | 120 |
| Mainline Protestant | 45,613 | 210 |
| Evangelical Protestant | 33,419 | 234 |
| Orthodox | 14,373 | 20 |
| Black Protestant | 6,286 | 17 |
| None | 321,690 | - |
Source: Clifford Grammich, Kirk Hadaway, Richard Houseal, Dale E.Jones, Alexei Krindatch, Richie Stanley and Richard H.Taylor. 2012. 2010 U.S.Religion Census: Religious Congregations & Membership Study. Association of Statisticians of American Religious Bodies. Jones, Dale E., et al. 2002. Congregations and Membership in the United States 2000. Nashville, TN: Glenmary Research Center.
Food Environment Statistics:
| Bergen County: | 2.90 / 10,000 pop. |
| State: | 2.90 / 10,000 pop. |
| Here: | 0.06 / 10,000 pop. |
| New Jersey: | 0.06 / 10,000 pop. |
| This county: | 1.51 / 10,000 pop. |
| New Jersey: | 1.76 / 10,000 pop. |
| Bergen County: | 1.07 / 10,000 pop. |
| New Jersey: | 0.81 / 10,000 pop. |
| This county: | 8.07 / 10,000 pop. |
| State: | 7.15 / 10,000 pop. |
| Bergen County: | 8.0% |
| New Jersey: | 8.3% |
| Bergen County: | 19.6% |
| State: | 23.3% |
| Here: | 17.9% |
| State: | 18.0% |
Agriculture in Bergen County:
Average size of farms: 14 acresAverage value of agricultural products sold per farm: $83,123
Average value of crops sold per acre for harvested cropland: $17573.17
The value of nursery, greenhouse, floriculture, and sod as a percentage of the total market value of agricultural products sold: 83.14%
The value of livestock, poultry, and their products as a percentage of the total market value of agricultural products sold: 3.59%
Average total farm production expenses per farm: $65,276
Harvested cropland as a percentage of land in farms: 32.35%
Average market value of all machinery and equipment per farm: $32,405
The percentage of farms operated by a family or individual: 69.23%
Average age of principal farm operators: 59 years
Average number of cattle and calves per 100 acres of all land in farms: 3.59
Vegetables: 161 harvested acres
Land in orchards: 64 acres
Earthquake activity:
Bergen County-area historical earthquake activity is significantly above New Jersey state average. It is 68% smaller than the overall U.S. average.On 8/23/2011 at 17:51:04, a magnitude 5.8 (5.8 MW, Depth: 3.7 mi, Class: Moderate, Intensity: VI - VII) earthquake occurred 294.2 miles away from Bergen County center
On 10/7/1983 at 10:18:46, a magnitude 5.3 (5.1 MB, 5.3 LG, 5.1 ML) earthquake occurred 209.6 miles away from the county center
On 4/20/2002 at 10:50:47, a magnitude 5.3 (5.3 ML, Depth: 3.0 mi) earthquake occurred 248.4 miles away from the county center
On 1/16/1994 at 01:49:16, a magnitude 4.6 (4.6 MB, 4.6 LG, Depth: 3.1 mi, Class: Light, Intensity: IV - V) earthquake occurred 111.8 miles away from the county center
On 4/20/2002 at 10:50:47, a magnitude 5.2 (5.2 MB, 4.2 MS, 5.2 MW, 5.0 MW) earthquake occurred 246.6 miles away from Bergen County center
On 1/16/1994 at 00:42:43, a magnitude 4.2 (4.2 MB, 4.0 LG, Depth: 3.1 mi) earthquake occurred 110.4 miles away from the county center
Magnitude types: regional Lg-wave magnitude (LG), body-wave magnitude (MB), local magnitude (ML), surface-wave magnitude (MS), moment magnitude (MW)
Most recent natural disasters:
- New Jersey Tropical Storm Isaias, Incident Period: August 4, 2020, Major Disaster (Presidential) Declared DR-4574-NJ: December 11, 2020, FEMA Id: 4574, Natural disaster type: Tropical Storm
- New Jersey Covid-19 Pandemic, Incident Period: January 20, 2020, Major Disaster (Presidential) Declared DR-4488-NJ: March 25, 2020, FEMA Id: 4488, Natural disaster type: Other
- New Jersey Severe Winter Storm And Snowstorm, Incident Period: March 6, 2018 - March 7, 2018, FEMA Id: 4368, Natural disaster type: Snowstorm, Winter Storm
- New Jersey Severe Winter Storm and Snowstorm, Incident Period: January 22, 2016 to January 24, 2016, Major Disaster (Presidential) Declared DR-4264: March 14, 2016, FEMA Id: 4264, Natural disaster type: Snowstorm, Winter Storm
- New Jersey Hurricane Sandy, Incident Period: October 26, 2012 to November 08, 2012, Emergency Declared EM-3354: October 28, 2012, FEMA Id: 3354, Natural disaster type: Hurricane
- New Jersey Hurricane Sandy, Incident Period: October 26, 2012 to November 08, 2012, Major Disaster (Presidential) Declared DR-4086: October 30, 2012, FEMA Id: 4086, Natural disaster type: Hurricane
- New Jersey Severe Storm, Incident Period: October 29, 2011, Major Disaster (Presidential) Declared DR-4048: November 30, 2011, FEMA Id: 4048, Natural disaster type: Storm
- New Jersey Hurricane Irene, Incident Period: August 27, 2011 to September 05, 2011, Major Disaster (Presidential) Declared DR-4021: August 31, 2011, FEMA Id: 4021, Natural disaster type: Hurricane
- New Jersey Hurricane Irene, Incident Period: August 26, 2011 to September 05, 2011, Emergency Declared EM-3332: August 27, 2011, FEMA Id: 3332, Natural disaster type: Hurricane
- New Jersey Severe Winter Storm and Snowstorm, Incident Period: December 26, 2010 to December 27, 2010, Major Disaster (Presidential) Declared DR-1954: February 04, 2011, FEMA Id: 1954, Natural disaster type: Snowstorm, Winter Storm
- 19 other natural disasters have been reported since 1953.
The number of natural disasters in Bergen County (29) is a lot greater than the US average (15).
Major Disasters (Presidential) Declared: 18
Emergencies Declared: 10
Causes of natural disasters: Floods: 7, Hurricanes: 7, Storms: 6, Heavy Rains: 4, Snowstorms: 4, Winter Storms: 3, Blizzards: 2, Water Shortages: 2, Power Outage: 1, Tornado: 1, Tropical Storm: 1, Wind: 1, Other: 3 (Note: some incidents may be assigned to more than one category).
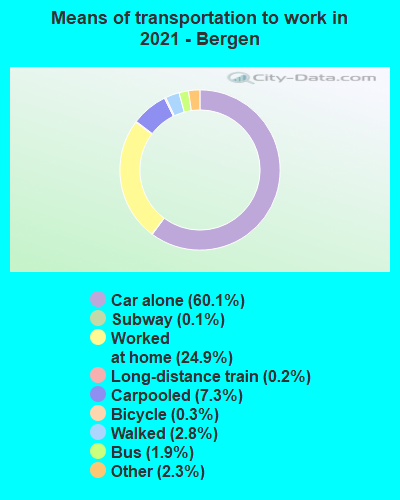
Means of transportation to work:
- Drove a car alone: 297,268 (63.6%)
- Carpooled: 40,773 (8.7%)
- Bus: 12,170 (2.6%)
- Subway or elevated rail: 857 (0.2%)
- Long-distance train or commuter rail: 659 (0.1%)
- Light rail, streetcar or trolley: 48 (0.0%)
- Taxicab, motorcycle, or other means: 9,896 (2.1%)
- Bicycle: 791 (0.2%)
- Walked: 13,553 (2.9%)
- Worked at home: 91,604 (19.6%)
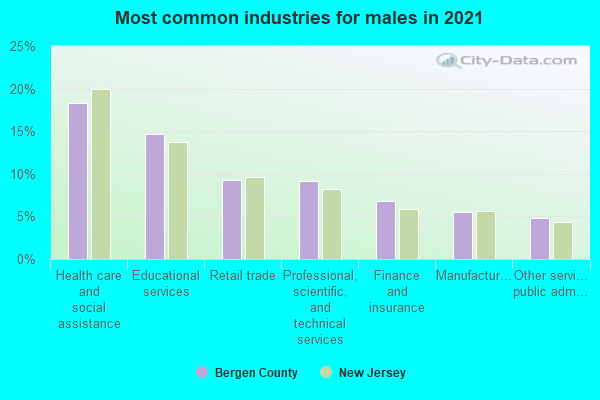
- Health care and social assistance (21%)
- Educational services (13%)
- Professional, scientific, and technical services (9%)
- Retail trade (9%)
- Finance and insurance (6%)
- Manufacturing (5%)
- Other services, except public administration (5%)
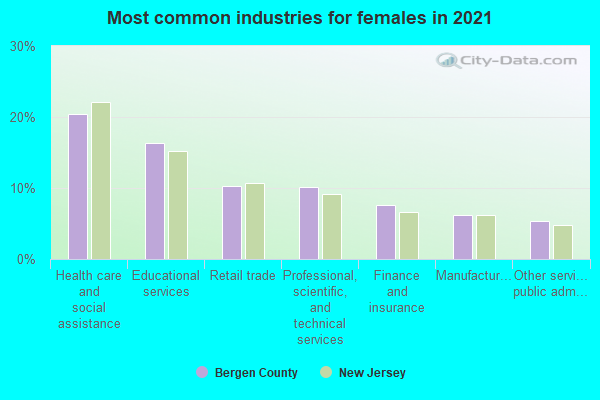
- Health care and social assistance (24%)
- Educational services (15%)
- Professional, scientific, and technical services (10%)
- Retail trade (10%)
- Finance and insurance (7%)
- Manufacturing (6%)
- Other services, except public administration (5%)
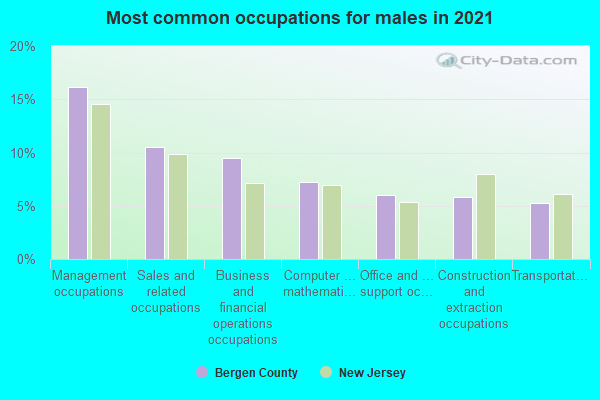
- Management occupations (17%)
- Sales and related occupations (11%)
- Computer and mathematical occupations (7%)
- Business and financial operations occupations (7%)
- Office and administrative support occupations (6%)
- Construction and extraction occupations (6%)
- Transportation occupations (4%)
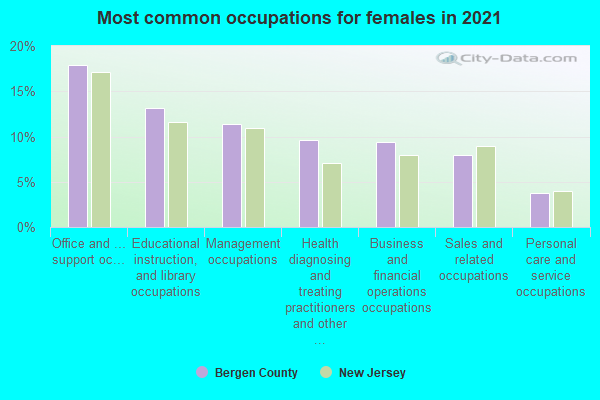
- Office and administrative support occupations (16%)
- Management occupations (13%)
- Educational instruction, and library occupations (12%)
- Health diagnosing and treating practitioners and other technical occupations (9%)
- Sales and related occupations (9%)
- Business and financial operations occupations (8%)
- Healthcare support occupations (6%)
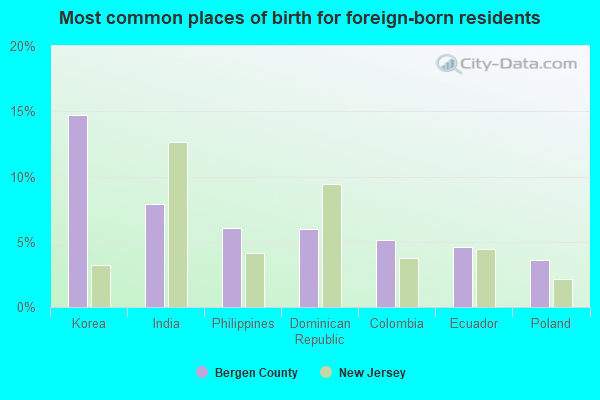
- Korea (14%)
- Dominican Republic (7%)
- India (6%)
- Colombia (6%)
- Philippines (5%)
- Ecuador (5%)
- China, excluding Hong Kong and Taiwan (4%)
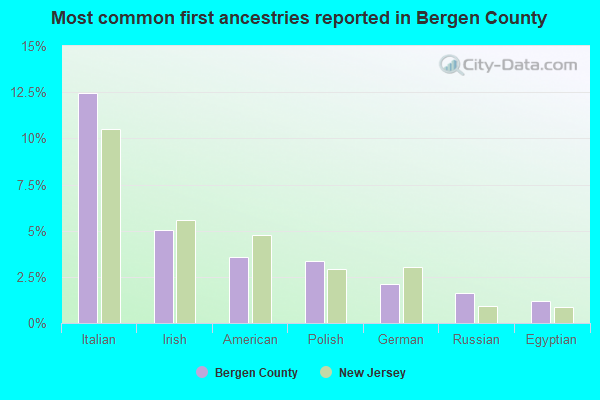
- Italian (11%)
- Irish (5%)
- Polish (4%)
- American (4%)
- German (2%)
- Russian (1%)
- Greek (1%)
People in group quarters in Bergen County, New Jersey in 2010:
- 3,913 people in college/university student housing
- 3,546 people in nursing facilities/skilled-nursing facilities
- 732 people in local jails and other municipal confinement facilities
- 623 people in group homes intended for adults
- 579 people in hospitals with patients who have no usual home elsewhere
- 558 people in other noninstitutional facilities
- 193 people in emergency and transitional shelters (with sleeping facilities) for people experiencing homelessness
- 110 people in residential treatment centers for juveniles (non-correctional)
- 51 people in residential treatment centers for adults
- 42 people in mental (psychiatric) hospitals and psychiatric units in other hospitals
- 37 people in workers' group living quarters and job corps centers
- 29 people in group homes for juveniles (non-correctional)
- 9 people in correctional facilities intended for juveniles
People in group quarters in Bergen County, New Jersey in 2000:
- 4,654 people in nursing homes
- 2,277 people in college dormitories (includes college quarters off campus)
- 709 people in religious group quarters
- 665 people in other noninstitutional group quarters
- 660 people in local jails and other confinement facilities (including police lockups)
- 660 people in other group homes
- 454 people in hospitals/wards and hospices for chronically ill
- 454 people in other hospitals or wards for chronically ill
- 383 people in homes for the mentally retarded
- 281 people in homes for the mentally ill
- 195 people in other nonhousehold living situations
- 161 people in other workers' dormitories
- 91 people in mental (psychiatric) hospitals or wards
- 79 people in homes or halfway houses for drug/alcohol abuse
- 34 people in hospitals or wards for drug/alcohol abuse
- 28 people in short-term care, detention or diagnostic centers for delinquent children
- 18 people in homes for abused, dependent, and neglected children
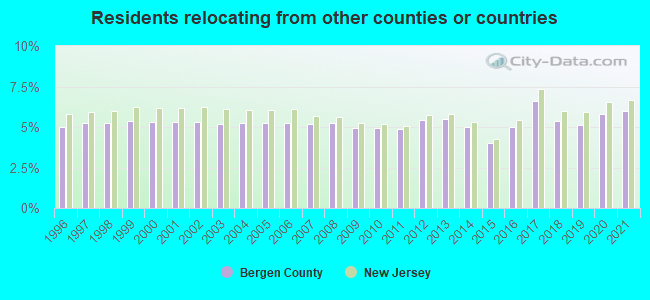
6.00% of this county's 2021 resident taxpayers lived in other counties in 2020 ($117,506 average adjusted gross income)
| Here: | 6.00% |
| New Jersey average: | 6.70% |
0.01% of residents moved from foreign countries ($60 average AGI)
Bergen County: 0.01% New Jersey average: 0.01%
2.72% relocated from other counties in New Jersey ($43,501 average AGI)
3.26% relocated from other states ($73,946 average AGI)
Bergen County: 3.26% New Jersey average: 2.98%
Top counties from which taxpayers relocated into this county between 2020 and 2021:
| from Hudson County, NJ | |
| from Passaic County, NJ | |
| from New York County, NY | |
| from Queens County, NY | |
| from Essex County, NJ | |
| from Bronx County, NY | |
| from Kings County, NY |
6.43% of this county's 2020 resident taxpayers moved to other counties in 2021 ($129,044 average adjusted gross income)
| Here: | 6.43% |
| New Jersey average: | 7.02% |
0.01% of residents moved to foreign countries ($163 average AGI)
Bergen County: 0.01% New Jersey average: 0.02%
3.06% relocated to other counties in New Jersey ($47,786 average AGI)
3.36% relocated to other states ($81,094 average AGI)
Bergen County: 3.36% New Jersey average: 3.32%

Top counties to which taxpayers relocated from this county between 2020 and 2021:
| to Passaic County, NJ | |
| to Hudson County, NJ | |
| to Essex County, NJ | |
| to Morris County, NJ | |
| to New York County, NY | |
| to Ocean County, NJ | |
| to Middlesex County, NJ |
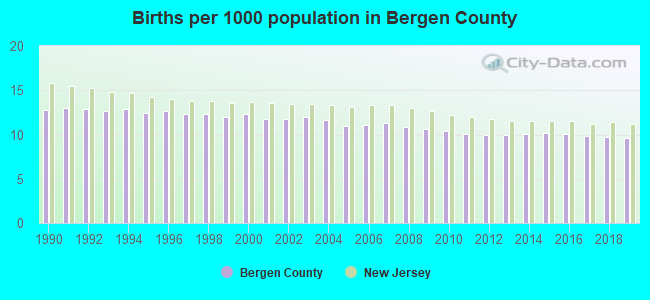
Births per 1000 population from 1990 to 1999: 12.6
Births per 1000 population from 2000 to 2009: 11.4
Births per 1000 population from 2010 to 2022: 8.4
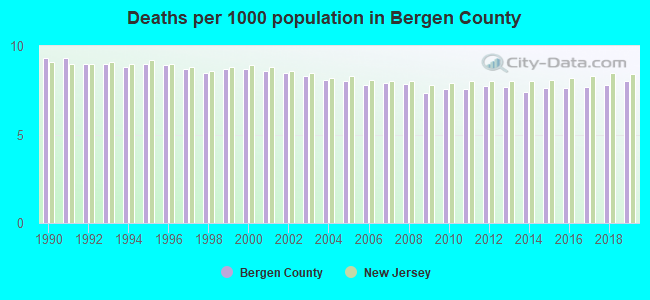
Deaths per 1000 population from 1990 to 1999: 8.9
Deaths per 1000 population from 2000 to 2009: 8.1
Deaths per 1000 population from 2010 to 2020: 7.9
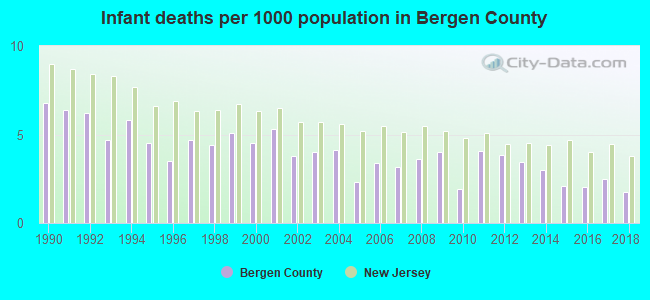
Infant deaths per 1000 live births from 1990 to 1999: 5.2
Infant deaths per 1000 live births from 2000 to 2009: 3.8
Infant deaths per 1000 live births from 2010 to 2021: 2.8
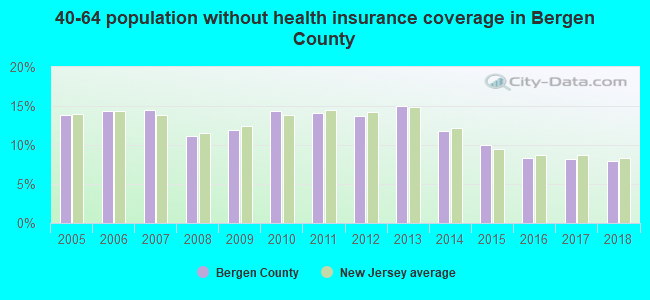
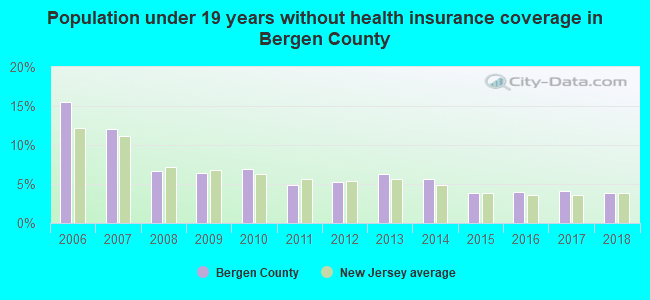
Persons under 19 years old without health insurance coverage in 2018: 3.8%
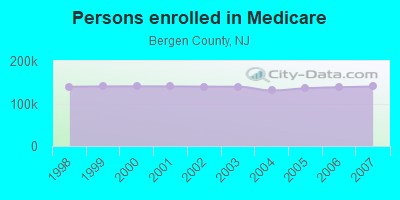
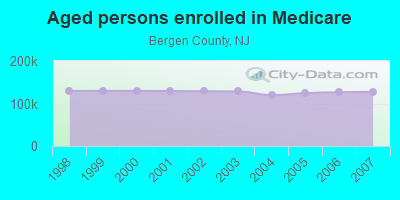
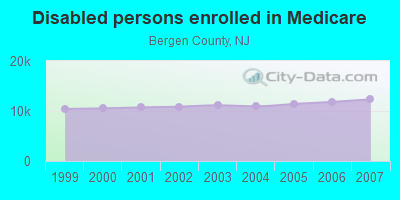
Persons enrolled in hospital insurance and/or supplemental medical insurance (Medicare) in July 1, 2007: 140,016 (127,679 aged, 12,337 disabled)
Children under 18 without health insurance coverage in 2007: 20,897 (10%)
Most common underlying causes of death in Bergen County, New Jersey in 1999 - 2019:
- Atherosclerotic heart disease (15,288)
- Bronchus or lung, unspecified - Malignant neoplasms (8,625)
- Acute myocardial infarction, unspecified (8,622)
- Unspecified dementia (5,187)
- Alzheimer disease, unspecified (4,226)
- Chronic obstructive pulmonary disease, unspecified (4,140)
- Stroke, not specified as haemorrhage or infarction (4,130)
- Congestive heart failure (3,534)
- Septicaemia, unspecified (3,174)
- Breast, unspecified - Malignant neoplasms (3,118)
Population without health insurance coverage in 2000: 10%
Children under 18 without health insurance coverage in 2000: 7%
Short term general hospital admissions per 100,000 population in 2004: 15,424
Short term general hospital beds per 100,000 population in 2004: 208
Emergency room visits per 100,000 population in 2004: 23,949
General practice office based MDs per 100,000 population in 2005: 1,072
Medical specialist MDs per 100,000 population in 2005: 794
Dentists per 100,000 population in 1998: 19
Total births per 100,000 population, July 2005 - July 2006 : 107
Total deaths per 100,000 population, July 2005 - July 2006: 109
Limited-service eating places per 100,000 population in 2005 : 22
Beer, wine & liquor stores per 100,000 population in 2005: 1
Fitness & recreation sports centers per 100,000 population in 2005: 2,704
EPA green book nonattainment status in 2004-2006: 1
Suicides per 1,000,000 population from 2000 to 2006: 65.0. This is less than state average.
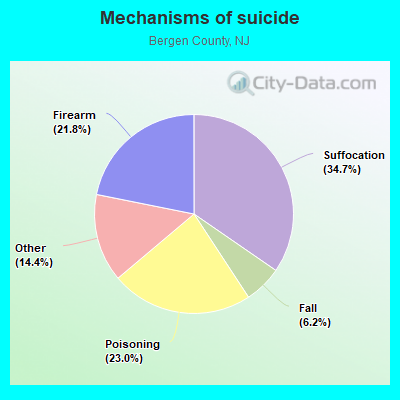
- Suffocation - 22.5
- Poisoning - 15.0
- Firearm - 14.2
- Fall - 4.0
- Other - 9.3
Household type by relationship:
Households: 952,997- Male householders: 178,368 (36,225 living alone), Female householders: 176,569 (50,262 living alone)
195,332 spouses (193,707 opposite-sex spouses), 20,411 unmarried partners, (19,402 opposite-sex unmarried partners), 297,747 children (288,679 natural, 4,409 adopted, 4,659 stepchildren), 9,178 grandchildren, 9,457 brothers or sisters, 23,064 parents, 672 foster children, 13,929 other relatives, 17,286 non-relatives
- In group quarters: 10,984
Size of family households: 92,936 2-persons, 65,850 3-persons, 55,758 4-persons, 24,584 5-persons, 9,489 6-persons, 4,104 7-or-more-persons.
Size of nonfamily households: 86,487 1-person, 13,795 2-persons, 1,286 3-persons, 129 4-persons, 519 5-persons.
151,149 married couples with children.
33,135 single-parent households (6,335 men, 26,800 women).
57.7% of residents of Bergen speak English at home.
17.4% of residents speak Spanish at home (60% speak English very well, 20% speak English well, 14% speak English not well, 6% don't speak English at all).
10.6% of residents speak other Indo-European language at home (68% speak English very well, 21% speak English well, 9% speak English not well, 2% don't speak English at all).
11.8% of residents speak Asian or Pacific Island language at home (54% speak English very well, 25% speak English well, 18% speak English not well, 2% don't speak English at all).
2.5% of residents speak other language at home (71% speak English very well, 20% speak English well, 8% speak English not well, 1% don't speak English at all).
In fiscal year 2004:
Federal Government expenditure: $4,561,601,000 ($5,052 per capita)
Department of Defense expenditure: $487,297,000
Federal direct payments to individuals for retirement and disability: $2,080,583,000
Federal other direct payments to individuals: $1,137,311,000
Federal direct payments not to individuals: $4,482,000
Federal grants: $508,447,000
Federal procurement contracts: $591,832,000 ($449,508,000 Department of Defense)
Federal salaries and wages: $238,945,000 ($14,222,000 Department of Defense)
Federal Government direct loans: $29,261,000
Federal guaranteed/insured loans: $310,951,000
Federal Government insurance: $1,574,097,000
Population change from April 1, 2000 to July 1, 2005:
Births: 54,077| Here: | 60 per 1000 residents |
| State: | 69 per 1000 residents |
Deaths: 38,625
| Here: | 43 per 1000 residents |
| State: | 44 per 1000 residents |
Net international migration: +39,105
| Here: | +43 per 1000 residents |
| State: | +33 per 1000 residents |
Net internal migration: -34,423
| Here: | |
| State: |
Total withdrawal of fresh water for public supply: 112.29 millions of gallons per day (22% from ground, 78% from surface)
| Here: | 6.8 |
| State: | 6.8 |
| Here: | 3.8 |
| State: | 3.9 |
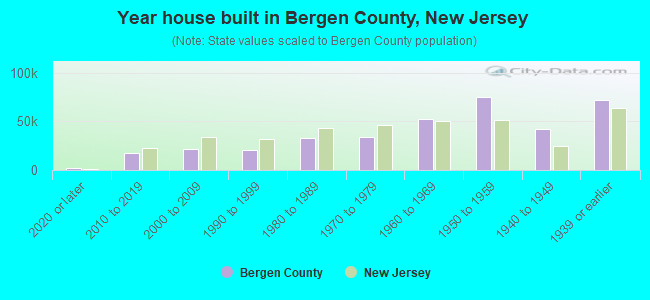
- Year house built in Bergen County, New Jersey
- 4,6542020 or later
- 20,3632010 to 2019
- 19,8852000 to 2009
- 22,0981990 to 1999
- 33,2191980 to 1989
- 34,7941970 to 1979
- 47,3981960 to 1969
- 78,3111950 to 1959
- 38,0811940 to 1949
- 70,5761939 or earlier
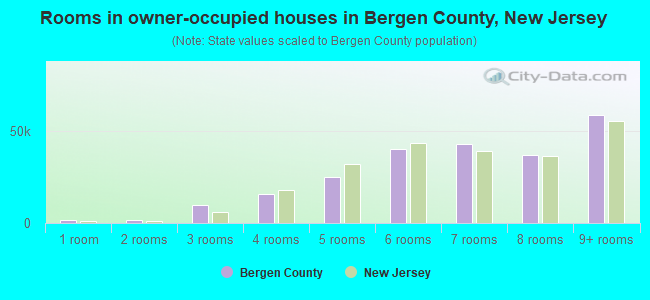
- Rooms in owner-occupied houses in Bergen County, New Jersey
- 1,8481 room
- 2,5842 rooms
- 7,8923 rooms
- 21,0064 rooms
- 27,6015 rooms
- 45,2516 rooms
- 37,4687 rooms
- 34,3458 rooms
- 55,0509+ rooms
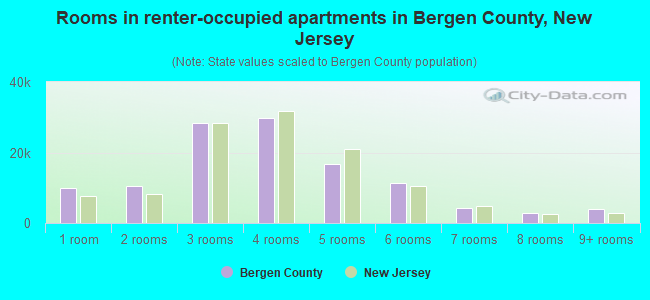
- Rooms in renter-occupied apartments in Bergen County, New Jersey
- 7,9761 room
- 11,4232 rooms
- 31,2653 rooms
- 34,2354 rooms
- 18,0805 rooms
- 9,7486 rooms
- 3,6737 rooms
- 2,0628 rooms
- 3,4309+ rooms
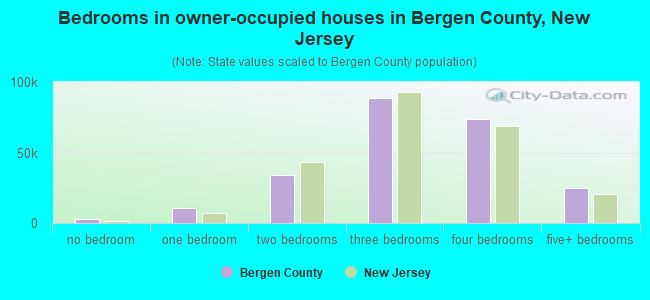
- Bedrooms in owner-occupied houses in Bergen County, New Jersey
- 2,290no bedroom
- 10,8721 bedroom
- 38,1742 bedrooms
- 87,5713 bedrooms
- 67,5284 bedrooms
- 26,6105+ bedrooms
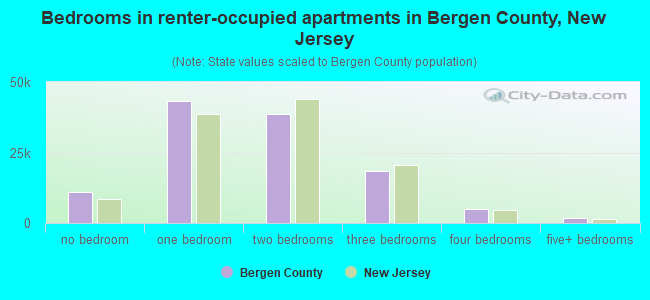
- Bedrooms in renter-occupied apartments in Bergen County, New Jersey
- 8,270no bedroom
- 42,8121 bedroom
- 46,1062 bedrooms
- 18,9523 bedrooms
- 4,3114 bedrooms
- 1,4415+ bedrooms
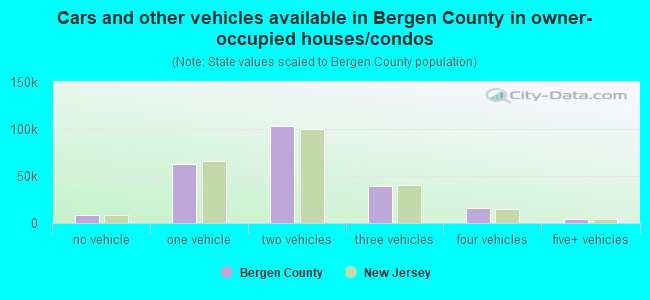
- Cars and other vehicles available in Bergen County in owner-occupied houses/condos
- 7,270no vehicle
- 68,8531 vehicle
- 102,6272 vehicles
- 39,1293 vehicles
- 11,8334 vehicles
- 3,3335+ vehicles
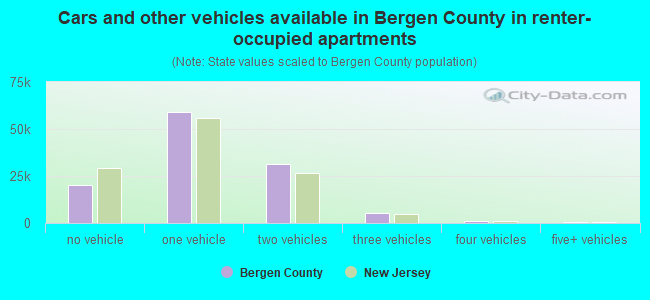
- Cars and other vehicles available in Bergen County in renter-occupied apartments
- 21,561no vehicle
- 62,0271 vehicle
- 31,0372 vehicles
- 6,0253 vehicles
- 5774 vehicles
- 6655+ vehicles
90.3% of Bergen County residents lived in the same house 1 years ago.
Out of people who lived in different houses, 36% lived in this county.
Out of people who lived in different counties, 45% lived in New Jersey.
| Bergen County: | 90.3% |
| State average: | 90.4% |
Place of birth for U.S.-born residents:
- This state: 386,672
- Other state: 241,313
- Northeast: 196,980
- Midwest: 9,989
- South: 21,051
- West: 13,293
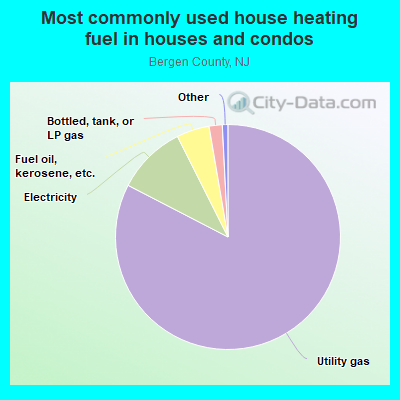
- 82.4%Utility gas
- 9.9%Electricity
- 4.1%Fuel oil, kerosene, etc.
- 2.3%Bottled, tank, or LP gas
- 0.7%Other fuel
- 0.4%No fuel used
- 0.2%Solar energy
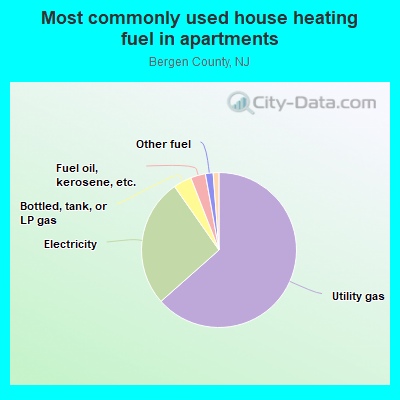
- 57.1%Utility gas
- 30.1%Electricity
- 4.9%Bottled, tank, or LP gas
- 4.8%Fuel oil, kerosene, etc.
- 2.2%No fuel used
- 0.9%Other fuel
Private vs. public school enrollment:
| Here: | 10.6% |
| New Jersey: | 12.3% |
| Here: | 12.1% |
| New Jersey: | 13.1% |
| Here: | 34.0% |
| New Jersey: | 33.2% |
Bergen County government finances - Expenditure in 2020:
- Assistance and Subsidies - Public Welfare, Federal Categorical Assistance Programs: $8,429,000
Public Welfare, Federal Categorical Assistance Programs: $8,321,000
Public Welfare, Cash Assistance Programs - Other: $2,431,000
Public Welfare, Cash Assistance Programs - Other: $685,000
- Bond Funds - Cash and Securities: $37,199,000
Cash and Securities: $5,892,000
- Charges - Hospital Public: $222,970,000
Hospital Public: $206,875,000
Sewerage: $81,790,000
Sewerage: $78,827,000
Higher Education - Other: $55,323,000
Higher Education - Other: $48,626,000
Elementary and Secondary Education - Other: $45,084,000
Elementary and Secondary Education - Other: $39,667,000
Other: $21,630,000
Parks and Recreation: $9,514,000
Parks and Recreation: $9,160,000
Solid Waste Management: $7,120,000
Solid Waste Management: $7,106,000
Other: $6,580,000
Housing and Community Development: $3,796,000
Housing and Community Development: $2,895,000
Elementary and Secondary Education School Tuition and Transportation: $1,590,000
Elementary and Secondary Education School Tuition and Transportation: $1,440,000
Elementary and Secondary Education School Lunch: $830,000
Elementary and Secondary Education School Lunch: $807,000
Parking Facilities: $411,000
Parking Facilities: $403,000
Higher Education Auxiliary Enterprises: $161,000
Higher Education Auxiliary Enterprises: $104,000
- Construction - Regular Highways: $9,602,000
Elementary and Secondary Education: $6,574,000
Elementary and Secondary Education: $3,047,000
Other Higher Education: $2,756,000
Parks and Recreation: $2,100,000
Sewerage: $1,741,000
Other Higher Education: $1,398,000
Sewerage: $1,141,000
Police Protection: $1,100,000
General - Other: $600,000
Correctional Institutions: $465,000
Public Welfare Institutions: $288,000
General Public Buildings: $215,000
Health - Other: $215,000
- Current Operations - Elementary and Secondary Education: $227,651,000
Elementary and Secondary Education: $220,843,000
Hospitals: $215,561,000
Hospitals: $213,513,000
General - Other: $147,831,000
Other Higher Education: $125,547,000
Other Higher Education: $106,940,000
General - Other: $96,776,000
Housing and Community Development: $53,258,000
Sewerage: $50,941,000
Correctional Institutions: $50,548,000
Housing and Community Development: $50,279,000
Correctional Institutions: $49,907,000
Sewerage: $48,873,000
Police Protection: $42,797,000
Public Welfare - Other: $41,896,000
Judicial and Legal Services: $35,372,000
Judicial and Legal Services: $33,952,000
Public Welfare - Other: $31,706,000
Regular Highways: $22,204,000
Police Protection: $18,840,000
Health - Other: $17,930,000
Health - Other: $16,593,000
Parks and Recreation: $14,833,000
General Public Buildings: $13,465,000
Parks and Recreation: $12,885,000
Central Staff Services: $9,716,000
Public Welfare, Vendor Payments for Medical Care: $9,203,000
Solid Waste Management: $9,091,000
Solid Waste Management: $8,609,000
Central Staff Services: $7,899,000
Financial Administration: $7,636,000
Financial Administration: $7,322,000
Regular Highways: $6,499,000
Public Welfare, Vendor Payments for Other Purposes: $5,099,000
Public Welfare, Vendor Payments for Other Purposes: $3,305,000
Public Welfare Institutions: $2,092,000
Protective Inspection and Regulation - Other: $890,000
Higher Education Auxiliary Enterprises: $466,000
Higher Education Auxiliary Enterprises: $414,000
- Federal Intergovernmental - Housing and Community Development: $46,640,000
Housing and Community Development: $45,584,000
Education: $29,271,000
Education: $24,347,000
Other: $2,782,000
- General - Interest on Debt: $46,714,000
Interest on Debt: $25,965,000
- Intergovernmental to Local - Other - General - Other: $155,000
Other - General - Other: $150,000
Other - Housing and Community Development: $114,000
Other - Housing and Community Development: $100,000
- Intergovernmental to State - Hospitals: $40,836,000
Elementary and Secondary Education: $48,000
Elementary and Secondary Education: $48,000
- Local Intergovernmental - Education: $156,155,000
Education: $143,786,000
Sewerage: $71,698,000
Other: $9,241,000
Other: $8,470,000
Housing and Community Development: $1,274,000
Housing and Community Development: $1,034,000
- Long Term Debt - Beginning Outstanding - Unspecified Public Purpose: $781,096,000
Outstanding Unspecified Public Purpose: $751,356,000
Beginning Outstanding - Unspecified Public Purpose: $700,190,000
Outstanding Unspecified Public Purpose: $684,892,000
Retired Unspecified Public Purpose: $244,980,000
Issue, Unspecified Public Purpose: $215,240,000
Retired Unspecified Public Purpose: $136,288,000
Issue, Unspecified Public Purpose: $120,990,000
- Miscellaneous - General Revenue - Other: $27,469,000
Sale of Property: $16,300,000
Donations From Private Sources: $13,168,000
General Revenue - Other: $11,307,000
Interest Earnings: $5,806,000
Interest Earnings: $3,246,000
Rents: $2,116,000
Fines and Forfeits: $1,315,000
- Other Capital Outlay - General - Other: $7,372,000
Elementary and Secondary Education: $4,890,000
Other Higher Education: $4,680,000
Other Higher Education: $4,662,000
Elementary and Secondary Education: $3,722,000
Regular Highways: $3,285,000
Financial Administration: $1,474,000
Police Protection: $1,450,000
Correctional Institutions: $866,000
Judicial and Legal Services: $770,000
Parks and Recreation: $623,000
Health - Other: $416,000
Public Welfare Institutions: $165,000
Sewerage: $137,000
General Public Building: $110,000
Sewerage: $20,000
Central Staff Services: $5,000
- Other Funds - Cash and Securities: $156,734,000
Cash and Securities: $105,880,000
- Short Term Debt Outstanding - Beginning: $200,000,000
End of Fiscal Year: $184,773,000
Beginning: $999,000
End of Fiscal Year: $588,000
- Sinking Funds - Cash and Securities: $27,098,000
Cash and Securities: $19,660,000
- State Intergovernmental - Education: $69,145,000
Education: $66,822,000
Other: $29,337,000
Other: $26,274,000
Health and Hospitals: $13,201,000
General Local Government Support: $2,641,000
Public Welfare: $1,558,000
- Tax - Property: $419,407,000
Property: $411,690,000
Documentary and Stock Transfer: $8,776,000
Documentary and Stock Transfer: $8,338,000
- Total Salaries and Wages: $178,521,000
: $101,886,000
Bergen County government finances - Revenue in 2020:
- Assistance and Subsidies - Public Welfare, Federal Categorical Assistance Programs: $8,429,000
Public Welfare, Federal Categorical Assistance Programs: $8,321,000
Public Welfare, Cash Assistance Programs - Other: $2,431,000
Public Welfare, Cash Assistance Programs - Other: $685,000
- Bond Funds - Cash and Securities: $37,199,000
Cash and Securities: $5,892,000
- Charges - Hospital Public: $222,970,000
Hospital Public: $206,875,000
Sewerage: $81,790,000
Sewerage: $78,827,000
Higher Education - Other: $55,323,000
Higher Education - Other: $48,626,000
Elementary and Secondary Education - Other: $45,084,000
Elementary and Secondary Education - Other: $39,667,000
Other: $21,630,000
Parks and Recreation: $9,514,000
Parks and Recreation: $9,160,000
Solid Waste Management: $7,120,000
Solid Waste Management: $7,106,000
Other: $6,580,000
Housing and Community Development: $3,796,000
Housing and Community Development: $2,895,000
Elementary and Secondary Education School Tuition and Transportation: $1,590,000
Elementary and Secondary Education School Tuition and Transportation: $1,440,000
Elementary and Secondary Education School Lunch: $830,000
Elementary and Secondary Education School Lunch: $807,000
Parking Facilities: $411,000
Parking Facilities: $403,000
Higher Education Auxiliary Enterprises: $161,000
Higher Education Auxiliary Enterprises: $104,000
- Construction - Regular Highways: $9,602,000
Elementary and Secondary Education: $6,574,000
Elementary and Secondary Education: $3,047,000
Other Higher Education: $2,756,000
Parks and Recreation: $2,100,000
Sewerage: $1,741,000
Other Higher Education: $1,398,000
Sewerage: $1,141,000
Police Protection: $1,100,000
General - Other: $600,000
Correctional Institutions: $465,000
Public Welfare Institutions: $288,000
General Public Buildings: $215,000
Health - Other: $215,000
- Current Operations - Elementary and Secondary Education: $227,651,000
Elementary and Secondary Education: $220,843,000
Hospitals: $215,561,000
Hospitals: $213,513,000
General - Other: $147,831,000
Other Higher Education: $125,547,000
Other Higher Education: $106,940,000
General - Other: $96,776,000
Housing and Community Development: $53,258,000
Sewerage: $50,941,000
Correctional Institutions: $50,548,000
Housing and Community Development: $50,279,000
Correctional Institutions: $49,907,000
Sewerage: $48,873,000
Police Protection: $42,797,000
Public Welfare - Other: $41,896,000
Judicial and Legal Services: $35,372,000
Judicial and Legal Services: $33,952,000
Public Welfare - Other: $31,706,000
Regular Highways: $22,204,000
Police Protection: $18,840,000
Health - Other: $17,930,000
Health - Other: $16,593,000
Parks and Recreation: $14,833,000
General Public Buildings: $13,465,000
Parks and Recreation: $12,885,000
Central Staff Services: $9,716,000
Public Welfare, Vendor Payments for Medical Care: $9,203,000
Solid Waste Management: $9,091,000
Solid Waste Management: $8,609,000
Central Staff Services: $7,899,000
Financial Administration: $7,636,000
Financial Administration: $7,322,000
Regular Highways: $6,499,000
Public Welfare, Vendor Payments for Other Purposes: $5,099,000
Public Welfare, Vendor Payments for Other Purposes: $3,305,000
Public Welfare Institutions: $2,092,000
Protective Inspection and Regulation - Other: $890,000
Higher Education Auxiliary Enterprises: $466,000
Higher Education Auxiliary Enterprises: $414,000
- Federal Intergovernmental - Housing and Community Development: $46,640,000
Housing and Community Development: $45,584,000
Education: $29,271,000
Education: $24,347,000
Other: $2,782,000
- General - Interest on Debt: $46,714,000
Interest on Debt: $25,965,000
- Intergovernmental to Local - Other - General - Other: $155,000
Other - General - Other: $150,000
Other - Housing and Community Development: $114,000
Other - Housing and Community Development: $100,000
- Intergovernmental to State - Hospitals: $40,836,000
Elementary and Secondary Education: $48,000
Elementary and Secondary Education: $48,000
- Local Intergovernmental - Education: $156,155,000
Education: $143,786,000
Sewerage: $71,698,000
Other: $9,241,000
Other: $8,470,000
Housing and Community Development: $1,274,000
Housing and Community Development: $1,034,000
- Long Term Debt - Beginning Outstanding - Unspecified Public Purpose: $781,096,000
Outstanding Unspecified Public Purpose: $751,356,000
Beginning Outstanding - Unspecified Public Purpose: $700,190,000
Outstanding Unspecified Public Purpose: $684,892,000
Retired Unspecified Public Purpose: $244,980,000
Issue, Unspecified Public Purpose: $215,240,000
Retired Unspecified Public Purpose: $136,288,000
Issue, Unspecified Public Purpose: $120,990,000
- Miscellaneous - General Revenue - Other: $27,469,000
Sale of Property: $16,300,000
Donations From Private Sources: $13,168,000
General Revenue - Other: $11,307,000
Interest Earnings: $5,806,000
Interest Earnings: $3,246,000
Rents: $2,116,000
Fines and Forfeits: $1,315,000
- Other Capital Outlay - General - Other: $7,372,000
Elementary and Secondary Education: $4,890,000
Other Higher Education: $4,680,000
Other Higher Education: $4,662,000
Elementary and Secondary Education: $3,722,000
Regular Highways: $3,285,000
Financial Administration: $1,474,000
Police Protection: $1,450,000
Correctional Institutions: $866,000
Judicial and Legal Services: $770,000
Parks and Recreation: $623,000
Health - Other: $416,000
Public Welfare Institutions: $165,000
Sewerage: $137,000
General Public Building: $110,000
Sewerage: $20,000
Central Staff Services: $5,000
- Other Funds - Cash and Securities: $156,734,000
Cash and Securities: $105,880,000
- Short Term Debt Outstanding - Beginning: $200,000,000
End of Fiscal Year: $184,773,000
Beginning: $999,000
End of Fiscal Year: $588,000
- Sinking Funds - Cash and Securities: $27,098,000
Cash and Securities: $19,660,000
- State Intergovernmental - Education: $69,145,000
Education: $66,822,000
Other: $29,337,000
Other: $26,274,000
Health and Hospitals: $13,201,000
General Local Government Support: $2,641,000
Public Welfare: $1,558,000
- Tax - Property: $419,407,000
Property: $411,690,000
Documentary and Stock Transfer: $8,776,000
Documentary and Stock Transfer: $8,338,000
- Total Salaries and Wages: $178,521,000
: $101,886,000
Bergen County government finances - Debt in 2020:
- Assistance and Subsidies - Public Welfare, Federal Categorical Assistance Programs: $8,429,000
Public Welfare, Federal Categorical Assistance Programs: $8,321,000
Public Welfare, Cash Assistance Programs - Other: $2,431,000
Public Welfare, Cash Assistance Programs - Other: $685,000
- Bond Funds - Cash and Securities: $37,199,000
Cash and Securities: $5,892,000
- Charges - Hospital Public: $222,970,000
Hospital Public: $206,875,000
Sewerage: $81,790,000
Sewerage: $78,827,000
Higher Education - Other: $55,323,000
Higher Education - Other: $48,626,000
Elementary and Secondary Education - Other: $45,084,000
Elementary and Secondary Education - Other: $39,667,000
Other: $21,630,000
Parks and Recreation: $9,514,000
Parks and Recreation: $9,160,000
Solid Waste Management: $7,120,000
Solid Waste Management: $7,106,000
Other: $6,580,000
Housing and Community Development: $3,796,000
Housing and Community Development: $2,895,000
Elementary and Secondary Education School Tuition and Transportation: $1,590,000
Elementary and Secondary Education School Tuition and Transportation: $1,440,000
Elementary and Secondary Education School Lunch: $830,000
Elementary and Secondary Education School Lunch: $807,000
Parking Facilities: $411,000
Parking Facilities: $403,000
Higher Education Auxiliary Enterprises: $161,000
Higher Education Auxiliary Enterprises: $104,000
- Construction - Regular Highways: $9,602,000
Elementary and Secondary Education: $6,574,000
Elementary and Secondary Education: $3,047,000
Other Higher Education: $2,756,000
Parks and Recreation: $2,100,000
Sewerage: $1,741,000
Other Higher Education: $1,398,000
Sewerage: $1,141,000
Police Protection: $1,100,000
General - Other: $600,000
Correctional Institutions: $465,000
Public Welfare Institutions: $288,000
General Public Buildings: $215,000
Health - Other: $215,000
- Current Operations - Elementary and Secondary Education: $227,651,000
Elementary and Secondary Education: $220,843,000
Hospitals: $215,561,000
Hospitals: $213,513,000
General - Other: $147,831,000
Other Higher Education: $125,547,000
Other Higher Education: $106,940,000
General - Other: $96,776,000
Housing and Community Development: $53,258,000
Sewerage: $50,941,000
Correctional Institutions: $50,548,000
Housing and Community Development: $50,279,000
Correctional Institutions: $49,907,000
Sewerage: $48,873,000
Police Protection: $42,797,000
Public Welfare - Other: $41,896,000
Judicial and Legal Services: $35,372,000
Judicial and Legal Services: $33,952,000
Public Welfare - Other: $31,706,000
Regular Highways: $22,204,000
Police Protection: $18,840,000
Health - Other: $17,930,000
Health - Other: $16,593,000
Parks and Recreation: $14,833,000
General Public Buildings: $13,465,000
Parks and Recreation: $12,885,000
Central Staff Services: $9,716,000
Public Welfare, Vendor Payments for Medical Care: $9,203,000
Solid Waste Management: $9,091,000
Solid Waste Management: $8,609,000
Central Staff Services: $7,899,000
Financial Administration: $7,636,000
Financial Administration: $7,322,000
Regular Highways: $6,499,000
Public Welfare, Vendor Payments for Other Purposes: $5,099,000
Public Welfare, Vendor Payments for Other Purposes: $3,305,000
Public Welfare Institutions: $2,092,000
Protective Inspection and Regulation - Other: $890,000
Higher Education Auxiliary Enterprises: $466,000
Higher Education Auxiliary Enterprises: $414,000
- Federal Intergovernmental - Housing and Community Development: $46,640,000
Housing and Community Development: $45,584,000
Education: $29,271,000
Education: $24,347,000
Other: $2,782,000
- General - Interest on Debt: $46,714,000
Interest on Debt: $25,965,000
- Intergovernmental to Local - Other - General - Other: $155,000
Other - General - Other: $150,000
Other - Housing and Community Development: $114,000
Other - Housing and Community Development: $100,000
- Intergovernmental to State - Hospitals: $40,836,000
Elementary and Secondary Education: $48,000
Elementary and Secondary Education: $48,000
- Local Intergovernmental - Education: $156,155,000
Education: $143,786,000
Sewerage: $71,698,000
Other: $9,241,000
Other: $8,470,000
Housing and Community Development: $1,274,000
Housing and Community Development: $1,034,000
- Long Term Debt - Beginning Outstanding - Unspecified Public Purpose: $781,096,000
Outstanding Unspecified Public Purpose: $751,356,000
Beginning Outstanding - Unspecified Public Purpose: $700,190,000
Outstanding Unspecified Public Purpose: $684,892,000
Retired Unspecified Public Purpose: $244,980,000
Issue, Unspecified Public Purpose: $215,240,000
Retired Unspecified Public Purpose: $136,288,000
Issue, Unspecified Public Purpose: $120,990,000
- Miscellaneous - General Revenue - Other: $27,469,000
Sale of Property: $16,300,000
Donations From Private Sources: $13,168,000
General Revenue - Other: $11,307,000
Interest Earnings: $5,806,000
Interest Earnings: $3,246,000
Rents: $2,116,000
Fines and Forfeits: $1,315,000
- Other Capital Outlay - General - Other: $7,372,000
Elementary and Secondary Education: $4,890,000
Other Higher Education: $4,680,000
Other Higher Education: $4,662,000
Elementary and Secondary Education: $3,722,000
Regular Highways: $3,285,000
Financial Administration: $1,474,000
Police Protection: $1,450,000
Correctional Institutions: $866,000
Judicial and Legal Services: $770,000
Parks and Recreation: $623,000
Health - Other: $416,000
Public Welfare Institutions: $165,000
Sewerage: $137,000
General Public Building: $110,000
Sewerage: $20,000
Central Staff Services: $5,000
- Other Funds - Cash and Securities: $156,734,000
Cash and Securities: $105,880,000
- Short Term Debt Outstanding - Beginning: $200,000,000
End of Fiscal Year: $184,773,000
Beginning: $999,000
End of Fiscal Year: $588,000
- Sinking Funds - Cash and Securities: $27,098,000
Cash and Securities: $19,660,000
- State Intergovernmental - Education: $69,145,000
Education: $66,822,000
Other: $29,337,000
Other: $26,274,000
Health and Hospitals: $13,201,000
General Local Government Support: $2,641,000
Public Welfare: $1,558,000
- Tax - Property: $419,407,000
Property: $411,690,000
Documentary and Stock Transfer: $8,776,000
Documentary and Stock Transfer: $8,338,000
- Total Salaries and Wages: $178,521,000
: $101,886,000
Bergen County government finances - Cash and Securities in 2020:
- Assistance and Subsidies - Public Welfare, Federal Categorical Assistance Programs: $8,429,000
Public Welfare, Federal Categorical Assistance Programs: $8,321,000
Public Welfare, Cash Assistance Programs - Other: $2,431,000
Public Welfare, Cash Assistance Programs - Other: $685,000
- Bond Funds - Cash and Securities: $37,199,000
Cash and Securities: $5,892,000
- Charges - Hospital Public: $222,970,000
Hospital Public: $206,875,000
Sewerage: $81,790,000
Sewerage: $78,827,000
Higher Education - Other: $55,323,000
Higher Education - Other: $48,626,000
Elementary and Secondary Education - Other: $45,084,000
Elementary and Secondary Education - Other: $39,667,000
Other: $21,630,000
Parks and Recreation: $9,514,000
Parks and Recreation: $9,160,000
Solid Waste Management: $7,120,000
Solid Waste Management: $7,106,000
Other: $6,580,000
Housing and Community Development: $3,796,000
Housing and Community Development: $2,895,000
Elementary and Secondary Education School Tuition and Transportation: $1,590,000
Elementary and Secondary Education School Tuition and Transportation: $1,440,000
Elementary and Secondary Education School Lunch: $830,000
Elementary and Secondary Education School Lunch: $807,000
Parking Facilities: $411,000
Parking Facilities: $403,000
Higher Education Auxiliary Enterprises: $161,000
Higher Education Auxiliary Enterprises: $104,000
- Construction - Regular Highways: $9,602,000
Elementary and Secondary Education: $6,574,000
Elementary and Secondary Education: $3,047,000
Other Higher Education: $2,756,000
Parks and Recreation: $2,100,000
Sewerage: $1,741,000
Other Higher Education: $1,398,000
Sewerage: $1,141,000
Police Protection: $1,100,000
General - Other: $600,000
Correctional Institutions: $465,000
Public Welfare Institutions: $288,000
General Public Buildings: $215,000
Health - Other: $215,000
- Current Operations - Elementary and Secondary Education: $227,651,000
Elementary and Secondary Education: $220,843,000
Hospitals: $215,561,000
Hospitals: $213,513,000
General - Other: $147,831,000
Other Higher Education: $125,547,000
Other Higher Education: $106,940,000
General - Other: $96,776,000
Housing and Community Development: $53,258,000
Sewerage: $50,941,000
Correctional Institutions: $50,548,000
Housing and Community Development: $50,279,000
Correctional Institutions: $49,907,000
Sewerage: $48,873,000
Police Protection: $42,797,000
Public Welfare - Other: $41,896,000
Judicial and Legal Services: $35,372,000
Judicial and Legal Services: $33,952,000
Public Welfare - Other: $31,706,000
Regular Highways: $22,204,000
Police Protection: $18,840,000
Health - Other: $17,930,000
Health - Other: $16,593,000
Parks and Recreation: $14,833,000
General Public Buildings: $13,465,000
Parks and Recreation: $12,885,000
Central Staff Services: $9,716,000
Public Welfare, Vendor Payments for Medical Care: $9,203,000
Solid Waste Management: $9,091,000
Solid Waste Management: $8,609,000
Central Staff Services: $7,899,000
Financial Administration: $7,636,000
Financial Administration: $7,322,000
Regular Highways: $6,499,000
Public Welfare, Vendor Payments for Other Purposes: $5,099,000
Public Welfare, Vendor Payments for Other Purposes: $3,305,000
Public Welfare Institutions: $2,092,000
Protective Inspection and Regulation - Other: $890,000
Higher Education Auxiliary Enterprises: $466,000
Higher Education Auxiliary Enterprises: $414,000
- Federal Intergovernmental - Housing and Community Development: $46,640,000
Housing and Community Development: $45,584,000
Education: $29,271,000
Education: $24,347,000
Other: $2,782,000
- General - Interest on Debt: $46,714,000
Interest on Debt: $25,965,000
- Intergovernmental to Local - Other - General - Other: $155,000
Other - General - Other: $150,000
Other - Housing and Community Development: $114,000
Other - Housing and Community Development: $100,000
- Intergovernmental to State - Hospitals: $40,836,000
Elementary and Secondary Education: $48,000
Elementary and Secondary Education: $48,000
- Local Intergovernmental - Education: $156,155,000
Education: $143,786,000
Sewerage: $71,698,000
Other: $9,241,000
Other: $8,470,000
Housing and Community Development: $1,274,000
Housing and Community Development: $1,034,000
- Long Term Debt - Beginning Outstanding - Unspecified Public Purpose: $781,096,000
Outstanding Unspecified Public Purpose: $751,356,000
Beginning Outstanding - Unspecified Public Purpose: $700,190,000
Outstanding Unspecified Public Purpose: $684,892,000
Retired Unspecified Public Purpose: $244,980,000
Issue, Unspecified Public Purpose: $215,240,000
Retired Unspecified Public Purpose: $136,288,000
Issue, Unspecified Public Purpose: $120,990,000
- Miscellaneous - General Revenue - Other: $27,469,000
Sale of Property: $16,300,000
Donations From Private Sources: $13,168,000
General Revenue - Other: $11,307,000
Interest Earnings: $5,806,000
Interest Earnings: $3,246,000
Rents: $2,116,000
Fines and Forfeits: $1,315,000
- Other Capital Outlay - General - Other: $7,372,000
Elementary and Secondary Education: $4,890,000
Other Higher Education: $4,680,000
Other Higher Education: $4,662,000
Elementary and Secondary Education: $3,722,000
Regular Highways: $3,285,000
Financial Administration: $1,474,000
Police Protection: $1,450,000
Correctional Institutions: $866,000
Judicial and Legal Services: $770,000
Parks and Recreation: $623,000
Health - Other: $416,000
Public Welfare Institutions: $165,000
Sewerage: $137,000
General Public Building: $110,000
Sewerage: $20,000
Central Staff Services: $5,000
- Other Funds - Cash and Securities: $156,734,000
Cash and Securities: $105,880,000
- Short Term Debt Outstanding - Beginning: $200,000,000
End of Fiscal Year: $184,773,000
Beginning: $999,000
End of Fiscal Year: $588,000
- Sinking Funds - Cash and Securities: $27,098,000
Cash and Securities: $19,660,000
- State Intergovernmental - Education: $69,145,000
Education: $66,822,000
Other: $29,337,000
Other: $26,274,000
Health and Hospitals: $13,201,000
General Local Government Support: $2,641,000
Public Welfare: $1,558,000
- Tax - Property: $419,407,000
Property: $411,690,000
Documentary and Stock Transfer: $8,776,000
Documentary and Stock Transfer: $8,338,000
- Total Salaries and Wages: $178,521,000
: $101,886,000
Supplemental Security Income (SSI) in 2006:
- Total number of recipients: 10,317
- Number of aged recipients: 4,496
- Number of blind and disabled recipients: 5,821
- Number of recipients under 18: 678
- Number of recipients between 18 and 64: 3,964
- Number of recipients older than 64: 5,675
- Number of recipients also receiving OASDI: 3,040
- Amount of payments (thousands of dollars): 4,662
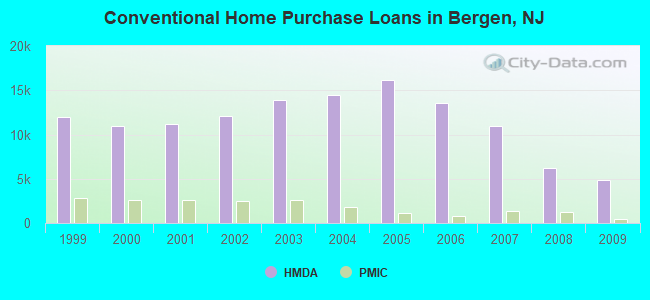
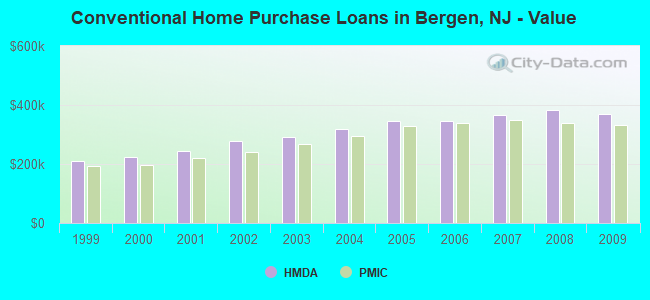
| Home Mortgage Disclosure Act Aggregated Statistics For Year 2009 (Based on 163 full tracts) | ||||||||||||||
| A) FHA, FSA/RHS & VA Home Purchase Loans | B) Conventional Home Purchase Loans | C) Refinancings | D) Home Improvement Loans | E) Loans on Dwellings For 5+ Families | F) Non-occupant Loans on < 5 Family Dwellings (A B C & D) | G) Loans On Manufactured Home Dwelling (A B C & D) | ||||||||
|---|---|---|---|---|---|---|---|---|---|---|---|---|---|---|
| Number | Average Value | Number | Average Value | Number | Average Value | Number | Average Value | Number | Average Value | Number | Average Value | Number | Average Value | |
| LOANS ORIGINATED | 1,534 | $334,807 | 4,856 | $367,814 | 19,782 | $330,079 | 1,128 | $185,584 | 53 | $3,236,981 | 584 | $304,810 | 7 | $87,000 |
| APPLICATIONS APPROVED, NOT ACCEPTED | 134 | $346,015 | 580 | $384,898 | 1,718 | $332,762 | 161 | $122,627 | 4 | $1,545,000 | 78 | $338,205 | 1 | $102,000 |
| APPLICATIONS DENIED | 357 | $337,759 | 906 | $363,405 | 7,404 | $353,788 | 733 | $121,420 | 7 | $5,164,286 | 433 | $251,224 | 6 | $162,667 |
| APPLICATIONS WITHDRAWN | 280 | $326,732 | 665 | $368,164 | 4,220 | $341,656 | 193 | $202,337 | 7 | $607,000 | 158 | $295,266 | 2 | $259,500 |
| FILES CLOSED FOR INCOMPLETENESS | 100 | $324,860 | 218 | $326,601 | 1,329 | $354,747 | 90 | $148,089 | 3 | $10,258,333 | 56 | $272,196 | 1 | $30,000 |
| Private Mortgage Insurance Companies Aggregated Statistics For Year 2009 (Based on 156 full tracts) | ||||||
| A) Conventional Home Purchase Loans | B) Refinancings | C) Non-occupant Loans on < 5 Family Dwellings (A & B) | ||||
|---|---|---|---|---|---|---|
| Number | Average Value | Number | Average Value | Number | Average Value | |
| LOANS ORIGINATED | 493 | $333,144 | 196 | $353,745 | 0 | $0 |
| APPLICATIONS APPROVED, NOT ACCEPTED | 203 | $351,232 | 127 | $361,362 | 0 | $0 |
| APPLICATIONS DENIED | 131 | $312,962 | 142 | $367,923 | 0 | $0 |
| APPLICATIONS WITHDRAWN | 62 | $323,323 | 59 | $343,780 | 0 | $0 |
| FILES CLOSED FOR INCOMPLETENESS | 21 | $337,429 | 10 | $342,900 | 1 | $325,000 |
| Most common first names in Bergen County, NJ among deceased individuals | ||
| Name | Count | Lived (average) |
|---|---|---|
| John | 9,137 | 74.7 years |
| Mary | 7,920 | 81.1 years |
| Joseph | 6,348 | 75.2 years |
| William | 5,486 | 75.3 years |
| Anna | 4,726 | 82.7 years |
| Helen | 3,862 | 80.4 years |
| Frank | 3,702 | 76.1 years |
| George | 3,632 | 75.5 years |
| Charles | 3,498 | 75.8 years |
| Margaret | 3,472 | 80.1 years |
| Most common last names in Bergen County, NJ among deceased individuals | ||
| Last name | Count | Lived (average) |
|---|---|---|
| Smith | 1,192 | 77.2 years |
| Miller | 774 | 77.3 years |
| Johnson | 630 | 76.5 years |
| Brown | 577 | 76.0 years |
| Murphy | 449 | 75.6 years |
| Williams | 444 | 74.6 years |
| Jones | 431 | 74.4 years |
| Kelly | 407 | 75.9 years |
| Anderson | 392 | 77.9 years |
| Martin | 388 | 76.4 years |
| Businesses in Bergen County, NJ | ||||
| Name | Count | Name | Count | |
|---|---|---|---|---|
| 24 Hour Fitness | 2 | IHOP | 5 | |
| 7-Eleven | 39 | J. Jill | 1 | |
| A&P | 9 | J.Crew | 4 | |
| ALDO | 3 | JCPenney | 1 | |
| AMF Bowling | 1 | Jamba Juice | 2 | |
| AT&T | 21 | JoS. A. Bank | 4 | |
| Abercrombie & Fitch | 2 | Johnny Rockets | 1 | |
| Abercrombie Kids | 1 | Jones New York | 6 | |
| Ace Hardware | 2 | Journeys | 1 | |
| Advance Auto Parts | 5 | Justice | 2 | |
| Aeropostale | 3 | KFC | 11 | |
| Aerosoles | 2 | Kincaid | 1 | |
| American Eagle Outfitters | 1 | Kmart | 5 | |
| Ann Taylor | 7 | Kohl's | 2 | |
| Apple Store | 2 | Kroger | 1 | |
| Applebee's | 4 | La Quinta | 1 | |
| Arby's | 1 | La-Z-Boy | 3 | |
| Ashley Furniture | 1 | Lane Furniture | 3 | |
| Audi | 3 | LensCrafters | 6 | |
| AutoZone | 4 | Lowe's | 2 | |
| Avenue | 6 | Macy's | 3 | |
| BMW | 3 | Marriott | 10 | |
| Baja Fresh Mexican Grill | 1 | Marshalls | 5 | |
| Bakers | 2 | MasterBrand Cabinets | 62 | |
| Bally Total Fitness | 2 | McDonald's | 19 | |
| Banana Republic | 5 | Men's Wearhouse | 4 | |
| Barnes & Noble | 2 | Motherhood Maternity | 3 | |
| Baskin-Robbins | 26 | New Balance | 21 | |
| Bath & Body Works | 4 | New York & Co | 4 | |
| Bebe | 1 | Nike | 49 | |
| Bed Bath & Beyond | 4 | Nissan | 5 | |
| Ben & Jerry's | 3 | Nordstrom | 2 | |
| Best Cellars | 1 | Office Depot | 1 | |
| Best Western | 3 | Old Navy | 3 | |
| Blockbuster | 13 | Olive Garden | 1 | |
| Brooks Brothers | 2 | On The Border | 1 | |
| Brookstone | 3 | Outback | 2 | |
| Brunswick Bowling & Billiards | 1 | Outback Steakhouse | 2 | |
| Budget Car Rental | 4 | Pac Sun | 1 | |
| Burger King | 20 | Panera Bread | 8 | |
| Buybuy BABY | 1 | Papa John's Pizza | 5 | |
| CVS | 38 | Pathmark | 6 | |
| Cache | 2 | Payless | 14 | |
| Casual Male XL | 2 | Penske | 4 | |
| Catherines | 1 | PetSmart | 1 | |
| Century 21 | 1 | Pier 1 Imports | 4 | |
| Charlotte Russe | 2 | Pizza Hut | 7 | |
| Chevrolet | 3 | Popeyes | 7 | |
| Chick-Fil-A | 1 | Pottery Barn | 2 | |
| Chico's | 7 | Pottery Barn Kids | 1 | |
| Chipotle | 2 | Qdoba Mexican Grill | 2 | |
| Cinnabon | 4 | Quality | 1 | |
| Circle K | 5 | Quiznos | 4 | |
| Clarks | 1 | RadioShack | 19 | |
| Cold Stone Creamery | 3 | Ramada | 1 | |
| Coldwater Creek | 1 | Raymour & Flanigan | 1 | |
| Comfort Inn | 2 | Red Lobster | 1 | |
| Comfort Suites | 1 | Rite Aid | 18 | |
| Costco | 1 | Ruby Tuesday | 1 | |
| Crate & Barrel | 1 | Ryder Rental & Truck Leasing | 1 | |
| Curves | 3 | SONIC Drive-In | 1 | |
| DHL | 6 | Saks Fifth Avenue | 1 | |
| Dairy Queen | 15 | Sears | 12 | |
| Days Inn | 1 | Sephora | 2 | |
| Decora Cabinetry | 20 | Sheraton | 1 | |
| Domino's Pizza | 6 | Skechers USA | 2 | |
| DressBarn | 6 | Soma Intimates | 2 | |
| Dressbarn | 6 | Sprint Nextel | 9 | |
| Dunkin Donuts | 104 | Staples | 12 | |
| Econo Lodge | 2 | Starbucks | 31 | |
| Express | 4 | Stop & Shop | 12 | |
| Extended Stay America | 2 | Subaru | 3 | |
| Famous Footwear | 1 | Subway | 7 | |
| Fashion Bug | 1 | Super 8 | 1 | |
| FedEx | 212 | T-Mobile | 2 | |
| Finish Line | 1 | T.G.I. Driday's | 2 | |
| Firestone Complete Auto Care | 5 | T.J.Maxx | 5 | |
| Food Basics | 2 | Taco Bell | 7 | |
| Foot Locker | 2 | Talbots | 5 | |
| Ford | 5 | Target | 3 | |
| Forever 21 | 1 | The Cheesecake Factory | 1 | |
| GNC | 20 | The Room Place | 6 | |
| GameStop | 18 | Toyota | 5 | |
| Gap | 10 | Toys"R"Us | 10 | |
| Goodwill | 4 | Trader Joe's | 3 | |
| Gymboree | 6 | True Value | 10 | |
| H&M | 2 | U-Haul | 23 | |
| H&R Block | 24 | UPS | 289 | |
| Haagen-Dazs | 1 | Urban Outfitters | 1 | |
| Harmon Face Values | 6 | Verizon Wireless | 8 | |
| Haworth | 1 | Victoria's Secret | 6 | |
| Hilton | 10 | Volkswagen | 4 | |
| Holiday Inn | 9 | Walgreens | 18 | |
| Hollister Co. | 2 | Walmart | 2 | |
| Home Depot | 3 | Wendy's | 14 | |
| Homestead Studio Suites | 1 | Wet Seal | 1 | |
| Honda | 2 | White Castle | 2 | |
| Hot Topic | 1 | Whole Foods Market | 4 | |
| Houlihan's | 3 | Wine & Spirits | 1 | |
| Howard Johnson | 1 | World Gym | 1 | |
| Hyatt | 1 | YMCA | 6 | |
| Hyundai | 2 | |||
Bergen County on our top lists:
- #11 on the list of "Top 101 counties with the largest number of people without health insurance coverage in 2000 (pop. 50,000+)"
- #11 on the list of "Top 101 counties with the most Orthodox adherents"
- #11 on the list of "Top 101 counties with the most Orthodox adherents (pop. 50,000+)"
- #14 on the list of "Top 101 counties with the lowest number of infant deaths per 1000 residents 2007-2013 (pop. 50,000+)"
- #15 on the list of "Top 101 counties with the most Orthodox congregations (pop. 50,000+)"
- #16 on the list of "Top 101 counties with the most Orthodox congregations"
- #19 on the list of "Top 101 counties with the most Mainline Protestant congregations"
- #19 on the list of "Top 101 counties with the most Mainline Protestant congregations (pop. 50,000+)"
- #20 on the list of "Top 101 counties with the lowest percentage of residents that keep firearms around their homes"
- #20 on the list of "Top 101 counties with the most Catholic adherents"
- #20 on the list of "Top 101 counties with the most Catholic adherents (pop. 50,000+)"
- #24 on the list of "Top 101 counties with the most Catholic congregations"
- #24 on the list of "Top 101 counties with the most Catholic congregations (pop. 50,000+)"
- #30 on the list of "Top 101 counties with the highest percentage of residents that visited a dentist within the past year"
- #37 on the list of "Top 101 counties with the lowest Ozone (1-hour) air pollution readings in 2012 (ppm)"
- #42 on the list of "Top 101 counties with the most Other congregations (pop. 50,000+)"
- #43 on the list of "Top 101 counties with the most Other congregations"
- #45 on the list of "Top 101 counties with the largest decrease in the number of infant deaths per 1000 residents 2000-2006 to 2007-2013 (pop. 50,000+)"
- #46 on the list of "Top 101 counties with the most Other adherents"
- #46 on the list of "Top 101 counties with the most Other adherents (pop. 50,000+)"