Hunterdon County, New Jersey (NJ)
County owner-occupied free and clear houses and condos in 2010: 9,210
County owner-occupied houses and condos in 2000: 36,549
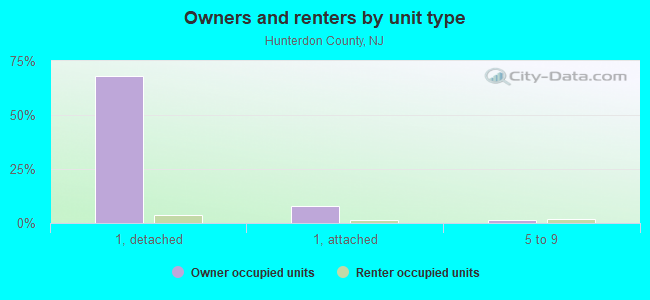
Renter-occupied apartments: 7,589 (it was 7,129 in 2000)
| % of renters here: | 16% |
| State: | 35% |
Land area: 430 sq. mi.
Water area: 7.8 sq. mi.
Population density: 302 people per square mile (high).
Industries providing employment: Educational, health and social services (22.4%), Professional, scientific, management, administrative, and waste management services (16.4%), Manufacturing (12.7%).
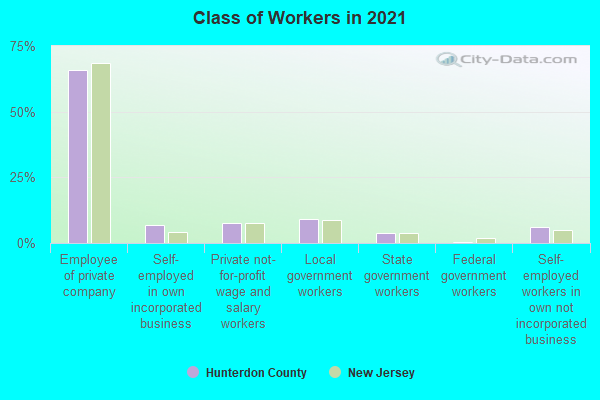
Type of workers:
- Private wage or salary: 79%
- Government: 15%
- Self-employed, not incorporated: 6%
- Unpaid family work: 0%
- OSM Map
- General Map
- Google Map
- MSN Map

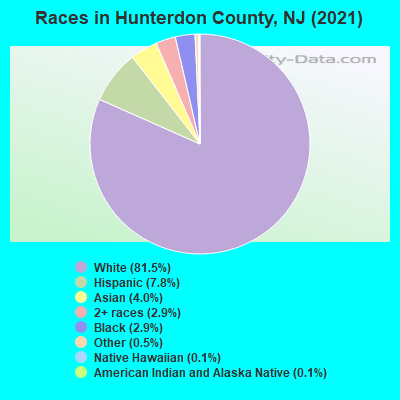
- 104,37880.4%White Non-Hispanic Alone
- 10,4198.0%Hispanic or Latino
- 5,9724.6%Asian alone
- 4,7343.6%Two or more races
- 3,4192.6%Black Non-Hispanic Alone
- 7980.6%Some other race alone
- 570.04%American Indian and Alaska Native alone
| Median resident age: | 46.3 years |
| New Jersey median age: | 40.4 years |
| Males: 63,998 | |
| Females: 65,779 |

 | LGBT Hunterdon County (14 replies) |
| Hunterdon County--Whitehouse Station (1 reply) |
| New Jersey Walkable towns (86 replies) |
| Recon - Potential move to NJ (21 replies) |
| NJ Cities/Large Suburbs, Ranked (56 replies) |
| The rural Jersey thread (302 replies) |
| Hunterdon County: | 2.0 people |
| New Jersey: | 3 people |
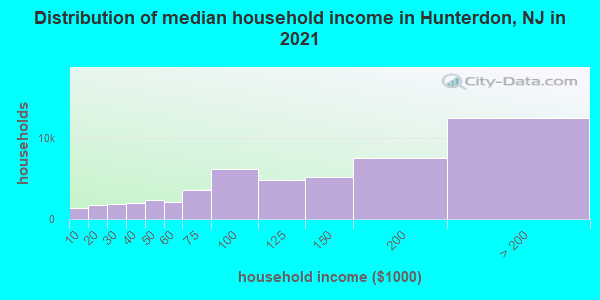
Estimated median household income in 2022: $142,518 ($79,888 in 1999)
| This county: | $142,518 |
| New Jersey: | $96,346 |
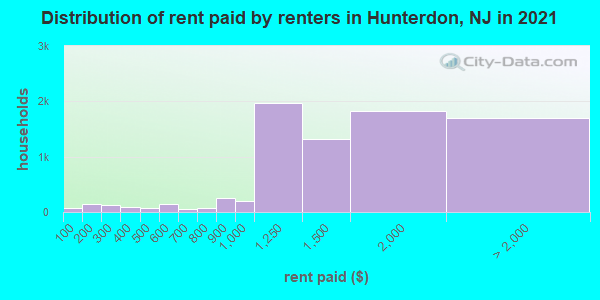
Median contract rent in 2022 for apartments: $1,483 (lower quartile is $1,214, upper quartile is $2,021)
| This county: | $1483 |
| State: | $1399 |
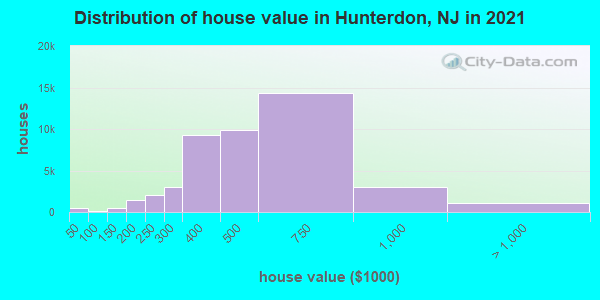
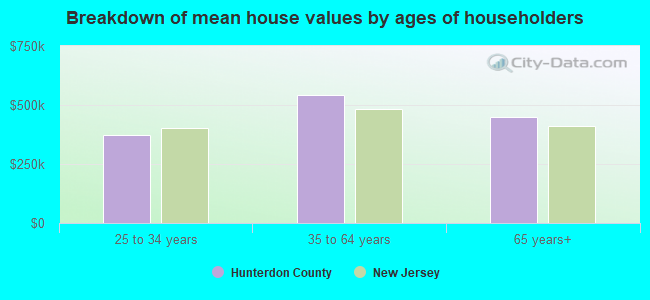
Estimated median house or condo value in 2022: $480,200 (it was $246,700 in 2000)
| Hunterdon: | $480,200 |
| New Jersey: | $428,900 |
Mean price in 2022:
Median monthly housing costs for homes and condos with a mortgage: $2,796Detached houses: $544,766
Here: $544,766 State: $537,591 Townhouses or other attached units: $427,886
Here: $427,886 State: $381,113 In 2-unit structures: $378,121
Here: $378,121 State: $444,476 In 3-to-4-unit structures: $339,996
Here: $339,996 State: $457,463 In 5-or-more-unit structures: $247,029
Here: $247,029 State: $368,745 Mobile homes: $41,970
Here: $41,970 State: $119,788
Median monthly housing costs for units without a mortgage: $1,280
Institutionalized population: 4,318
Crime in 2020 (reported by the sheriff's office or county police, not the county total):
- Murders: 0
- Rapes: 0
- Robberies: 0
- Assaults: 0
- Burglaries: 0
- Thefts: 0
- Auto thefts: 0
Crime in 2019 (reported by the sheriff's office or county police, not the county total):
- Murders: 0
- Rapes: 0
- Robberies: 0
- Assaults: 0
- Burglaries: 0
- Thefts: 0
- Auto thefts: 0
Health of residents in Hunterdon County based on CDC Behavioral Risk Factor Surveillance System Survey Questionnaires from 2003 to 2012:
General health status score of residents in this county from 1 (poor) to 5 (excellent) is 3.8. This is significantly better than average.79.7% of residents exercised in the past month. This is about average.
44.3% of residents smoked 100+ cigarettes in their lives. This is about average.
88.0% of adult residents drank alcohol in the past 30 days. This is more than average.
83.3% of residents visited a dentist within the past year. This is more than average.
Average weight of males is 192 pounds. This is about average.
Average weight of females is 152 pounds. This is less than average.
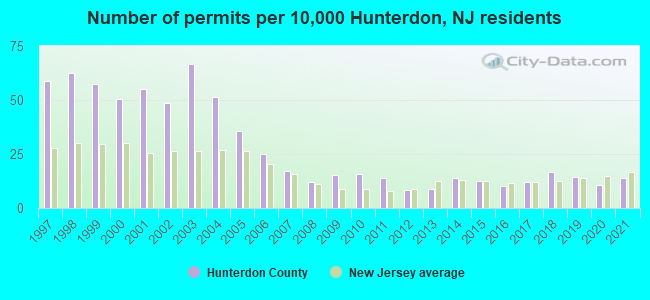
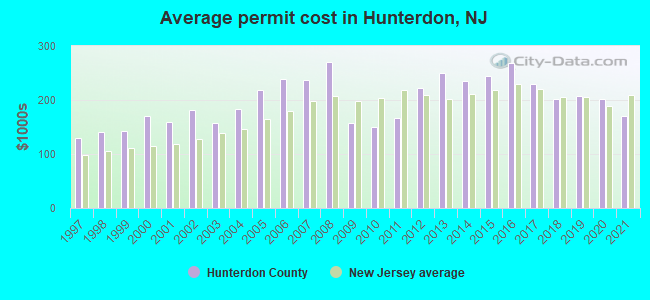
Single-family new house construction building permits:
- 2022: 135 buildings, average cost: $272,900
- 2021: 171 buildings, average cost: $169,500
- 2020: 130 buildings, average cost: $201,900
- 2019: 177 buildings, average cost: $207,400
- 2018: 205 buildings, average cost: $202,300
- 2017: 146 buildings, average cost: $229,400
- 2016: 122 buildings, average cost: $267,900
- 2015: 151 buildings, average cost: $244,100
- 2014: 171 buildings, average cost: $235,300
- 2013: 106 buildings, average cost: $250,200
- 2012: 100 buildings, average cost: $221,800
- 2011: 171 buildings, average cost: $167,200
- 2010: 194 buildings, average cost: $150,400
- 2009: 189 buildings, average cost: $156,600
- 2008: 146 buildings, average cost: $269,500
- 2007: 211 buildings, average cost: $237,100
- 2006: 305 buildings, average cost: $238,100
- 2005: 436 buildings, average cost: $217,500
- 2004: 627 buildings, average cost: $182,500
- 2003: 814 buildings, average cost: $158,200
- 2002: 593 buildings, average cost: $182,000
- 2001: 671 buildings, average cost: $158,600
- 2000: 616 buildings, average cost: $170,100
- 1999: 701 buildings, average cost: $142,800
- 1998: 764 buildings, average cost: $140,400
- 1997: 720 buildings, average cost: $129,600
Median real estate property taxes paid for housing units with mortgages in 2022: $10,001 (2.0%)
Median real estate property taxes paid for housing units with no mortgage in 2022: $9,795 (2.2%)
| Hunterdon County: | 3.6% |
| New Jersey: | 9.7% |
Median age of residents in 2022: 46.3 years old
(Males: 45.7 years old, Females: 47.0 years old)
(Median age for: White residents: 50.1 years old, Black residents: 40.6 years old, American Indian residents: 63.2 years old, Asian residents: 42.3 years old, Hispanic or Latino residents: 35.2 years old, Other race residents: 45.2 years old)
Area name: Middlesex-Somerset-Hunterdon, NJ HUD Metro FMR Area
Fair market rent in 2006 for a 1-bedroom apartment in Hunterdon County is $1009 a month.
Fair market rent for a 2-bedroom apartment is $1187 a month.
Fair market rent for a 3-bedroom apartment is $1490 a month.
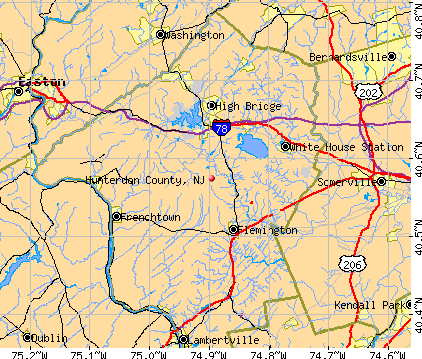
Cities in this county include: Flemington, Lambertville, High Bridge, Clinton, White House Station, Glen Gardner, Hampton, Frenchtown, Annandale, Milford.
2023 air pollution in Hunterdon County:
Ozone (1-hour): 0.031 ppm (standard limit: 0.12 ppm). Near U.S. average.
Particulate Matter (PM2.5) Annual: 10.4 µg/m3(standard limit: 15.0 µg/m3). Near U.S. average.
Neighboring counties: Bergen County  , Middlesex County
  , Pershing County, Nevada
  , Plumas County, California , Westmoreland County, Pennsylvania , Peoria County, Illinois .
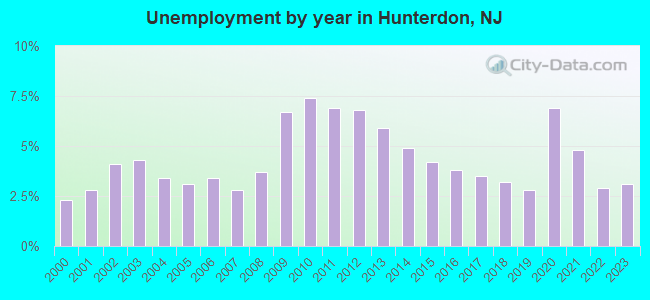
| Here: | 3.5% |
| New Jersey: | 4.5% |
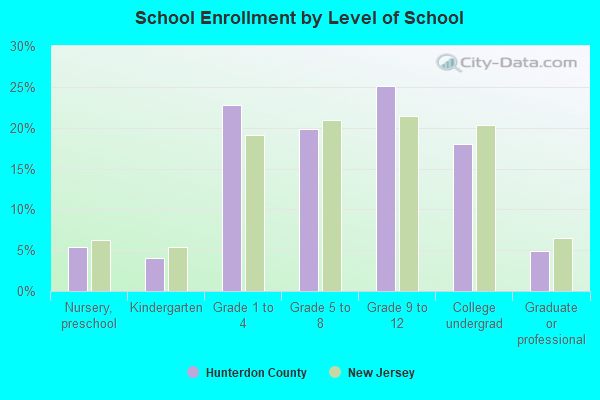
Current college students: 4,876
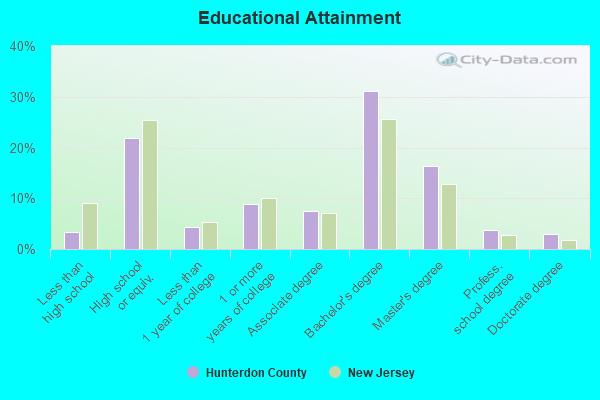
People 25 years of age or older with a high school degree or higher: 96.3%
People 25 years of age or older with a bachelor's degree or higher: 58.7%
Number of foreign born residents: 13,894 (62.6% naturalized citizens)
| Hunterdon County: | 10.7% |
| Whole state: | 23.5% |
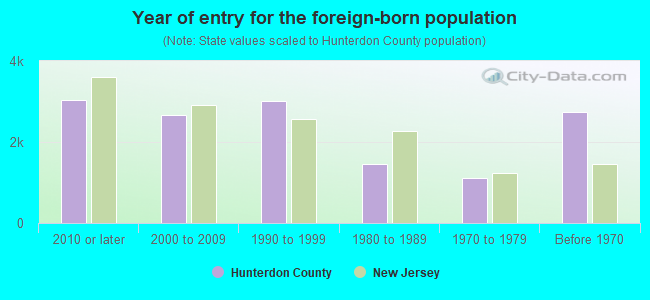
- Year of entry for the foreign-born population
- 3,2562010 or later
- 3,2432000 to 2009
- 2,8241990 to 1999
- 1,4551980 to 1989
- 1,1141970 to 1979
- 2,749Before 1970
Mean travel time to work (commute): minutes
Percentage of county residents living and working in this county: 91.2%
Housing units in structures:
- One, detached: 37,372
- One, attached: 7,367
- Two: 1,887
- 3 or 4: 1,839
- 5 to 9: 745
- 10 to 19: 1,599
- 20 to 49: 455
- 50 or more: 671
- Mobile homes: 17
Housing units in Hunterdon County with a mortgage: 28,822 (2,631 second mortgage, 26 home equity loan, 2,497 both second mortgage and home equity loan)
Houses without a mortgage: 1,254
| Here: | 96.6% with mortgage |
| State: | 95.9% with mortgage |
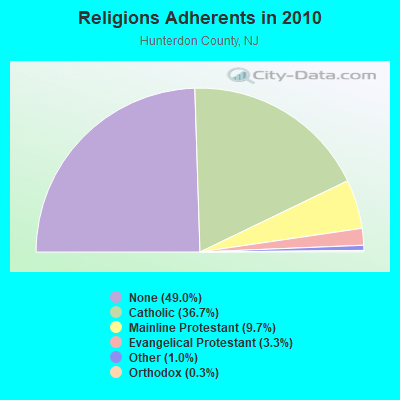
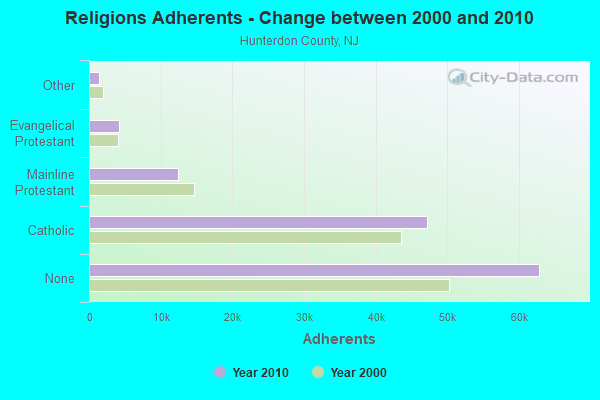
Religion statistics for Hunterdon County
| Religion | Adherents | Congregations |
|---|---|---|
| Catholic | 47,122 | 10 |
| Mainline Protestant | 12,472 | 61 |
| Evangelical Protestant | 4,222 | 27 |
| Other | 1,336 | 11 |
| Orthodox | 362 | 2 |
| None | 62,835 | - |
Source: Clifford Grammich, Kirk Hadaway, Richard Houseal, Dale E.Jones, Alexei Krindatch, Richie Stanley and Richard H.Taylor. 2012. 2010 U.S.Religion Census: Religious Congregations & Membership Study. Association of Statisticians of American Religious Bodies. Jones, Dale E., et al. 2002. Congregations and Membership in the United States 2000. Nashville, TN: Glenmary Research Center.
Food Environment Statistics:
| Hunterdon County: | 1.94 / 10,000 pop. |
| State: | 2.90 / 10,000 pop. |
| Here: | 0.08 / 10,000 pop. |
| New Jersey: | 0.06 / 10,000 pop. |
| This county: | 1.24 / 10,000 pop. |
| New Jersey: | 1.76 / 10,000 pop. |
| Hunterdon County: | 1.32 / 10,000 pop. |
| New Jersey: | 0.81 / 10,000 pop. |
| This county: | 8.53 / 10,000 pop. |
| State: | 7.15 / 10,000 pop. |
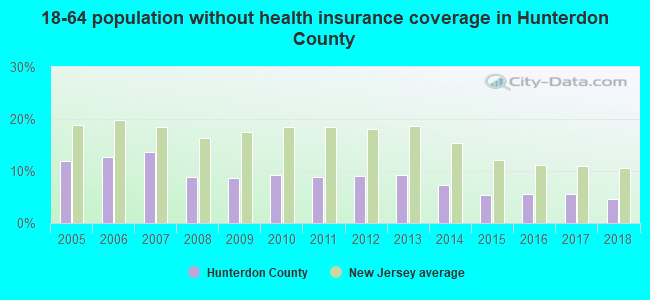
| Hunterdon County: | 6.8% |
| New Jersey: | 8.3% |
| Hunterdon County: | 18.8% |
| State: | 23.3% |
| Here: | 17.4% |
| State: | 18.0% |
Agriculture in Hunterdon County:
Average size of farms: 72 acresAverage value of agricultural products sold per farm: $27,917
Average value of crops sold per acre for harvested cropland: $628.87
The value of nursery, greenhouse, floriculture, and sod as a percentage of the total market value of agricultural products sold: 58.67%
The value of livestock, poultry, and their products as a percentage of the total market value of agricultural products sold: 17.89%
Average total farm production expenses per farm: $37,453
Harvested cropland as a percentage of land in farms: 50.52%
Irrigated harvested cropland as a percentage of land in farms: 1.90%
Average market value of all machinery and equipment per farm: $41,567
The percentage of farms operated by a family or individual: 89.96%
Average age of principal farm operators: 56 years
Average number of cattle and calves per 100 acres of all land in farms: 5.46
Milk cows as a percentage of all cattle and calves: 12.03%
Corn for grain: 6171 harvested acres
All wheat for grain: 3311 harvested acres
Soybeans for beans: 6374 harvested acres
Vegetables: 747 harvested acres
Land in orchards: 633 acres
Earthquake activity:
Hunterdon County-area historical earthquake activity is significantly above New Jersey state average. It is 67% smaller than the overall U.S. average.On 8/23/2011 at 17:51:04, a magnitude 5.8 (5.8 MW, Depth: 3.7 mi, Class: Moderate, Intensity: VI - VII) earthquake occurred 245.8 miles away from Hunterdon County center
On 1/16/1994 at 01:49:16, a magnitude 4.6 (4.6 MB, 4.6 LG, Depth: 3.1 mi, Class: Light, Intensity: IV - V) earthquake occurred 62.3 miles away from the county center
On 10/7/1983 at 10:18:46, a magnitude 5.3 (5.1 MB, 5.3 LG, 5.1 ML) earthquake occurred 235.5 miles away from the county center
On 1/16/1994 at 00:42:43, a magnitude 4.2 (4.2 MB, 4.0 LG, Depth: 3.1 mi) earthquake occurred 60.9 miles away from the county center
On 4/20/2002 at 10:50:47, a magnitude 5.3 (5.3 ML, Depth: 3.0 mi) earthquake occurred 279.2 miles away from Hunterdon County center
On 4/20/2002 at 10:50:47, a magnitude 5.2 (5.2 MB, 4.2 MS, 5.2 MW, 5.0 MW) earthquake occurred 277.3 miles away from the county center
Magnitude types: regional Lg-wave magnitude (LG), body-wave magnitude (MB), local magnitude (ML), surface-wave magnitude (MS), moment magnitude (MW)
Most recent natural disasters:
- New Jersey Covid-19 Pandemic, Incident Period: January 20, 2020, Major Disaster (Presidential) Declared DR-4488-NJ: March 25, 2020, FEMA Id: 4488, Natural disaster type: Other
- New Jersey Severe Winter Storm and Snowstorm, Incident Period: January 22, 2016 to January 24, 2016, Major Disaster (Presidential) Declared DR-4264: March 14, 2016, FEMA Id: 4264, Natural disaster type: Snowstorm, Winter Storm
- New Jersey Hurricane Sandy, Incident Period: October 26, 2012 to November 08, 2012, Emergency Declared EM-3354: October 28, 2012, FEMA Id: 3354, Natural disaster type: Hurricane
- New Jersey Hurricane Sandy, Incident Period: October 26, 2012 to November 08, 2012, Major Disaster (Presidential) Declared DR-4086: October 30, 2012, FEMA Id: 4086, Natural disaster type: Hurricane
- New Jersey Severe Storm, Incident Period: October 29, 2011, Major Disaster (Presidential) Declared DR-4048: November 30, 2011, FEMA Id: 4048, Natural disaster type: Storm
- New Jersey Remnants of Tropical Storm Lee, Incident Period: September 28, 2011 to October 06, 2011, Major Disaster (Presidential) Declared DR-4039: October 14, 2011, FEMA Id: 4039, Natural disaster type: Tropical Storm
- New Jersey Hurricane Irene, Incident Period: August 27, 2011 to September 05, 2011, Major Disaster (Presidential) Declared DR-4021: August 31, 2011, FEMA Id: 4021, Natural disaster type: Hurricane
- New Jersey Hurricane Irene, Incident Period: August 26, 2011 to September 05, 2011, Emergency Declared EM-3332: August 27, 2011, FEMA Id: 3332, Natural disaster type: Hurricane
- New Jersey Severe Storms and Flooding, Incident Period: March 12, 2010 to April 15, 2010, Major Disaster (Presidential) Declared DR-1897: April 02, 2010, FEMA Id: 1897, Natural disaster type: Storm, Flood
- New Jersey Severe Storms and Flooding, Incident Period: June 23, 2006 to July 10, 2006, Major Disaster (Presidential) Declared DR-1653: July 07, 2006, FEMA Id: 1653, Natural disaster type: Storm, Flood
- 13 other natural disasters have been reported since 1953.
The number of natural disasters in Hunterdon County (23) is greater than the US average (15).
Major Disasters (Presidential) Declared: 14
Emergencies Declared: 9
Causes of natural disasters: Hurricanes: 7, Floods: 4, Storms: 4, Blizzards: 2, Snowstorms: 2, Water Shortages: 2, Heavy Rain: 1, Tropical Depression: 1, Tropical Storm: 1, Winter Storm: 1, Other: 3 (Note: some incidents may be assigned to more than one category).
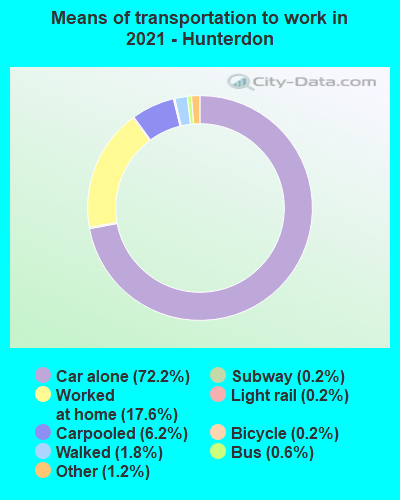
Means of transportation to work:
- Drove a car alone: 37,955 (65.1%)
- Carpooled: 3,352 (5.8%)
- Bus: 343 (0.6%)
- Subway or elevated rail: 66 (0.1%)
- Light rail, streetcar or trolley: 108 (0.2%)
- Taxicab, motorcycle, or other means: 758 (1.3%)
- Bicycle: 130 (0.2%)
- Walked: 1,157 (2.0%)
- Worked at home: 15,434 (26.5%)
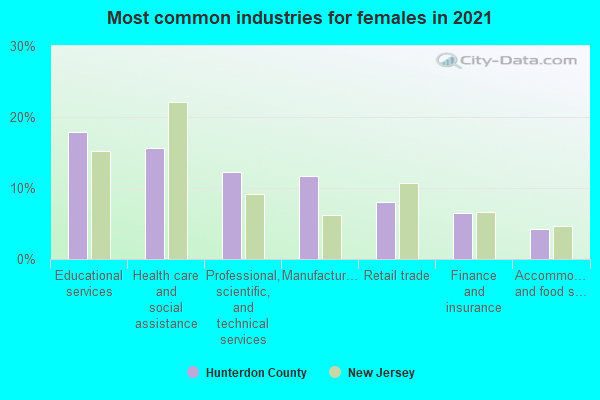
- Educational services (18%)
- Health care and social assistance (15%)
- Professional, scientific, and technical services (10%)
- Retail trade (8%)
- Finance and insurance (6%)
- Manufacturing (6%)
- Accommodation and food services (4%)
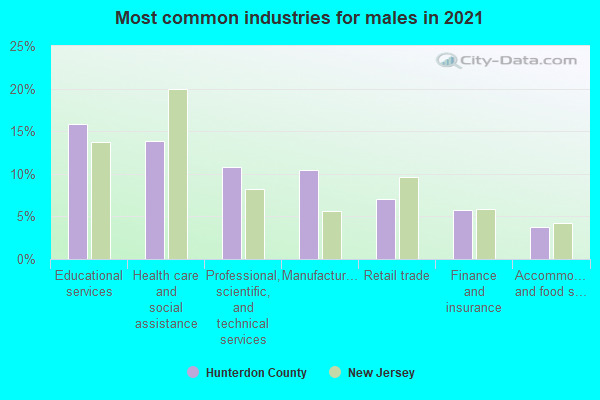
- Educational services (20%)
- Health care and social assistance (16%)
- Professional, scientific, and technical services (11%)
- Retail trade (9%)
- Finance and insurance (7%)
- Manufacturing (7%)
- Accommodation and food services (4%)
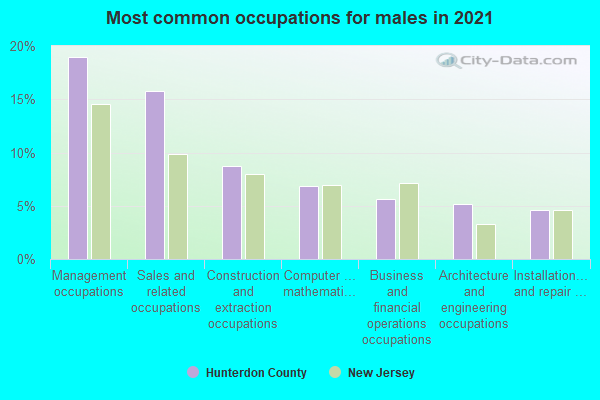
- Management occupations (22%)
- Business and financial operations occupations (9%)
- Sales and related occupations (8%)
- Computer and mathematical occupations (7%)
- Educational instruction, and library occupations (6%)
- Installation, maintenance, and repair occupations (5%)
- Construction and extraction occupations (5%)
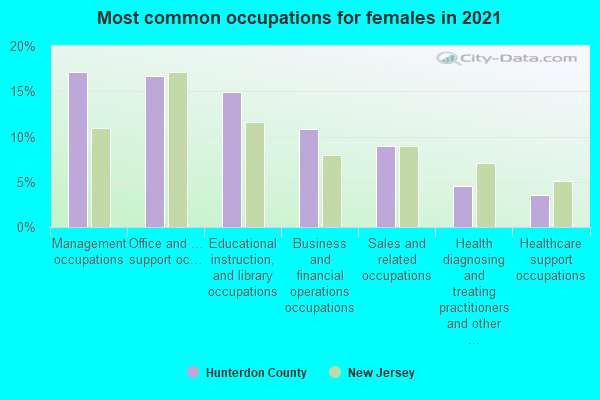
- Educational instruction, and library occupations (16%)
- Office and administrative support occupations (13%)
- Business and financial operations occupations (12%)
- Management occupations (11%)
- Sales and related occupations (11%)
- Health diagnosing and treating practitioners and other technical occupations (7%)
- Food preparation and serving related occupations (3%)
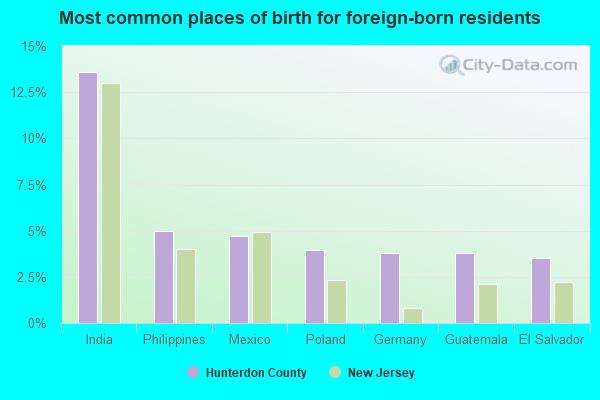
- India (15%)
- Mexico (6%)
- Germany (5%)
- Poland (4%)
- Portugal (4%)
- Philippines (4%)
- Ecuador (3%)
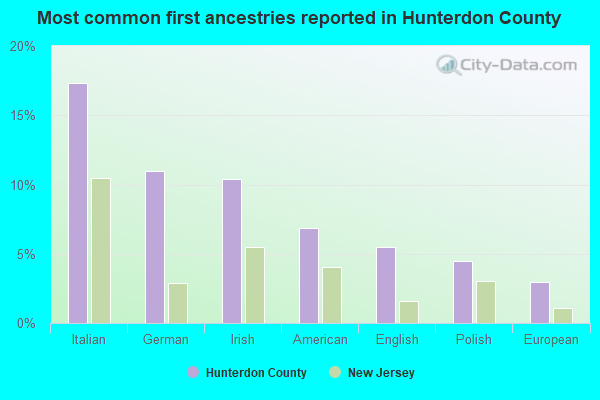
- Italian (16%)
- Irish (10%)
- German (9%)
- American (8%)
- English (5%)
- Polish (5%)
- European (2%)
People in group quarters in Hunterdon County, New Jersey in 2010:
- 1,402 people in state prisons
- 1,168 people in correctional facilities intended for juveniles
- 1,114 people in local jails and other municipal confinement facilities
- 351 people in nursing facilities/skilled-nursing facilities
- 272 people in mental (psychiatric) hospitals and psychiatric units in other hospitals
- 103 people in group homes intended for adults
- 58 people in workers' group living quarters and job corps centers
- 50 people in other noninstitutional facilities
- 25 people in residential treatment centers for adults
- 15 people in emergency and transitional shelters (with sleeping facilities) for people experiencing homelessness
- 11 people in group homes for juveniles (non-correctional)
People in group quarters in Hunterdon County, New Jersey in 2000:
- 2,408 people in state prisons
- 635 people in schools, hospitals, or wards for the intellectually disabled
- 444 people in nursing homes
- 248 people in mental (psychiatric) hospitals or wards
- 97 people in other noninstitutional group quarters
- 91 people in local jails and other confinement facilities (including police lockups)
- 87 people in other types of correctional institutions
- 86 people in other nonhousehold living situations
- 75 people in homes for the mentally retarded
- 55 people in homes for the mentally ill
- 36 people in religious group quarters
- 28 people in training schools for juvenile delinquents
- 23 people in homes or halfway houses for drug/alcohol abuse
- 19 people in residential treatment centers for emotionally disturbed children
- 11 people in agriculture workers' dormitories on farms
- 2 people in hospitals or wards for drug/alcohol abuse
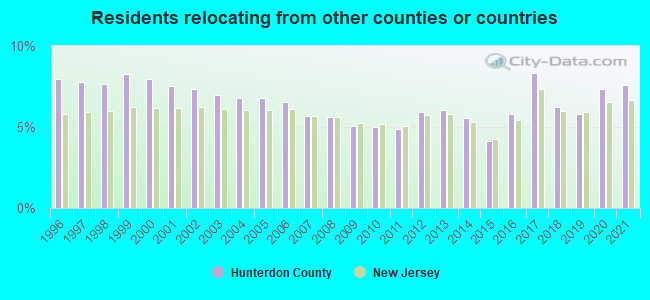
7.62% of this county's 2021 resident taxpayers lived in other counties in 2020 ($113,874 average adjusted gross income)
| Here: | 7.62% |
| New Jersey average: | 6.70% |
10 or fewer of this county's residents moved from foreign countries.
5.21% relocated from other counties in New Jersey ($75,364 average AGI)
2.41% relocated from other states ($38,509 average AGI)
Hunterdon County: 2.41% New Jersey average: 2.98%
Top counties from which taxpayers relocated into this county between 2020 and 2021:
| from Somerset County, NJ | |
| from Middlesex County, NJ | |
| from Union County, NJ | |
| from Warren County, NJ | |
| from Morris County, NJ | |
| from Mercer County, NJ | |
| from Essex County, NJ |
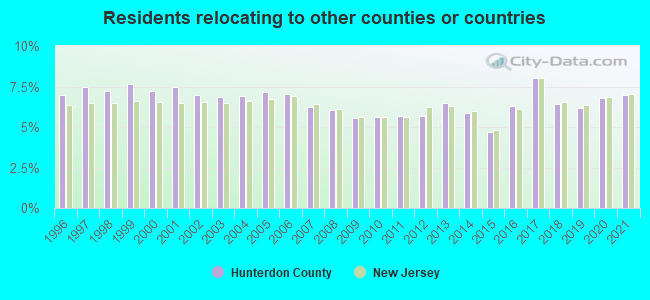
6.96% of this county's 2020 resident taxpayers moved to other counties in 2021 ($144,894 average adjusted gross income)
| Here: | 6.96% |
| New Jersey average: | 7.02% |
10 or fewer of this county's residents moved to foreign countries.
3.14% relocated to other counties in New Jersey ($50,895 average AGI)
3.81% relocated to other states ($93,998 average AGI)
Hunterdon County: 3.81% New Jersey average: 3.32%
Top counties to which taxpayers relocated from this county between 2020 and 2021:
| to Somerset County, NJ | |
| to Warren County, NJ | |
| to Bucks County, PA | |
| to Morris County, NJ | |
| to Mercer County, NJ | |
| to Northampton County, PA | |
| to Middlesex County, NJ |
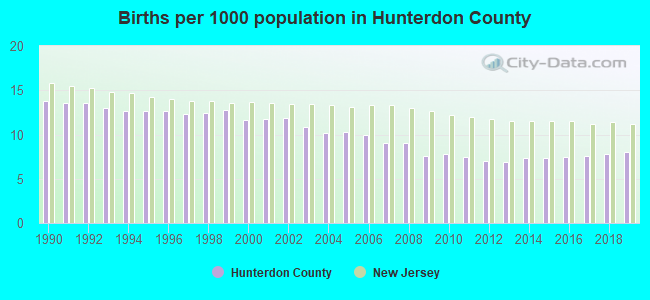
Births per 1000 population from 1990 to 1999: 12.9
Births per 1000 population from 2000 to 2009: 10.2
Births per 1000 population from 2010 to 2022: 6.3
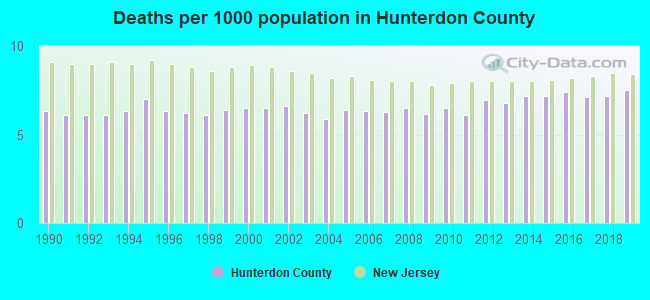
Deaths per 1000 population from 1990 to 1999: 6.3
Deaths per 1000 population from 2000 to 2009: 6.3
Deaths per 1000 population from 2010 to 2020: 7.2
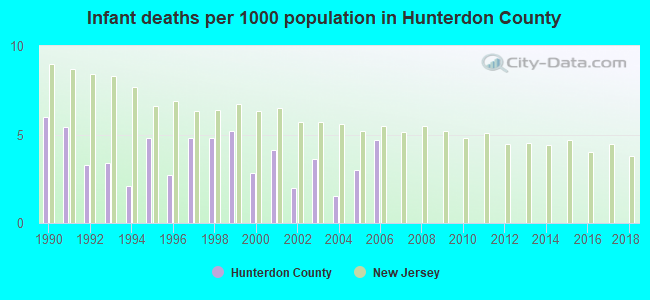
Infant deaths per 1000 live births from 1990 to 1999: 4.2
Infant deaths per 1000 live births from 2000 to 2006: 3.1
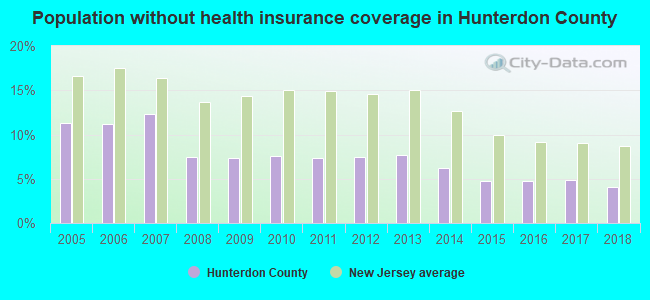
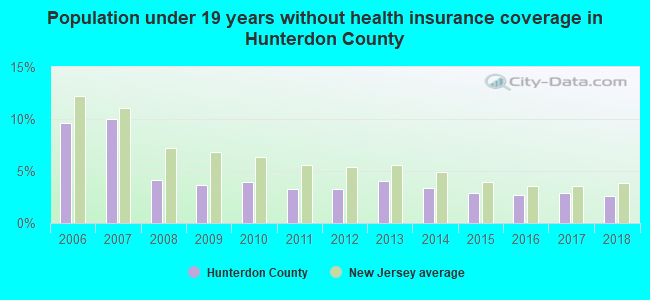
Persons under 19 years old without health insurance coverage in 2018: 2.6%
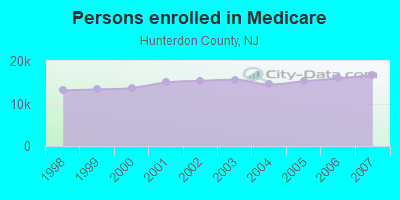
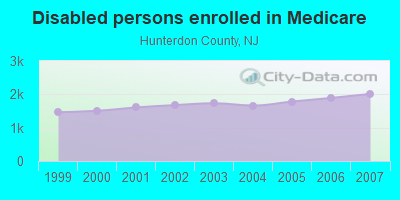
Persons enrolled in hospital insurance and/or supplemental medical insurance (Medicare) in July 1, 2007: 16,681 (14,668 aged, 2,013 disabled)
Children under 18 without health insurance coverage in 2007: 2,668 (8%)

Most common underlying causes of death in Hunterdon County, New Jersey in 1999 - 2019:
- Atherosclerotic heart disease (1,108)
- Bronchus or lung, unspecified - Malignant neoplasms (1,038)
- Acute myocardial infarction, unspecified (961)
- Unspecified dementia (866)
- Chronic obstructive pulmonary disease, unspecified (546)
- Stroke, not specified as haemorrhage or infarction (504)
- Breast, unspecified - Malignant neoplasms (395)
- Alzheimer disease, unspecified (382)
- Pancreas, unspecified - Malignant neoplasms (343)
- Colon, unspecified - Malignant neoplasms (326)
Population without health insurance coverage in 2000: 8%
Children under 18 without health insurance coverage in 2000: 5%
Short term general hospital admissions per 100,000 population in 2004: 6,481
Short term general hospital beds per 100,000 population in 2004: 140
Emergency room visits per 100,000 population in 2004: 22,752
General practice office based MDs per 100,000 population in 2005: 980
Medical specialist MDs per 100,000 population in 2005: 586
Dentists per 100,000 population in 1998: 21
Total births per 100,000 population, July 2005 - July 2006 : 61
Total deaths per 100,000 population, July 2005 - July 2006: 82
Limited-service eating places per 100,000 population in 2005 : 21
Beer, wine & liquor stores per 100,000 population in 2005: 1
Homicides per 1,000,000 population from 2000 to 2006: 29.3. This is less than state average.
Suicides per 1,000,000 population from 2000 to 2006: 80.1. This is more than state average.

- Firearm - 29.3
- Other - 50.8
Household type by relationship:
Households: 129,777- Male householders: 26,590 (4,738 living alone), Female householders: 23,925 (6,798 living alone)
29,618 spouses (29,461 opposite-sex spouses), 3,024 unmarried partners, (2,777 opposite-sex unmarried partners), 35,629 children (34,841 natural, 630 adopted, 158 stepchildren), 2,597 grandchildren, 145 brothers or sisters, 2,586 parents, 0 foster children, 1,192 other relatives, 1,773 non-relatives
- In group quarters: 2,698
Size of family households: 16,714 2-persons, 7,781 3-persons, 7,558 4-persons, 2,744 5-persons, 809 6-persons, 298 7-or-more-persons.
Size of nonfamily households: 11,536 1-person, 2,927 2-persons, 80 3-persons, 68 4-persons.
18,487 married couples with children.
4,016 single-parent households (1,394 men, 2,622 women).
86.9% of residents of Hunterdon speak English at home.
4.8% of residents speak Spanish at home (62% speak English very well, 14% speak English well, 17% speak English not well, 7% don't speak English at all).
5.3% of residents speak other Indo-European language at home (83% speak English very well, 12% speak English well, 4% speak English not well).
2.1% of residents speak Asian or Pacific Island language at home (81% speak English very well, 14% speak English well, 5% speak English not well, 1% don't speak English at all).
0.9% of residents speak other language at home (77% speak English very well, 21% speak English well, 2% speak English not well).
In fiscal year 2004:
Federal Government expenditure: $440,076,000 ($3,392 per capita)
Department of Defense expenditure: $14,181,000
Federal direct payments to individuals for retirement and disability: $245,453,000
Federal other direct payments to individuals: $96,360,000
Federal direct payments not to individuals: $923,000
Federal grants: $54,546,000
Federal procurement contracts: $16,999,000 ($9,168,000 Department of Defense)
Federal salaries and wages: $25,796,000 ($1,362,000 Department of Defense)
Federal Government direct loans: $135,000
Federal guaranteed/insured loans: $42,969,000
Federal Government insurance: $221,827,000
Population change from April 1, 2000 to July 1, 2005:
Births: 7,390| Here: | 57 per 1000 residents |
| State: | 69 per 1000 residents |
Deaths: 4,223
| Here: | 32 per 1000 residents |
| State: | 44 per 1000 residents |
Net international migration: +1,226
| Here: | +9 per 1000 residents |
| State: | +33 per 1000 residents |
Net internal migration: +4,258
| Here: | |
| State: |
Total withdrawal of fresh water for public supply: 86.42 millions of gallons per day (6% from ground, 94% from surface)
| Here: | 7.5 |
| State: | 6.8 |
| Here: | 4.4 |
| State: | 3.9 |
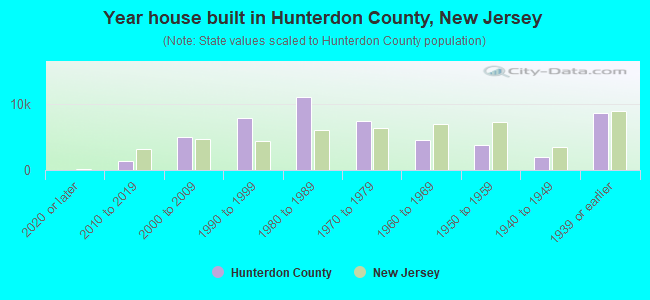
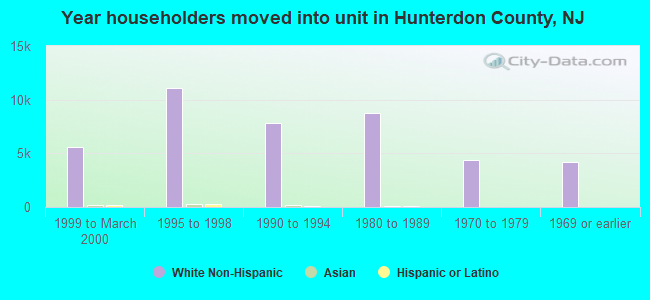
- Year house built in Hunterdon County, New Jersey
- 1952020 or later
- 2,4322010 to 2019
- 5,3282000 to 2009
- 7,9231990 to 1999
- 11,2421980 to 1989
- 6,7221970 to 1979
- 3,5991960 to 1969
- 3,6531950 to 1959
- 1,3941940 to 1949
- 9,4641939 or earlier
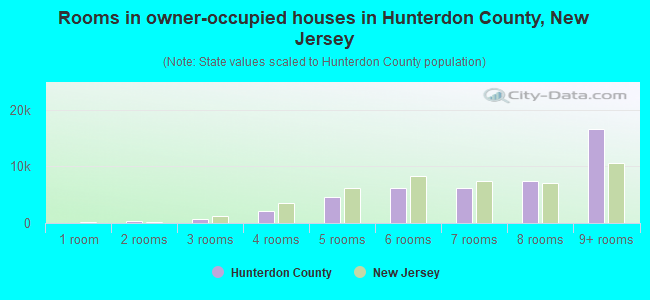
- Rooms in owner-occupied houses in Hunterdon County, New Jersey
- 01 room
- 1252 rooms
- 8633 rooms
- 2,8394 rooms
- 4,1225 rooms
- 7,1846 rooms
- 6,9167 rooms
- 6,7588 rooms
- 14,8279+ rooms
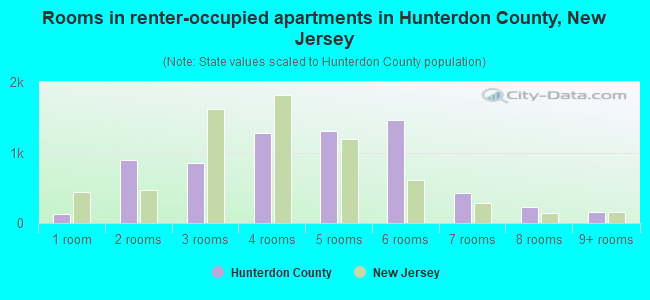
- Rooms in renter-occupied apartments in Hunterdon County, New Jersey
- 1331 room
- 5492 rooms
- 8633 rooms
- 2,2284 rooms
- 1,4855 rooms
- 6286 rooms
- 7057 rooms
- 1958 rooms
- 959+ rooms
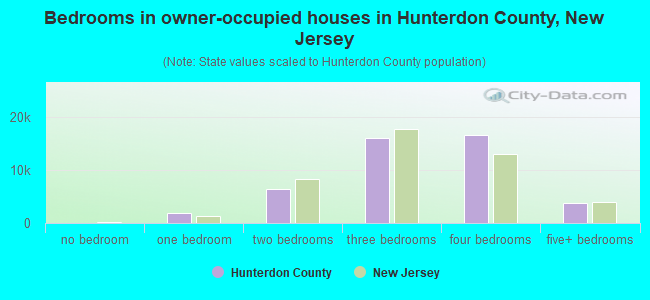
- Bedrooms in owner-occupied houses in Hunterdon County, New Jersey
- 0no bedroom
- 1,7911 bedroom
- 6,2952 bedrooms
- 15,8873 bedrooms
- 16,2594 bedrooms
- 3,4025+ bedrooms

- Bedrooms in renter-occupied apartments in Hunterdon County, New Jersey
- 292no bedroom
- 2,1311 bedroom
- 2,9062 bedrooms
- 1,2813 bedrooms
- 2564 bedrooms
- 155+ bedrooms
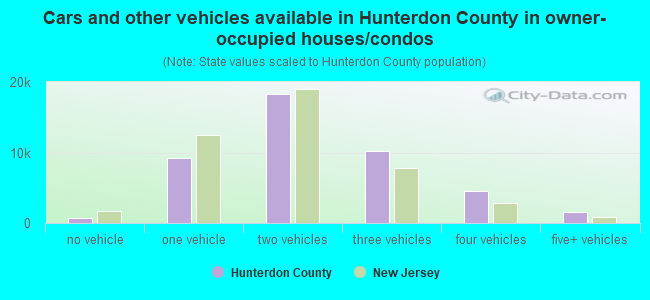
- Cars and other vehicles available in Hunterdon County in owner-occupied houses/condos
- 459no vehicle
- 9,9941 vehicle
- 20,1272 vehicles
- 8,6763 vehicles
- 2,9764 vehicles
- 1,4025+ vehicles
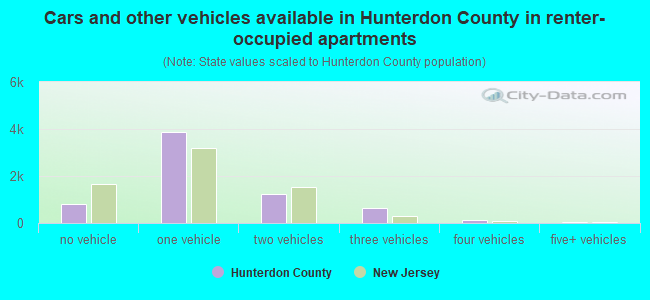
- Cars and other vehicles available in Hunterdon County in renter-occupied apartments
- 400no vehicle
- 3,9761 vehicle
- 1,8272 vehicles
- 4993 vehicles
- 1794 vehicles
- 05+ vehicles
91.5% of Hunterdon County residents lived in the same house 1 years ago.
Out of people who lived in different houses, 21% lived in this county.
Out of people who lived in different counties, 77% lived in New Jersey.
| Hunterdon County: | 91.5% |
| State average: | 90.4% |
Place of birth for U.S.-born residents:
- This state: 81,024
- Other state: 33,270
- Northeast: 22,620
- Midwest: 3,793
- South: 5,498
- West: 1,359
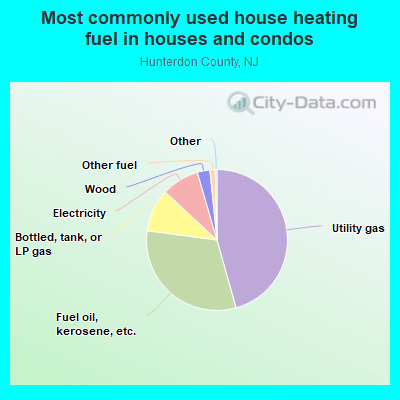
- 48.5%Utility gas
- 32.4%Fuel oil, kerosene, etc.
- 7.2%Bottled, tank, or LP gas
- 6.9%Electricity
- 3.0%Wood
- 1.2%Other fuel
- 0.5%Solar energy
- 0.2%Coal or coke
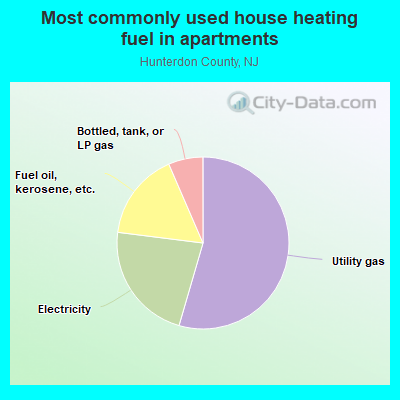
- 52.9%Utility gas
- 20.1%Electricity
- 16.6%Fuel oil, kerosene, etc.
- 7.2%Bottled, tank, or LP gas
- 1.3%No fuel used
- 0.9%Wood
- 0.7%Solar energy
- 0.4%Other fuel
Private vs. public school enrollment:
| Here: | 12.4% |
| New Jersey: | 12.3% |
| Here: | 12.4% |
| New Jersey: | 13.1% |
| Here: | 30.9% |
| New Jersey: | 33.2% |
Hunterdon County government finances - Expenditure in 2018:
- Assistance and Subsidies - Public Welfare, Federal Categorical Assistance Programs: $397,000
Public Welfare, Cash Assistance Programs - Other: $310,000
Public Welfare, Federal Categorical Assistance Programs: $262,000
- Bond Funds - Cash and Securities: $46,061,000
Cash and Securities: $36,875,000
- Charges - Parks and Recreation: $1,830,000
Other: $1,802,000
Other: $1,542,000
Parks and Recreation: $1,495,000
Elementary and Secondary Education School Tuition and Transportation: $408,000
Elementary and Secondary Education School Tuition and Transportation: $323,000
Solid Waste Management: $202,000
Solid Waste Management: $82,000
Elementary and Secondary Education - Other: $39,000
Elementary and Secondary Education - Other: $17,000
Elementary and Secondary Education School Lunch: $5,000
- Construction - Regular Highways: $4,341,000
Regular Highways: $4,167,000
Elementary and Secondary Education: $357,000
General Public Buildings: $197,000
Elementary and Secondary Education: $158,000
General - Other: $114,000
Natural Resources - Other: $3,000
- Current Operations - General - Other: $26,088,000
Regular Highways: $8,219,000
Elementary and Secondary Education: $7,849,000
Elementary and Secondary Education: $7,107,000
Regular Highways: $5,225,000
Police Protection: $5,171,000
Judicial and Legal Services: $4,881,000
Judicial and Legal Services: $4,184,000
Parks and Recreation: $3,876,000
General - Other: $3,566,000
Central Staff Services: $3,081,000
Public Welfare - Other: $3,027,000
Correctional Institutions: $2,600,000
Central Staff Services: $2,443,000
Parks and Recreation: $2,037,000
Police Protection: $1,807,000
Health - Other: $1,716,000
Health - Other: $1,709,000
General Public Buildings: $1,590,000
General Public Buildings: $1,306,000
Financial Administration: $881,000
Financial Administration: $800,000
Transit Utilities: $800,000
Local Fire Protection: $389,000
Corrections - Other: $305,000
Protective Inspection and Regulation - Other: $280,000
Natural Resources - Other: $279,000
Public Welfare, Vendor Payments for Other Purposes: $206,000
Transit Utilities: $199,000
Solid Waste Management: $130,000
Protective Inspection and Regulation - Other: $71,000
Public Welfare - Other: $65,000
Local Fire Protection: $46,000
Solid Waste Management: $14,000
Natural Resources - Other: $5,000
- General - Interest on Debt: $226,000
Interest on Debt: $210,000
- Intergovernmental to Local - Other - Other Higher Education: $7,000
- Intergovernmental to State - Hospitals: $1,298,000
Elementary and Secondary Education: $38,000
Elementary and Secondary Education: $38,000
- Local Intergovernmental - Education: $4,144,000
Education: $3,445,000
- Miscellaneous - Interest Earnings: $3,268,000
Interest Earnings: $1,282,000
Fines and Forfeits: $1,156,000
General Revenue - Other: $877,000
General Revenue - Other: $679,000
Sale of Property: $139,000
Rents: $100,000
Rents: $88,000
Fines and Forfeits: $17,000
- Other Capital Outlay - General - Other: $2,250,000
Natural Resources - Other: $1,680,000
General - Other: $1,089,000
Parks and Recreation: $976,000
Elementary and Secondary Education: $122,000
Financial Administration: $95,000
Correctional Institutions: $22,000
Elementary and Secondary Education: $1,000
- Other Funds - Cash and Securities: $46,644,000
Cash and Securities: $40,721,000
- State Intergovernmental - Health and Hospitals: $2,119,000
Education: $2,007,000
Education: $1,221,000
Public Welfare: $839,000
Transit Utilities: $489,000
Health and Hospitals: $356,000
Transit Utilities: $284,000
Public Welfare: $80,000
Other: $26,000
Other: $22,000
- Tax - Property: $68,987,000
Property: $68,675,000
Documentary and Stock Transfer: $1,276,000
Other License: $1,214,000
Documentary and Stock Transfer: $1,175,000
- Total Salaries and Wages: $10,764,000
: $2,866,000
Hunterdon County government finances - Revenue in 2018:
- Assistance and Subsidies - Public Welfare, Federal Categorical Assistance Programs: $397,000
Public Welfare, Cash Assistance Programs - Other: $310,000
Public Welfare, Federal Categorical Assistance Programs: $262,000
- Bond Funds - Cash and Securities: $46,061,000
Cash and Securities: $36,875,000
- Charges - Parks and Recreation: $1,830,000
Other: $1,802,000
Other: $1,542,000
Parks and Recreation: $1,495,000
Elementary and Secondary Education School Tuition and Transportation: $408,000
Elementary and Secondary Education School Tuition and Transportation: $323,000
Solid Waste Management: $202,000
Solid Waste Management: $82,000
Elementary and Secondary Education - Other: $39,000
Elementary and Secondary Education - Other: $17,000
Elementary and Secondary Education School Lunch: $5,000
- Construction - Regular Highways: $4,341,000
Regular Highways: $4,167,000
Elementary and Secondary Education: $357,000
General Public Buildings: $197,000
Elementary and Secondary Education: $158,000
General - Other: $114,000
Natural Resources - Other: $3,000
- Current Operations - General - Other: $26,088,000
Regular Highways: $8,219,000
Elementary and Secondary Education: $7,849,000
Elementary and Secondary Education: $7,107,000
Regular Highways: $5,225,000
Police Protection: $5,171,000
Judicial and Legal Services: $4,881,000
Judicial and Legal Services: $4,184,000
Parks and Recreation: $3,876,000
General - Other: $3,566,000
Central Staff Services: $3,081,000
Public Welfare - Other: $3,027,000
Correctional Institutions: $2,600,000
Central Staff Services: $2,443,000
Parks and Recreation: $2,037,000
Police Protection: $1,807,000
Health - Other: $1,716,000
Health - Other: $1,709,000
General Public Buildings: $1,590,000
General Public Buildings: $1,306,000
Financial Administration: $881,000
Financial Administration: $800,000
Transit Utilities: $800,000
Local Fire Protection: $389,000
Corrections - Other: $305,000
Protective Inspection and Regulation - Other: $280,000
Natural Resources - Other: $279,000
Public Welfare, Vendor Payments for Other Purposes: $206,000
Transit Utilities: $199,000
Solid Waste Management: $130,000
Protective Inspection and Regulation - Other: $71,000
Public Welfare - Other: $65,000
Local Fire Protection: $46,000
Solid Waste Management: $14,000
Natural Resources - Other: $5,000
- General - Interest on Debt: $226,000
Interest on Debt: $210,000
- Intergovernmental to Local - Other - Other Higher Education: $7,000
- Intergovernmental to State - Hospitals: $1,298,000
Elementary and Secondary Education: $38,000
Elementary and Secondary Education: $38,000
- Local Intergovernmental - Education: $4,144,000
Education: $3,445,000
- Miscellaneous - Interest Earnings: $3,268,000
Interest Earnings: $1,282,000
Fines and Forfeits: $1,156,000
General Revenue - Other: $877,000
General Revenue - Other: $679,000
Sale of Property: $139,000
Rents: $100,000
Rents: $88,000
Fines and Forfeits: $17,000
- Other Capital Outlay - General - Other: $2,250,000
Natural Resources - Other: $1,680,000
General - Other: $1,089,000
Parks and Recreation: $976,000
Elementary and Secondary Education: $122,000
Financial Administration: $95,000
Correctional Institutions: $22,000
Elementary and Secondary Education: $1,000
- Other Funds - Cash and Securities: $46,644,000
Cash and Securities: $40,721,000
- State Intergovernmental - Health and Hospitals: $2,119,000
Education: $2,007,000
Education: $1,221,000
Public Welfare: $839,000
Transit Utilities: $489,000
Health and Hospitals: $356,000
Transit Utilities: $284,000
Public Welfare: $80,000
Other: $26,000
Other: $22,000
- Tax - Property: $68,987,000
Property: $68,675,000
Documentary and Stock Transfer: $1,276,000
Other License: $1,214,000
Documentary and Stock Transfer: $1,175,000
- Total Salaries and Wages: $10,764,000
: $2,866,000
Hunterdon County government finances - Debt in 2018:
- Assistance and Subsidies - Public Welfare, Federal Categorical Assistance Programs: $397,000
Public Welfare, Cash Assistance Programs - Other: $310,000
Public Welfare, Federal Categorical Assistance Programs: $262,000
- Bond Funds - Cash and Securities: $46,061,000
Cash and Securities: $36,875,000
- Charges - Parks and Recreation: $1,830,000
Other: $1,802,000
Other: $1,542,000
Parks and Recreation: $1,495,000
Elementary and Secondary Education School Tuition and Transportation: $408,000
Elementary and Secondary Education School Tuition and Transportation: $323,000
Solid Waste Management: $202,000
Solid Waste Management: $82,000
Elementary and Secondary Education - Other: $39,000
Elementary and Secondary Education - Other: $17,000
Elementary and Secondary Education School Lunch: $5,000
- Construction - Regular Highways: $4,341,000
Regular Highways: $4,167,000
Elementary and Secondary Education: $357,000
General Public Buildings: $197,000
Elementary and Secondary Education: $158,000
General - Other: $114,000
Natural Resources - Other: $3,000
- Current Operations - General - Other: $26,088,000
Regular Highways: $8,219,000
Elementary and Secondary Education: $7,849,000
Elementary and Secondary Education: $7,107,000
Regular Highways: $5,225,000
Police Protection: $5,171,000
Judicial and Legal Services: $4,881,000
Judicial and Legal Services: $4,184,000
Parks and Recreation: $3,876,000
General - Other: $3,566,000
Central Staff Services: $3,081,000
Public Welfare - Other: $3,027,000
Correctional Institutions: $2,600,000
Central Staff Services: $2,443,000
Parks and Recreation: $2,037,000
Police Protection: $1,807,000
Health - Other: $1,716,000
Health - Other: $1,709,000
General Public Buildings: $1,590,000
General Public Buildings: $1,306,000
Financial Administration: $881,000
Financial Administration: $800,000
Transit Utilities: $800,000
Local Fire Protection: $389,000
Corrections - Other: $305,000
Protective Inspection and Regulation - Other: $280,000
Natural Resources - Other: $279,000
Public Welfare, Vendor Payments for Other Purposes: $206,000
Transit Utilities: $199,000
Solid Waste Management: $130,000
Protective Inspection and Regulation - Other: $71,000
Public Welfare - Other: $65,000
Local Fire Protection: $46,000
Solid Waste Management: $14,000
Natural Resources - Other: $5,000
- General - Interest on Debt: $226,000
Interest on Debt: $210,000
- Intergovernmental to Local - Other - Other Higher Education: $7,000
- Intergovernmental to State - Hospitals: $1,298,000
Elementary and Secondary Education: $38,000
Elementary and Secondary Education: $38,000
- Local Intergovernmental - Education: $4,144,000
Education: $3,445,000
- Miscellaneous - Interest Earnings: $3,268,000
Interest Earnings: $1,282,000
Fines and Forfeits: $1,156,000
General Revenue - Other: $877,000
General Revenue - Other: $679,000
Sale of Property: $139,000
Rents: $100,000
Rents: $88,000
Fines and Forfeits: $17,000
- Other Capital Outlay - General - Other: $2,250,000
Natural Resources - Other: $1,680,000
General - Other: $1,089,000
Parks and Recreation: $976,000
Elementary and Secondary Education: $122,000
Financial Administration: $95,000
Correctional Institutions: $22,000
Elementary and Secondary Education: $1,000
- Other Funds - Cash and Securities: $46,644,000
Cash and Securities: $40,721,000
- State Intergovernmental - Health and Hospitals: $2,119,000
Education: $2,007,000
Education: $1,221,000
Public Welfare: $839,000
Transit Utilities: $489,000
Health and Hospitals: $356,000
Transit Utilities: $284,000
Public Welfare: $80,000
Other: $26,000
Other: $22,000
- Tax - Property: $68,987,000
Property: $68,675,000
Documentary and Stock Transfer: $1,276,000
Other License: $1,214,000
Documentary and Stock Transfer: $1,175,000
- Total Salaries and Wages: $10,764,000
: $2,866,000
Hunterdon County government finances - Cash and Securities in 2018:
- Assistance and Subsidies - Public Welfare, Federal Categorical Assistance Programs: $397,000
Public Welfare, Cash Assistance Programs - Other: $310,000
Public Welfare, Federal Categorical Assistance Programs: $262,000
- Bond Funds - Cash and Securities: $46,061,000
Cash and Securities: $36,875,000
- Charges - Parks and Recreation: $1,830,000
Other: $1,802,000
Other: $1,542,000
Parks and Recreation: $1,495,000
Elementary and Secondary Education School Tuition and Transportation: $408,000
Elementary and Secondary Education School Tuition and Transportation: $323,000
Solid Waste Management: $202,000
Solid Waste Management: $82,000
Elementary and Secondary Education - Other: $39,000
Elementary and Secondary Education - Other: $17,000
Elementary and Secondary Education School Lunch: $5,000
- Construction - Regular Highways: $4,341,000
Regular Highways: $4,167,000
Elementary and Secondary Education: $357,000
General Public Buildings: $197,000
Elementary and Secondary Education: $158,000
General - Other: $114,000
Natural Resources - Other: $3,000
- Current Operations - General - Other: $26,088,000
Regular Highways: $8,219,000
Elementary and Secondary Education: $7,849,000
Elementary and Secondary Education: $7,107,000
Regular Highways: $5,225,000
Police Protection: $5,171,000
Judicial and Legal Services: $4,881,000
Judicial and Legal Services: $4,184,000
Parks and Recreation: $3,876,000
General - Other: $3,566,000
Central Staff Services: $3,081,000
Public Welfare - Other: $3,027,000
Correctional Institutions: $2,600,000
Central Staff Services: $2,443,000
Parks and Recreation: $2,037,000
Police Protection: $1,807,000
Health - Other: $1,716,000
Health - Other: $1,709,000
General Public Buildings: $1,590,000
General Public Buildings: $1,306,000
Financial Administration: $881,000
Financial Administration: $800,000
Transit Utilities: $800,000
Local Fire Protection: $389,000
Corrections - Other: $305,000
Protective Inspection and Regulation - Other: $280,000
Natural Resources - Other: $279,000
Public Welfare, Vendor Payments for Other Purposes: $206,000
Transit Utilities: $199,000
Solid Waste Management: $130,000
Protective Inspection and Regulation - Other: $71,000
Public Welfare - Other: $65,000
Local Fire Protection: $46,000
Solid Waste Management: $14,000
Natural Resources - Other: $5,000
- General - Interest on Debt: $226,000
Interest on Debt: $210,000
- Intergovernmental to Local - Other - Other Higher Education: $7,000
- Intergovernmental to State - Hospitals: $1,298,000
Elementary and Secondary Education: $38,000
Elementary and Secondary Education: $38,000
- Local Intergovernmental - Education: $4,144,000
Education: $3,445,000
- Miscellaneous - Interest Earnings: $3,268,000
Interest Earnings: $1,282,000
Fines and Forfeits: $1,156,000
General Revenue - Other: $877,000
General Revenue - Other: $679,000
Sale of Property: $139,000
Rents: $100,000
Rents: $88,000
Fines and Forfeits: $17,000
- Other Capital Outlay - General - Other: $2,250,000
Natural Resources - Other: $1,680,000
General - Other: $1,089,000
Parks and Recreation: $976,000
Elementary and Secondary Education: $122,000
Financial Administration: $95,000
Correctional Institutions: $22,000
Elementary and Secondary Education: $1,000
- Other Funds - Cash and Securities: $46,644,000
Cash and Securities: $40,721,000
- State Intergovernmental - Health and Hospitals: $2,119,000
Education: $2,007,000
Education: $1,221,000
Public Welfare: $839,000
Transit Utilities: $489,000
Health and Hospitals: $356,000
Transit Utilities: $284,000
Public Welfare: $80,000
Other: $26,000
Other: $22,000
- Tax - Property: $68,987,000
Property: $68,675,000
Documentary and Stock Transfer: $1,276,000
Other License: $1,214,000
Documentary and Stock Transfer: $1,175,000
- Total Salaries and Wages: $10,764,000
: $2,866,000
Supplemental Security Income (SSI) in 2006:
- Total number of recipients: 686
- Number of aged recipients: 117
- Number of blind and disabled recipients: 569
- Number of recipients under 18: 52
- Number of recipients between 18 and 64: 455
- Number of recipients older than 64: 179
- Number of recipients also receiving OASDI: 217
- Amount of payments (thousands of dollars): 269
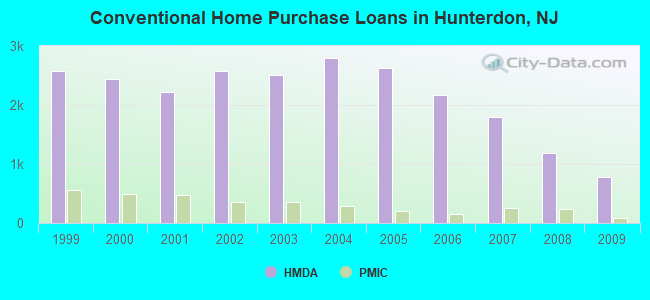
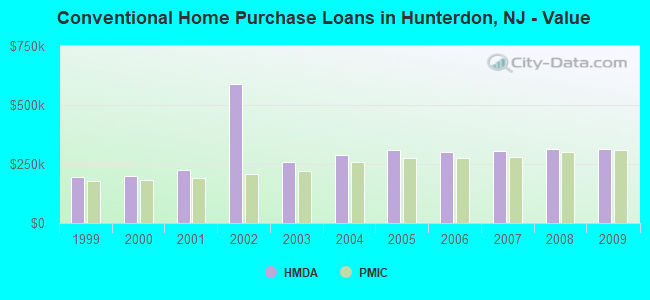
| Home Mortgage Disclosure Act Aggregated Statistics For Year 2009 (Based on 26 full tracts) | ||||||||||||||
| A) FHA, FSA/RHS & VA Home Purchase Loans | B) Conventional Home Purchase Loans | C) Refinancings | D) Home Improvement Loans | E) Loans on Dwellings For 5+ Families | F) Non-occupant Loans on < 5 Family Dwellings (A B C & D) | G) Loans On Manufactured Home Dwelling (A B C & D) | ||||||||
|---|---|---|---|---|---|---|---|---|---|---|---|---|---|---|
| Number | Average Value | Number | Average Value | Number | Average Value | Number | Average Value | Number | Average Value | Number | Average Value | Number | Average Value | |
| LOANS ORIGINATED | 315 | $285,619 | 776 | $313,530 | 4,480 | $284,713 | 223 | $147,874 | 5 | $683,000 | 78 | $265,295 | 2 | $256,000 |
| APPLICATIONS APPROVED, NOT ACCEPTED | 24 | $287,333 | 100 | $336,980 | 318 | $292,025 | 30 | $53,800 | 1 | $3,500,000 | 16 | $241,000 | 0 | $0 |
| APPLICATIONS DENIED | 40 | $257,550 | 119 | $270,227 | 1,310 | $311,031 | 157 | $94,318 | 2 | $317,500 | 59 | $217,593 | 2 | $192,500 |
| APPLICATIONS WITHDRAWN | 48 | $274,688 | 121 | $324,132 | 926 | $302,955 | 42 | $113,190 | 0 | $0 | 27 | $284,407 | 0 | $0 |
| FILES CLOSED FOR INCOMPLETENESS | 14 | $312,786 | 27 | $318,741 | 212 | $305,821 | 13 | $151,308 | 0 | $0 | 9 | $240,111 | 0 | $0 |
| Private Mortgage Insurance Companies Aggregated Statistics For Year 2009 (Based on 26 full tracts) | ||||||
| A) Conventional Home Purchase Loans | B) Refinancings | C) Non-occupant Loans on < 5 Family Dwellings (A & B) | ||||
|---|---|---|---|---|---|---|
| Number | Average Value | Number | Average Value | Number | Average Value | |
| LOANS ORIGINATED | 86 | $311,430 | 57 | $338,614 | 2 | $271,000 |
| APPLICATIONS APPROVED, NOT ACCEPTED | 34 | $296,029 | 29 | $330,172 | 1 | $336,000 |
| APPLICATIONS DENIED | 16 | $329,250 | 19 | $365,158 | 1 | $417,000 |
| APPLICATIONS WITHDRAWN | 11 | $315,273 | 11 | $328,909 | 0 | $0 |
| FILES CLOSED FOR INCOMPLETENESS | 3 | $335,333 | 1 | $528,000 | 0 | $0 |
| Most common first names in Hunterdon County, NJ among deceased individuals | ||
| Name | Count | Lived (average) |
|---|---|---|
| John | 739 | 75.2 years |
| Mary | 598 | 81.5 years |
| William | 563 | 74.2 years |
| Joseph | 403 | 75.4 years |
| Helen | 356 | 80.2 years |
| Robert | 352 | 68.3 years |
| George | 346 | 75.7 years |
| Charles | 344 | 76.1 years |
| Elizabeth | 317 | 80.4 years |
| Anna | 308 | 82.8 years |
| Most common last names in Hunterdon County, NJ among deceased individuals | ||
| Last name | Count | Lived (average) |
|---|---|---|
| Smith | 196 | 79.0 years |
| Hoffman | 102 | 77.9 years |
| Johnson | 100 | 79.3 years |
| Apgar | 91 | 78.8 years |
| Miller | 87 | 73.2 years |
| Brown | 65 | 75.9 years |
| Snyder | 59 | 75.3 years |
| Jones | 55 | 70.6 years |
| Williams | 52 | 74.9 years |
| Hall | 51 | 73.2 years |
| Businesses in Hunterdon County, NJ | ||||
| Name | Count | Name | Count | |
|---|---|---|---|---|
| 7-Eleven | 1 | Kincaid | 1 | |
| A&P | 2 | Kohl's | 1 | |
| AT&T | 1 | La-Z-Boy | 1 | |
| Advance Auto Parts | 1 | Lane Bryant | 1 | |
| Ann Taylor | 2 | Lane Furniture | 1 | |
| Applebee's | 1 | Lowe's | 1 | |
| Audi | 1 | Marriott | 1 | |
| AutoZone | 1 | Marshalls | 1 | |
| BMW | 1 | MasterBrand Cabinets | 19 | |
| Baskin-Robbins | 1 | McDonald's | 5 | |
| Bed Bath & Beyond | 1 | New Balance | 1 | |
| Blockbuster | 1 | New York & Co | 1 | |
| Brooks Brothers | 1 | Nissan | 1 | |
| Budget Car Rental | 2 | Panera Bread | 1 | |
| Burger King | 2 | Penske | 1 | |
| CVS | 3 | Pier 1 Imports | 1 | |
| Circle K | 1 | Pizza Hut | 1 | |
| Cold Stone Creamery | 1 | Quiznos | 1 | |
| Coldwater Creek | 1 | RadioShack | 3 | |
| Cracker Barrel | 1 | Ramada | 1 | |
| Decora Cabinetry | 11 | Rite Aid | 4 | |
| Domino's Pizza | 2 | SONIC Drive-In | 1 | |
| DressBarn | 1 | Sprint Nextel | 1 | |
| Dressbarn | 1 | Staples | 1 | |
| Dunkin Donuts | 8 | Starbucks | 1 | |
| Famous Footwear | 1 | Stop & Shop | 1 | |
| FedEx | 32 | Subaru | 1 | |
| Ford | 1 | Subway | 2 | |
| GNC | 4 | T-Mobile | 4 | |
| GameStop | 2 | T.G.I. Driday's | 1 | |
| Gymboree | 1 | T.J.Maxx | 1 | |
| H&R Block | 4 | Taco Bell | 1 | |
| Hilton | 2 | Talbots | 1 | |
| Holiday Inn | 1 | Toyota | 2 | |
| Home Depot | 1 | Toys"R"Us | 2 | |
| Hyundai | 1 | U-Haul | 7 | |
| IZOD | 1 | UPS | 33 | |
| J. Jill | 1 | Verizon Wireless | 5 | |
| J.Crew | 1 | Volkswagen | 1 | |
| JoS. A. Bank | 1 | Walgreens | 1 | |
| Jones New York | 2 | Walmart | 2 | |
| Justice | 1 | Wendy's | 1 | |
| KFC | 1 | YMCA | 3 | |
Hunterdon County on our top lists:
- #1 on the list of "Top 101 counties with the largest decrease in the number of births per 1000 residents 2000-2006 to 2007-2013 (pop 50,000+)"
- #3 on the list of "Top 101 counties with the highest percentage of residents that visited a dentist within the past year"
- #5 on the list of "Top 101 counties with the best general health status score of residents (1-5), 3 years of data"
- #6 on the list of "Top 101 counties with the lowest number of births per 1000 residents 2007-2013"
- #6 on the list of "Top 101 counties with the lowest number of births per 1000 residents 2007-2013 (pop 50,000+)"
- #30 on the list of "Top 101 counties with the lowest average weight of females"
- #63 on the list of "Top 101 counties with the highest percentage of residents that exercised in the past month"
- #70 on the list of "Top 101 counties with the highest surface withdrawal of fresh water for public supply (pop. 50,000+)"
- #73 on the list of "Top 101 counties with the highest surface withdrawal of fresh water for public supply"
- #83 on the list of "Top 101 counties with the largest number of people moving out compared to moving in (pop. 50,000+)"
- #86 on the list of "Top 101 counties with the largest number of children under 18 without health insurance coverage in 2000 (pop. 50,000+)"
- #88 on the list of "Top 101 counties with the largest number of people without health insurance coverage in 2000 (pop. 50,000+)"
- #89 on the list of "Top 101 counties with the highest percentage of residents that drank alcohol in the past 30 days"
- #94 on the list of "Top 101 counties with the highest total withdrawal of fresh water for public supply (pop. 50,000+)"
- #96 on the list of "Top 101 counties with the highest total withdrawal of fresh water for public supply"