Ware: Fire Incidents, Massachusetts (MA)
Where are fire incidents reported in Ware, MA
Something went wrong! Please refresh the page.
| Fire incidents reported | |
|---|---|
| Sreet name | Count |
| WEST ST | 100 |
| CHURCH ST | 84 |
| MAIN ST | 62 |
| PALMER RD | 60 |
| EAST ST | 48 |
| GREENWICH RD | 44 |
| MONSON TURNPIKE RD | 42 |
| GREENWICH PLAINS RD | 40 |
| NORTH ST | 38 |
| WEST MAIN ST | 38 |
| BELCHERTOWN RD | 36 |
| OLD BELCHERTOWN RD | 34 |
| SOUTH ST | 34 |
| OLD GILBERTVILLE RD | 30 |
| CONVENT HILL RD | 28 |
| OLD POOR FARM RD | 28 |
| BONDSVILLE RD | 26 |
| CUMMINGS RD | 24 |
| STONY POINT DR | 24 |
| ASPEN ST | 22 |
| BABCOCK TAVERN RD | 22 |
| GOULD RD | 22 |
| OSBORNE RD | 22 |
| PULASKI ST | 22 |
| RIVER RD | 22 |
| DOANE RD | 20 |
| FISHERDICK RD | 20 |
| MALBOEUF RD | 20 |
| BACON RD | 18 |
| COFFEY HILL RD | 18 |
2002 - 2018 National Fire Incident Reporting System (NFIRS) incidents
- Incident types reported to NFIRS in Ware, MA
- 1,86740.6%Rescue & EMS
- 1,00221.8%Fire
- 67914.8%Hazardous Condition
- 3928.5%False Alarm
- 3637.9%Service Call
- 2575.6%Good Intent Call
- 260.6%Special Incident
- 80.2%Overpressure Rupture
- Fire incident types reported to NFIRS in Ware, MA
- 47647.5%Outside Fires
- 34334.2%Structure Fires
- 11111.1%Other
- 727.2%Mobile Property/Vehicle Fires
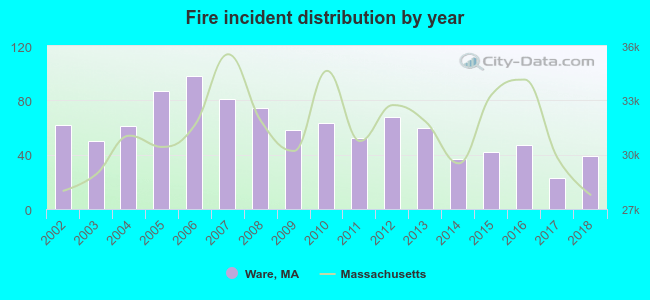 According to the data from the years 2002 - 2018 the average number of fire incidents per year is 59. The highest number of reported fire incidents - 98 took place in 2006, and the least - 23 in 2017. The data has a declining trend.
The average number of yearly fire incidents per 10k residents in Ware, MA compared to nearest cities:
(Note: Based on data for the last 3 years, including only cities with population 5,000 and above)
| Ware: | 58.9 |
| Monson: | 31.2 |
| Spencer: | 109.9 |
| Ludlow: | 30.6 |
| Amherst: | 19.9 |
| Hampden: | 92.8 |
| Southbridge: | 40.9 |
| Charlton: | 51.9 |
| South Hadley: | 42.3 |
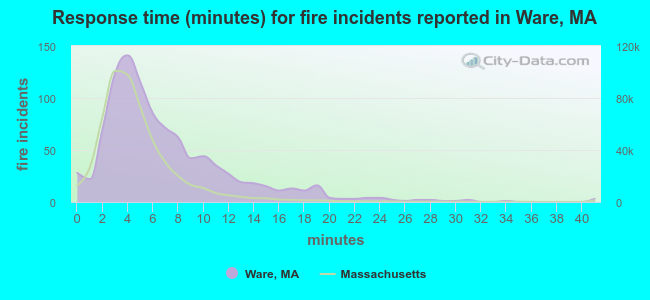 The median response time based on all reported fire incidents is 6 minutes. This is higher compared to the state median value.
The median response time in Ware, MA compared to nearest cities:
(Note: Based on data for all years, including only cities with at least 500 fire incidents)
| Ware: | 6 minutes |
| Belchertown: | 10 minutes |
| Palmer: | 7 minutes |
| Monson: | 7 minutes |
| Wilbraham: | 6 minutes |
| Spencer: | 7 minutes |
| Ludlow: | 4 minutes |
| Sturbridge: | 9 minutes |
| Amherst: | 6 minutes |
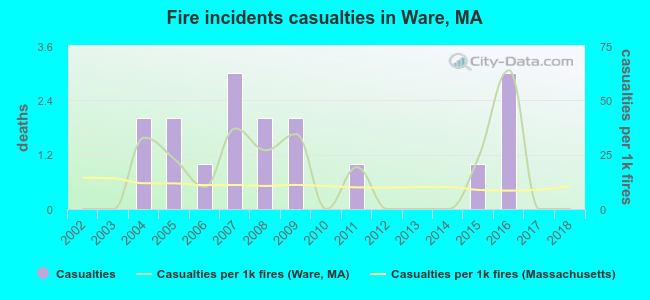 According to the reports from the years 2002 - 2018 the average number of fire-related casualties per year is 1. The highest number of reported injuries - 3 took place in 2007, and the lowest - 0 in 2002. The data has a constant trend.
The average number of injuries per 1,000 fires is 16. This indicator was the highest - 64 in 2016, and the lowest 0 in 2002. The trend for injuries per 1,000 fires is constant. Compared to the state value the number of casualties per 1,000 fires is higher.
According to the reports from the years 2002 - 2018 the average number of fire-related casualties per year is 1. The highest number of reported injuries - 3 took place in 2007, and the lowest - 0 in 2002. The data has a constant trend.
The average number of injuries per 1,000 fires is 16. This indicator was the highest - 64 in 2016, and the lowest 0 in 2002. The trend for injuries per 1,000 fires is constant. Compared to the state value the number of casualties per 1,000 fires is higher.Casualties per 1,000 incidents in Ware, MA compared to nearest cities:
(Note: Based on data for all years, including only cities with at least 500 fire incidents)
| Ware: | 17.0 |
| Belchertown: | 0.0 |
| Palmer: | 3.5 |
| Monson: | 4.6 |
| Wilbraham: | 22.3 |
| Spencer: | 18.1 |
| Ludlow: | 22.3 |
| Sturbridge: | 12.0 |
| Amherst: | 27.6 |
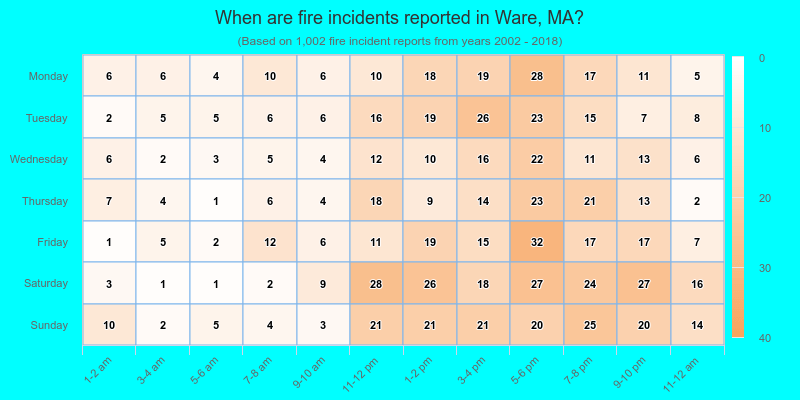
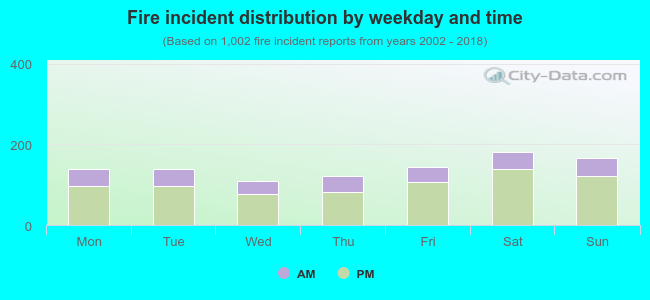 27.9% incidents where reported in the morning and 72.1% in the evening. The most fires (18.2%) took place on Saturday, and the least (11.0%) on Wednesday.
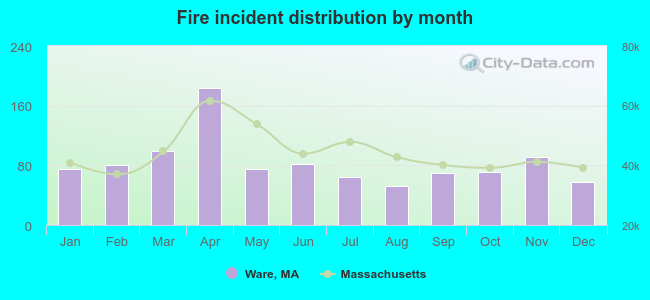 According to the 1,002 fire incidents from years 2002 - 2018 most fires (18.4%) took place during April, and the least (5.2%) in August.
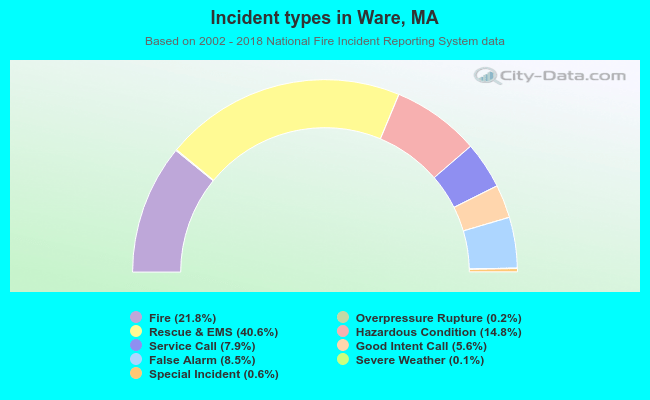 Out of all 4,598 cases reported during the years 2002 - 2018, the most belonged to the categories: Rescue & EMS (40.6%), Fire (21.8%), and Hazardous Condition (14.8%).
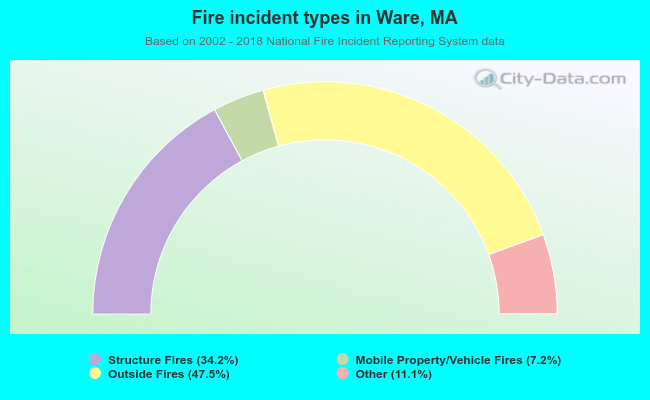 When looking into fire subcategories, the most incidents belonged to: Outside Fires (47.5%), and Structure Fires (34.2%).