Wilbraham: Fire Incidents, Massachusetts (MA)
Where are fire incidents reported in Wilbraham, MA
Something went wrong! Please refresh the page.
| Fire incidents reported | |
|---|---|
| Sreet name | Count |
| BOSTON RD | 294 |
| STONY HILL RD | 148 |
| MAIN ST | 88 |
| TINKHAM RD | 52 |
| MONSON RD | 42 |
| MOUNTAIN RD | 40 |
| THREE RIVERS RD | 36 |
| MANCHONIS RD | 32 |
| GLENDALE RD | 28 |
| SOULE RD | 28 |
| SPRINGFIELD ST | 24 |
| BURLEIGH RD | 22 |
| MILES MORGAN CT | 20 |
| OLD BOSTON RD | 18 |
| POST OFFICE PARK | 18 |
| RIDGE RD | 18 |
| WESTON ST | 18 |
| BRAINARD RD | 14 |
| HICKORY HLL DR | 14 |
| CRANE HILL RD | 12 |
| STIRLING DR | 12 |
| STONEGATE CIR | 12 |
| BROOKMONT DR | 10 |
| COLONIAL RD | 10 |
| HIGHMOOR DR | 10 |
| LAKE DR | 10 |
| MARGARET DR | 10 |
| MAYNARD RD | 10 |
| MCINTOSH DR | 10 |
| PLEASANT VIEW RD | 10 |
2002 - 2018 National Fire Incident Reporting System (NFIRS) incidents
- Incident types reported to NFIRS in Wilbraham, MA
- 8,75661.8%Rescue & EMS
- 1,3839.8%False Alarm
- 1,2759.0%Service Call
- 1,0947.7%Hazardous Condition
- 8085.7%Fire
- 8025.7%Good Intent Call
- 230.2%Special Incident
- 170.1%Severe Weather
- 150.1%Overpressure Rupture
- Fire incident types reported to NFIRS in Wilbraham, MA
- 36945.7%Structure Fires
- 30838.1%Outside Fires
- 10012.4%Mobile Property/Vehicle Fires
- 313.8%Other
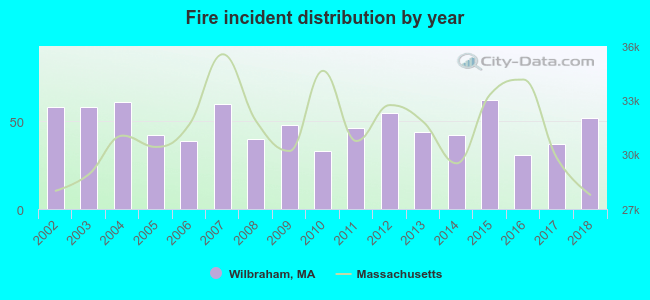 Based on the data from the years 2002 - 2018 the average number of fire incidents per year is 48. The highest number of reported fire incidents - 62 took place in 2015, and the least - 31 in 2016. The data has a declining trend.
 The median response time based on all reported fire incidents is 6 minutes. This is higher compared to the Massachusetts median value.
The median response time in Wilbraham, MA compared to nearest cities:
(Note: Based on data for all years, including only cities with at least 500 fire incidents)
| Wilbraham: | 6 minutes |
| Ludlow: | 4 minutes |
| Palmer: | 7 minutes |
| Springfield: | 3 minutes |
| East Longmeadow: | 5 minutes |
| Monson: | 7 minutes |
| Chicopee: | 4 minutes |
| Longmeadow: | 6 minutes |
| Belchertown: | 10 minutes |
 Based on the reports from the years 2002 - 2018 the average number of fire-related casualties per year is 1. The highest number of reported casualties - 4 took place in 2013, and the lowest - 0 in 2002. The data has an increasing trend.
The average number of injuries per 1,000 fire incidents is 24. This indicator was the highest - 91 in 2013, and the lowest 0 in 2002. The trend for casualties per 1,000 fire incidents is rising. Compared to the Massachusetts value the number of injuries per 1,000 incidents is much higher.
Based on the reports from the years 2002 - 2018 the average number of fire-related casualties per year is 1. The highest number of reported casualties - 4 took place in 2013, and the lowest - 0 in 2002. The data has an increasing trend.
The average number of injuries per 1,000 fire incidents is 24. This indicator was the highest - 91 in 2013, and the lowest 0 in 2002. The trend for casualties per 1,000 fire incidents is rising. Compared to the Massachusetts value the number of injuries per 1,000 incidents is much higher.Casualties per 1,000 incidents in Wilbraham, MA compared to nearest cities:
(Note: Based on data for all years, including only cities with at least 500 fire incidents)
| Wilbraham: | 22.3 |
| Ludlow: | 22.3 |
| Palmer: | 3.5 |
| Springfield: | 12.5 |
| East Longmeadow: | 23.8 |
| Monson: | 4.6 |
| Chicopee: | 30.2 |
| Longmeadow: | 12.1 |
| Belchertown: | 0.0 |
 32.7% incidents where reported in the morning and 67.3% in the evening. The most fires (16.7%) took place on Sunday, and the least (11.1%) on Tuesday.
 Based on the 808 fires from years 2002 - 2018 most fires (14.5%) took place during April, and the least (5.7%) in October.
 Out of all 14,173 cases reported during the years 2002 - 2018, the most belonged to the categories: Rescue & EMS (61.8%), False Alarm (9.8%), and Service Call (9.0%).
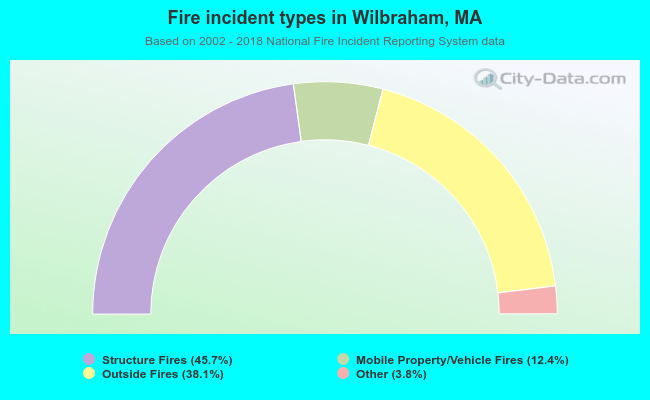 When looking into fire subcategories, the most incidents belonged to: Structure Fires (45.7%), and Outside Fires (38.1%).