East Longmeadow: Fire Incidents, Massachusetts (MA)
Where are fire incidents reported in East Longmeadow, MA
Something went wrong! Please refresh the page.
| Fire incidents reported | |
|---|---|
| Sreet name | Count |
| NORTH MAIN ST | 106 |
| PARKER ST | 70 |
| MAPLE ST | 52 |
| SHAKER RD | 46 |
| SOMERS RD | 46 |
| CHESTNUT ST | 32 |
| PROSPECT ST | 26 |
| ELM ST | 24 |
| KIBBE RD | 24 |
| PEASE RD | 24 |
| CRANE AVE | 22 |
| MILLBROOK DR | 22 |
| BENTON DR | 16 |
| MAPLESHADE AVE | 16 |
| PORTER RD | 16 |
| ALLEN ST | 14 |
| BROOKHAVEN DR | 12 |
| DEER PARK DR | 12 |
| FISHER AVE | 12 |
| GARLAND AVE | 12 |
| HAMPDEN RD | 12 |
| MEADOWBROOK RD | 12 |
| SOMERSVILLE RD | 12 |
| GATES AVE | 10 |
| NOTTINGHAM DR | 10 |
| TAYLOR ST | 10 |
| WESTWOOD AVE | 10 |
| CENTER SQ | 8 |
| FERNWOOD DR | 8 |
| HAZELHURST AVE | 8 |
2002 - 2018 National Fire Incident Reporting System (NFIRS) incidents
- Incident types reported to NFIRS in East Longmeadow, MA
- 3,26641.8%Rescue & EMS
- 1,77622.7%False Alarm
- 1,13014.5%Hazardous Condition
- 5897.5%Fire
- 5687.3%Service Call
- 4415.6%Good Intent Call
- 200.3%Special Incident
- 130.2%Overpressure Rupture
- 90.1%Severe Weather
- Fire incident types reported to NFIRS in East Longmeadow, MA
- 26444.8%Structure Fires
- 23940.6%Outside Fires
- 7312.4%Mobile Property/Vehicle Fires
- 132.2%Other
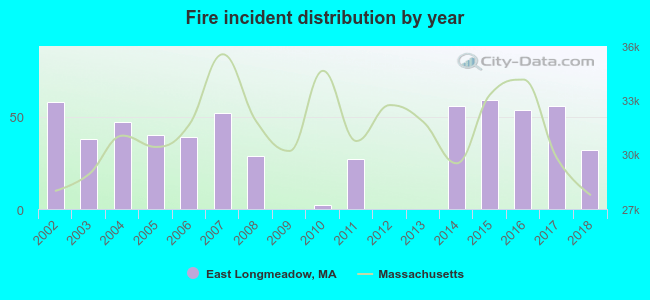 According to the data from the years 2002 - 2018 the average number of fires per year is 35. The highest number of fire incidents - 59 took place in 2015, and the least - 0 in 2009. The data has a dropping trend.
The average number of yearly fire incidents per 10k residents in East Longmeadow, MA compared to nearest cities:
(Note: Based on data for the last 3 years, including only cities with population 5,000 and above)
| East Longmeadow: | 30.1 |
| Longmeadow: | 20.9 |
| Springfield: | 37.6 |
| Hampden: | 92.8 |
| Agawam: | 26.7 |
| West Springfield: | 30.4 |
| Ludlow: | 30.6 |
| Chicopee: | 33.0 |
| Monson: | 31.2 |
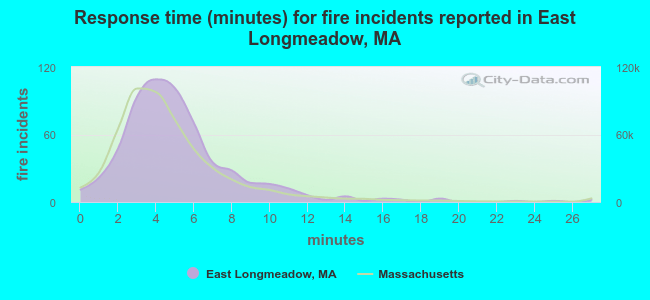 The median response time based on all reported fire incidents is 5 minutes. This is higher compared to the state median value.
The median response time in East Longmeadow, MA compared to nearest cities:
(Note: Based on data for all years, including only cities with at least 500 fire incidents)
| East Longmeadow: | 5 minutes |
| Longmeadow: | 6 minutes |
| Springfield: | 3 minutes |
| Somers: | 6 minutes |
| Enfield: | 4 minutes |
| Wilbraham: | 6 minutes |
| Agawam: | 4 minutes |
| West Springfield: | 3 minutes |
| Ludlow: | 4 minutes |
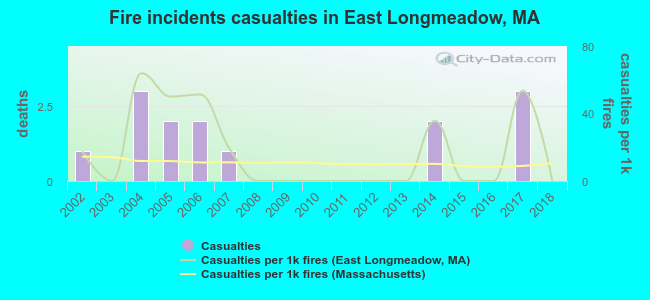 According to the reports from the years 2002 - 2018 the average number of fire-related casualties per year is 1. The highest number of reported injuries - 3 took place in 2004, and the lowest - 0 in 2003. The data has a dropping trend.
The average number of injuries per 1,000 fire incidents is 17. This indicator was the highest - 64 in 2004, and the lowest 0 in 2003. The trend for injuries per 1,000 incidents is declining. Compared to the Massachusetts value the number of injuries per 1,000 incidents is much higher.
According to the reports from the years 2002 - 2018 the average number of fire-related casualties per year is 1. The highest number of reported injuries - 3 took place in 2004, and the lowest - 0 in 2003. The data has a dropping trend.
The average number of injuries per 1,000 fire incidents is 17. This indicator was the highest - 64 in 2004, and the lowest 0 in 2003. The trend for injuries per 1,000 incidents is declining. Compared to the Massachusetts value the number of injuries per 1,000 incidents is much higher.Casualties per 1,000 incidents in East Longmeadow, MA compared to nearest cities:
(Note: Based on data for all years, including only cities with at least 500 fire incidents)
| East Longmeadow: | 23.8 |
| Longmeadow: | 12.1 |
| Springfield: | 12.5 |
| Somers: | 33.8 |
| Enfield: | 14.8 |
| Wilbraham: | 22.3 |
| Agawam: | 29.0 |
| West Springfield: | 23.9 |
| Ludlow: | 22.3 |
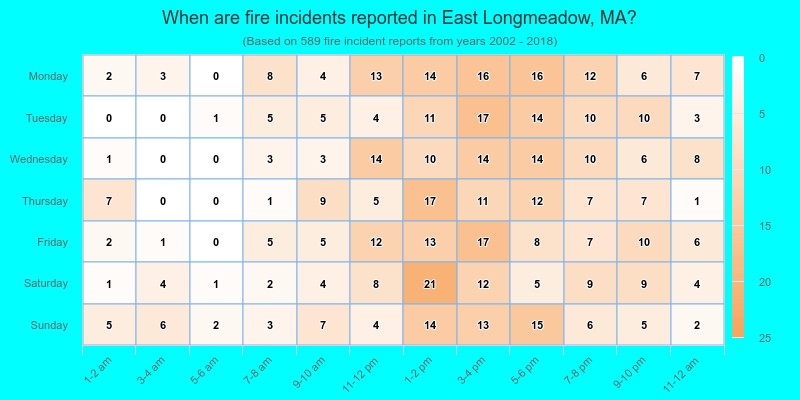
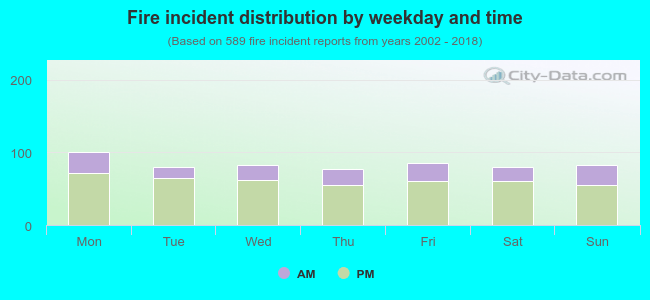 27.2% incidents where reported in the morning and 72.8% in the evening. The most fires (17.1%) took place on Monday, and the least (13.1%) on Thursday.
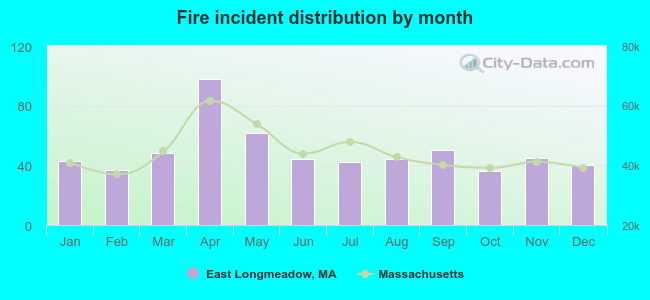 According to the 589 fire incidents from years 2002 - 2018 most fires (16.6%) took place during April, and the least (6.1%) in October.
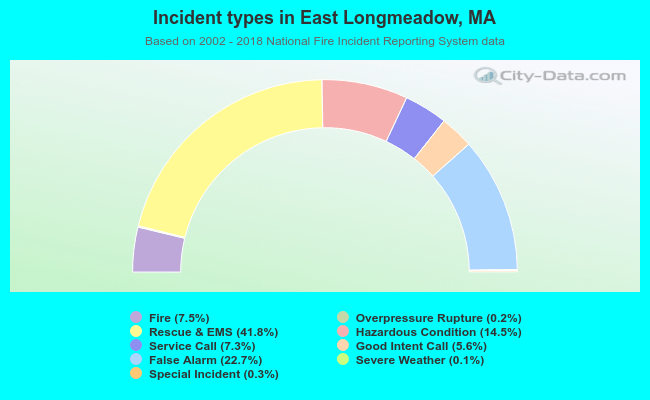 Out of all 7,812 cases reported during the years 2002 - 2018, the most belonged to the categories: Rescue & EMS (41.8%), False Alarm (22.7%), and Hazardous Condition (14.5%).
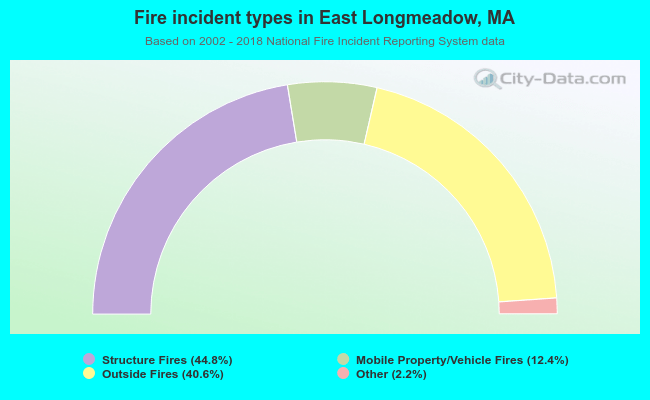 When looking into fire subcategories, the most reports belonged to: Structure Fires (44.8%), and Outside Fires (40.6%).