Ludlow: Fire Incidents, Massachusetts (MA)
Where are fire incidents reported in Ludlow, MA
Something went wrong! Please refresh the page.
| Fire incidents reported | |
|---|---|
| Sreet name | Count |
| CENTER ST | 294 |
| EAST ST | 132 |
| CHAPIN ST | 88 |
| MILLER ST | 78 |
| WEST ST | 60 |
| WEST AVE | 44 |
| FULLER ST | 38 |
| HOLYOKE ST | 34 |
| STATE ST | 34 |
| CADY ST | 30 |
| WILSON ST | 30 |
| HOWARD ST | 28 |
| KENDALL ST | 28 |
| CHESTNUT ST | 26 |
| ROOD ST | 26 |
| SEWALL ST | 26 |
| WINSOR ST | 24 |
| HUBBARD ST | 22 |
| POOLE ST | 22 |
| ALDEN ST | 20 |
| JOY ST | 20 |
| LYON ST | 18 |
| MOODY ST | 18 |
| MOORE ST | 18 |
| PROSPECT ST | 18 |
| BLISSWOOD VILLAGE DR | 16 |
| HIGHLAND AVE | 16 |
| LYONS ST | 16 |
| ROGERS AVE | 16 |
| SHAWINIGAN DR | 16 |
2002 - 2018 National Fire Incident Reporting System (NFIRS) incidents
- Incident types reported to NFIRS in Ludlow, MA
- 2,02626.0%Rescue & EMS
- 1,31416.8%Hazardous Condition
- 1,25616.1%False Alarm
- 1,22615.7%Service Call
- 1,21015.5%Fire
- 7109.1%Good Intent Call
- 450.6%Special Incident
- 100.1%Overpressure Rupture
- Fire incident types reported to NFIRS in Ludlow, MA
- 63852.7%Structure Fires
- 34428.4%Outside Fires
- 19516.1%Mobile Property/Vehicle Fires
- 332.7%Other
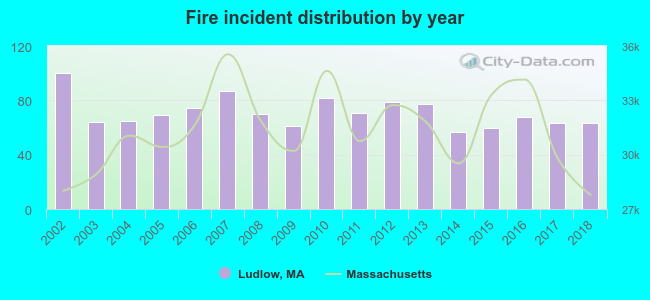 According to the data from the years 2002 - 2018 the average number of fires per year is 71. The highest number of reported fire incidents - 100 took place in 2002, and the least - 57 in 2014. The data has a dropping trend.
The average number of yearly fire incidents per 10k residents in Ludlow, MA compared to nearest cities:
(Note: Based on data for the last 3 years, including only cities with population 5,000 and above)
| Ludlow: | 30.6 |
| Springfield: | 37.6 |
| Chicopee: | 33.0 |
| South Hadley: | 42.3 |
| East Longmeadow: | 30.1 |
| Holyoke: | 90.1 |
| Hampden: | 92.8 |
| Monson: | 31.2 |
| West Springfield: | 30.4 |
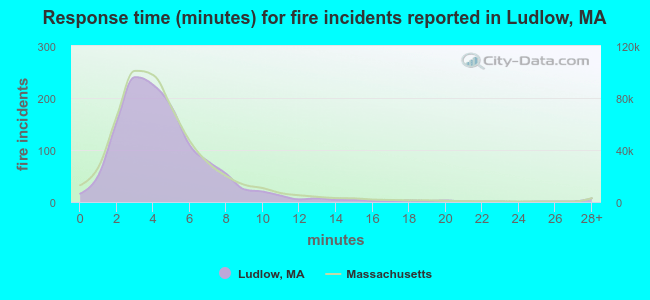 The median response time based on all reported fire incidents is 4 minutes. This is close to the state median value.
The median response time in Ludlow, MA compared to nearest cities:
(Note: Based on data for all years, including only cities with at least 500 fire incidents)
| Ludlow: | 4 minutes |
| Wilbraham: | 6 minutes |
| Springfield: | 3 minutes |
| Chicopee: | 4 minutes |
| South Hadley: | 4 minutes |
| Palmer: | 7 minutes |
| East Longmeadow: | 5 minutes |
| Belchertown: | 10 minutes |
| Holyoke: | 4 minutes |
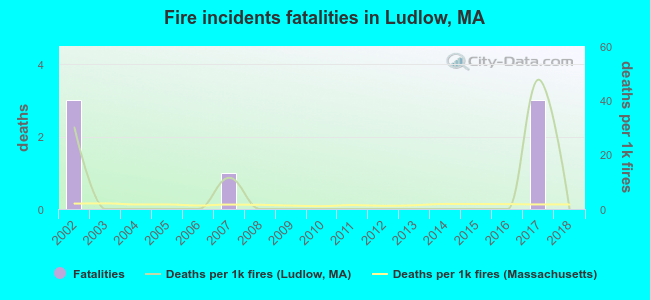 Based on the reports from the years 2002 - 2018 the average number of fire-related yearly deaths is 0. The highest number of deaths - 3 took place in 2002, and the lowest - 0 in 2003. The data has a declining trend.
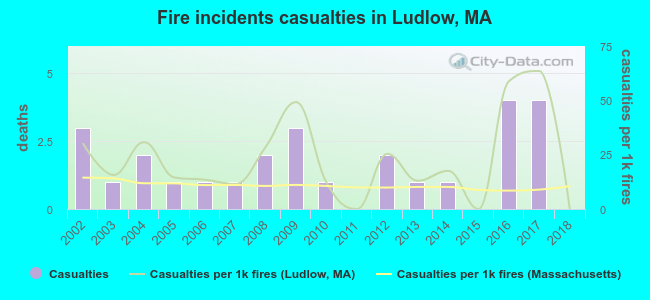 According to the data from the years 2002 - 2018 the average number of fire-related casualties per year is 2. The highest number of injuries - 4 took place in 2016, and the lowest - 0 in 2011. The data has a dropping trend.
The average number of casualties per 1,000 fire incidents is 23. This indicator was the highest - 63 in 2017, and the lowest 0 in 2011. The trend for casualties per 1,000 incidents is decreasing. Compared to the state value the number of casualties per 1,000 fires is much higher.
According to the data from the years 2002 - 2018 the average number of fire-related casualties per year is 2. The highest number of injuries - 4 took place in 2016, and the lowest - 0 in 2011. The data has a dropping trend.
The average number of casualties per 1,000 fire incidents is 23. This indicator was the highest - 63 in 2017, and the lowest 0 in 2011. The trend for casualties per 1,000 incidents is decreasing. Compared to the state value the number of casualties per 1,000 fires is much higher.Casualties per 1,000 incidents in Ludlow, MA compared to nearest cities:
(Note: Based on data for all years, including only cities with at least 500 fire incidents)
| Ludlow: | 22.3 |
| Wilbraham: | 22.3 |
| Springfield: | 12.5 |
| Chicopee: | 30.2 |
| South Hadley: | 11.2 |
| Palmer: | 3.5 |
| East Longmeadow: | 23.8 |
| Belchertown: | 0.0 |
| Holyoke: | 8.8 |
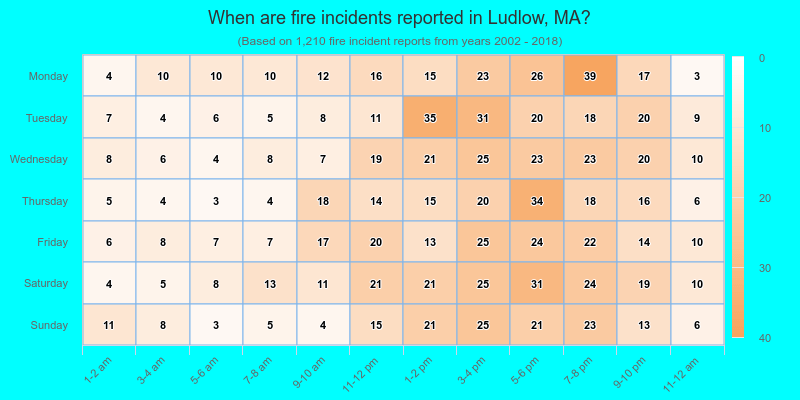
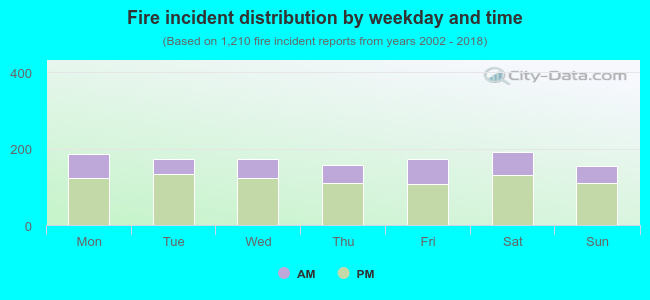 31.1% incidents where reported in the morning and 68.9% in the evening. The most fires (15.9%) took place on Saturday, and the least (12.8%) on Sunday.
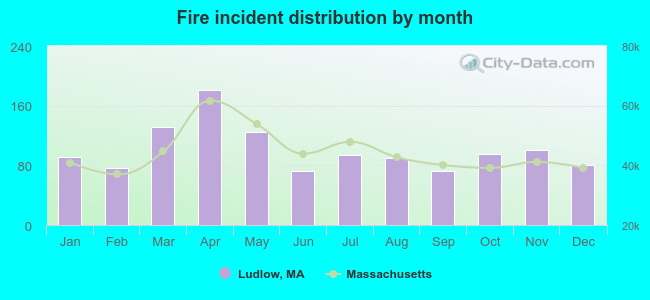 Based on the 1,210 reports from years 2002 - 2018 most fires (15.0%) took place during April, and the least (6.0%) in June.
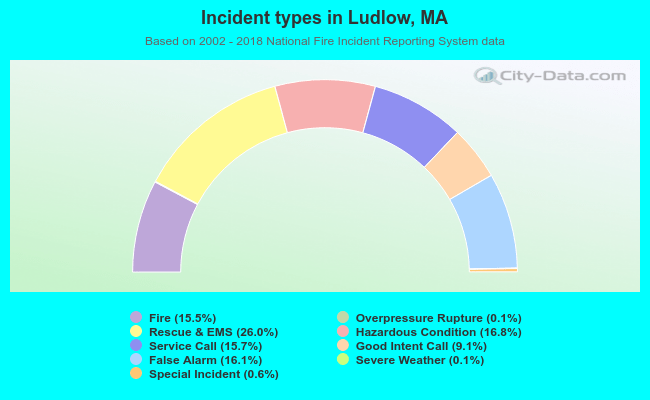 Out of all 7,801 cases reported during the years 2002 - 2018, the most belonged to the categories: Rescue & EMS (26.0%), Hazardous Condition (16.8%), and False Alarm (16.1%).
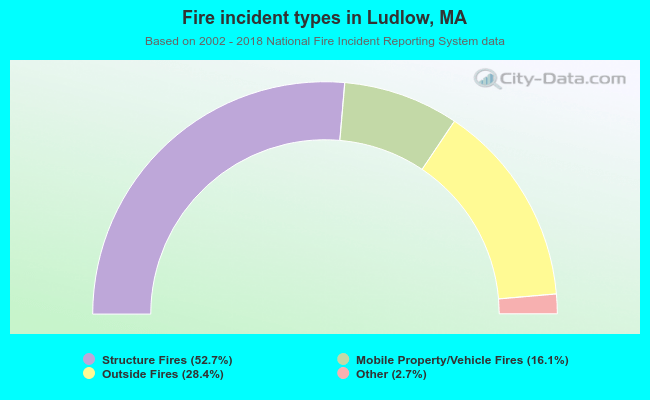 When looking into fire subcategories, the most incidents belonged to: Structure Fires (52.7%), and Outside Fires (28.4%).