Holyoke: Fire Incidents, Massachusetts (MA)
Where are fire incidents reported in Holyoke, MA
Something went wrong! Please refresh the page.
| Fire incidents reported | |
|---|---|
| Sreet name | Count |
| NORTHAMPTON ST | 376 |
| MAIN ST | 332 |
| CABOT ST | 210 |
| MAPLE ST | 204 |
| HIGH ST | 200 |
| BEECH ST | 196 |
| DWIGHT ST | 176 |
| HOLYOKE ST | 176 |
| SARGEANT ST | 172 |
| APPLETON ST | 142 |
| PLEASANT ST | 106 |
| SOUTH ST | 104 |
| ELM ST | 98 |
| OAK ST | 94 |
| ESSEX ST | 92 |
| WALNUT ST | 90 |
| WHITNEY AVE | 84 |
| CHESTNUT ST | 82 |
| SUFFOLK ST | 80 |
| HAMPDEN ST | 78 |
| LOWER WESTFIELD RD | 76 |
| HAMILTON ST | 74 |
| BOWERS ST | 72 |
| HOMESTEAD AVE | 70 |
| CHERRY ST | 68 |
| LYMAN ST | 66 |
| HAMPSHIRE ST | 64 |
| JARVIS AVE | 64 |
| NONOTUCK ST | 64 |
| S BRIDGE ST | 64 |
2002 - 2018 National Fire Incident Reporting System (NFIRS) incidents
- Incident types reported to NFIRS in Holyoke, MA
- 11,09242.3%Rescue & EMS
- 5,18719.8%False Alarm
- 3,53813.5%Fire
- 3,38312.9%Good Intent Call
- 1,6496.3%Hazardous Condition
- 1,2474.8%Service Call
- 640.2%Special Incident
- 500.2%Overpressure Rupture
- Fire incident types reported to NFIRS in Holyoke, MA
- 2,00756.7%Structure Fires
- 98928.0%Outside Fires
- 37110.5%Mobile Property/Vehicle Fires
- 1714.8%Other
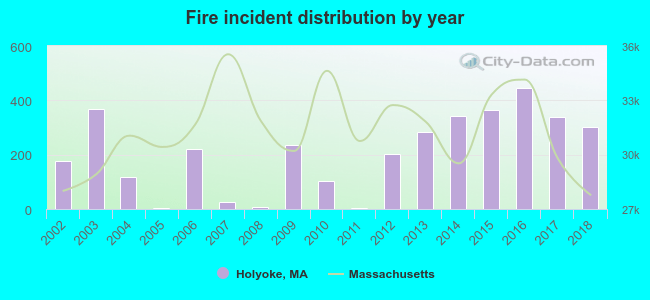 Based on the data from the years 2002 - 2018 the average number of fire incidents per year is 208. The highest number of reported fire incidents - 445 took place in 2016, and the least - 3 in 2005. The data has a rising trend.
The average number of yearly fire incidents per 10k residents in Holyoke, MA compared to nearest cities:
(Note: Based on data for the last 3 years, including only cities with population 5,000 and above)
| Holyoke: | 90.1 |
| Chicopee: | 33.0 |
| South Hadley: | 42.3 |
| Easthampton: | 27.6 |
| Southampton: | 41.4 |
| West Springfield: | 30.4 |
| Springfield: | 37.6 |
| Westfield: | 26.4 |
| Ludlow: | 30.6 |
 The median response time based on all reported fire incidents is 4 minutes. This is similar to the state median value.
The median response time in Holyoke, MA compared to nearest cities:
(Note: Based on data for all years, including only cities with at least 500 fire incidents)
| Holyoke: | 4 minutes |
| Chicopee: | 4 minutes |
| South Hadley: | 4 minutes |
| Easthampton: | 6 minutes |
| West Springfield: | 3 minutes |
| Springfield: | 3 minutes |
| Westfield: | 5 minutes |
| Ludlow: | 4 minutes |
| Northampton: | 6 minutes |
 According to the reports from the years 2002 - 2018 the average number of fire-related yearly deaths is 1. The highest number of deaths - 4 took place in 2017, and the lowest - 0 in 2004. The data has a declining trend.
The average number of fatalities per 1,000 fire incidents is 22. This indicator was the highest - 333 in 2008, and the lowest 0 in 2004. The trend for fatalities per 1,000 fires is dropping. Compared to the state value the number of deaths per 1,000 fires is higher.
According to the reports from the years 2002 - 2018 the average number of fire-related yearly deaths is 1. The highest number of deaths - 4 took place in 2017, and the lowest - 0 in 2004. The data has a declining trend.
The average number of fatalities per 1,000 fire incidents is 22. This indicator was the highest - 333 in 2008, and the lowest 0 in 2004. The trend for fatalities per 1,000 fires is dropping. Compared to the state value the number of deaths per 1,000 fires is higher.Deaths per 1,000 incidents in Holyoke, MA compared to nearest cities:
(Note: Based on data for all years, including only cities with at least 2,500 fire incidents)
| Holyoke: | 3.1 |
| Chicopee: | 2.5 |
| Springfield: | 2.4 |
| Enfield: | 2.5 |
 Based on the reports from the years 2002 - 2018 the average number of fire-related casualties per year is 2. The highest number of reported injuries - 16 took place in 2003, and the lowest - 0 in 2002. The data has a rising trend.
The average number of casualties per 1,000 fires is 16. This indicator was the highest - 167 in 2008, and the lowest 0 in 2002. The trend for injuries per 1,000 fire incidents is rising. Compared to the state value the number of injuries per 1,000 fires is lower.
Based on the reports from the years 2002 - 2018 the average number of fire-related casualties per year is 2. The highest number of reported injuries - 16 took place in 2003, and the lowest - 0 in 2002. The data has a rising trend.
The average number of casualties per 1,000 fires is 16. This indicator was the highest - 167 in 2008, and the lowest 0 in 2002. The trend for injuries per 1,000 fire incidents is rising. Compared to the state value the number of injuries per 1,000 fires is lower.Casualties per 1,000 incidents in Holyoke, MA compared to nearest cities:
(Note: Based on data for all years, including only cities with at least 500 fire incidents)
| Holyoke: | 8.8 |
| Chicopee: | 30.2 |
| South Hadley: | 11.2 |
| Easthampton: | 17.3 |
| West Springfield: | 23.9 |
| Springfield: | 12.5 |
| Westfield: | 16.9 |
| Ludlow: | 22.3 |
| Northampton: | 22.1 |
 31.2% incidents where reported in the morning and 68.8% in the evening. The most fires (15.4%) took place on Sunday, and the least (12.7%) on Tuesday.
 Based on the 3,538 fire incidents from years 2002 - 2018 most fires (12.8%) took place during April, and the least (6.8%) in February.
 Out of all 26,216 cases reported during the years 2002 - 2018, the most belonged to the categories: Rescue & EMS (42.3%), False Alarm (19.8%), and Fire (13.5%).
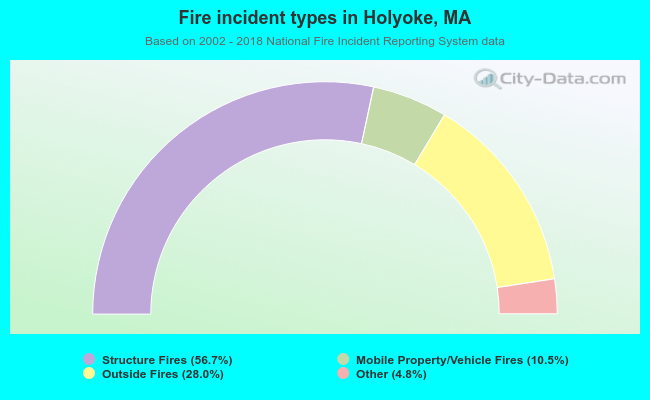 When looking into fire subcategories, the most incidents belonged to: Structure Fires (56.7%), and Outside Fires (28.0%).