Westfield: Fire Incidents, Massachusetts (MA)
Where are fire incidents reported in Westfield, MA
Something went wrong! Please refresh the page.
| Fire incidents reported | |
|---|---|
| Sreet name | Count |
| SOUTHAMPTON RD | 188 |
| ELM ST | 140 |
| E MOUNTAIN RD | 132 |
| MAIN ST | 128 |
| UNION ST | 120 |
| E MAIN ST | 116 |
| MASS TPKE | 112 |
| WESTERN | 108 |
| BROAD ST | 94 |
| N ELM ST | 88 |
| MONTGOMERY RD | 86 |
| WASHINGTON ST | 86 |
| WESTERN AVE | 76 |
| SOUTHWICK RD | 74 |
| SPRINGFIELD RD | 72 |
| FRANKLIN ST | 68 |
| RUSSELL RD | 68 |
| LOCKHOUSE RD | 66 |
| NORTH RD | 66 |
| W SILVER ST | 50 |
| GRANVILLE RD | 48 |
| MEADOW ST | 46 |
| COURT ST | 40 |
| POCHASSIC RD | 40 |
| THOMAS ST | 40 |
| MONTGOMERY ST | 36 |
| RUSSELLVILLE RD | 34 |
| LITTLE RIVER RD | 32 |
| NOTRE DAME ST | 32 |
| S MAPLE ST | 32 |
| Other | 51 |
2002 - 2018 National Fire Incident Reporting System (NFIRS) incidents
- Incident types reported to NFIRS in Westfield, MA
- 6,71030.3%Rescue & EMS
- 4,90922.1%Service Call
- 3,75116.9%False Alarm
- 2,36910.7%Fire
- 2,25110.2%Hazardous Condition
- 2,0889.4%Good Intent Call
- 610.3%Special Incident
- 240.1%Overpressure Rupture
- Fire incident types reported to NFIRS in Westfield, MA
- 1,21951.5%Structure Fires
- 73130.9%Outside Fires
- 34714.6%Mobile Property/Vehicle Fires
- 723.0%Other
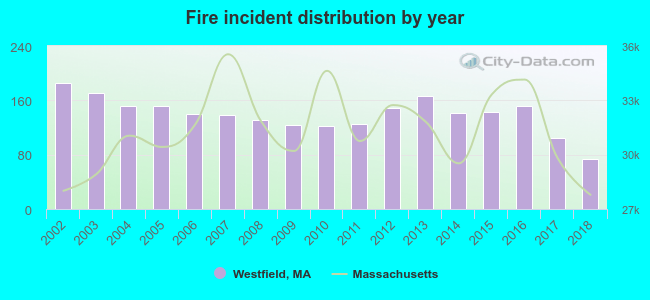 According to the data from the years 2002 - 2018 the average number of fire incidents per year is 139. The highest number of reported fires - 185 took place in 2002, and the least - 74 in 2018. The data has a declining trend.
The average number of yearly fire incidents per 10k residents in Westfield, MA compared to nearest cities:
(Note: Based on data for the last 3 years, including only cities with population 5,000 and above)
| Westfield: | 26.4 |
| Southwick: | 43.9 |
| West Springfield: | 30.4 |
| Agawam: | 26.7 |
| Southampton: | 41.4 |
| Holyoke: | 90.1 |
| Chicopee: | 33.0 |
| Easthampton: | 27.6 |
| Springfield: | 37.6 |
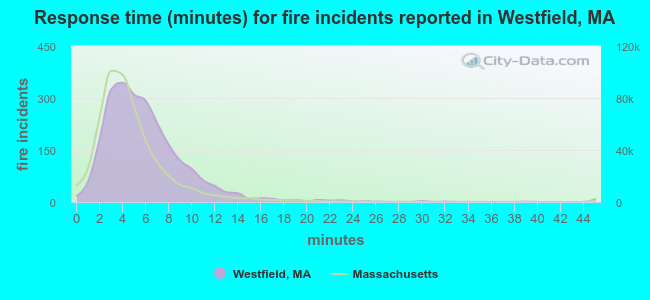 The median response time based on all reported fire incidents is 5 minutes. This is higher than the state median value.
The median response time in Westfield, MA compared to nearest cities:
(Note: Based on data for all years, including only cities with at least 500 fire incidents)
| Westfield: | 5 minutes |
| Southwick: | 9 minutes |
| West Springfield: | 3 minutes |
| Agawam: | 4 minutes |
| Holyoke: | 4 minutes |
| Chicopee: | 4 minutes |
| Easthampton: | 6 minutes |
| Springfield: | 3 minutes |
| Longmeadow: | 6 minutes |
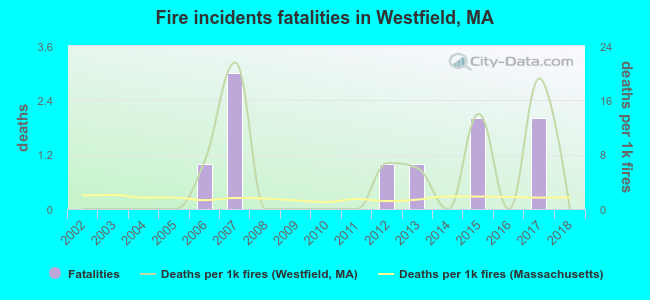 According to the data from the years 2002 - 2018 the average number of fire-related yearly deaths is 1. The highest number of reported deaths - 3 took place in 2007, and the lowest - 0 in 2002. The data has a constant trend.
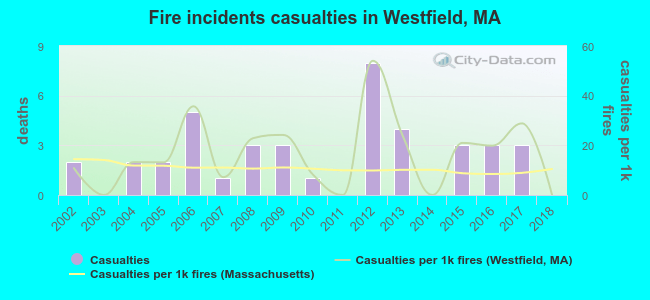 Based on the reports from the years 2002 - 2018 the average number of fire-related yearly casualties is 2. The highest number of casualties - 8 took place in 2012, and the lowest - 0 in 2003. The data has a dropping trend.
The average number of casualties per 1,000 fires is 17. This indicator was the highest - 54 in 2012, and the lowest 0 in 2003. The trend for injuries per 1,000 incidents is declining. Compared to the state value the number of injuries per 1,000 fire incidents is higher.
Based on the reports from the years 2002 - 2018 the average number of fire-related yearly casualties is 2. The highest number of casualties - 8 took place in 2012, and the lowest - 0 in 2003. The data has a dropping trend.
The average number of casualties per 1,000 fires is 17. This indicator was the highest - 54 in 2012, and the lowest 0 in 2003. The trend for injuries per 1,000 incidents is declining. Compared to the state value the number of injuries per 1,000 fire incidents is higher.Casualties per 1,000 incidents in Westfield, MA compared to nearest cities:
(Note: Based on data for all years, including only cities with at least 500 fire incidents)
| Westfield: | 16.9 |
| Southwick: | 9.3 |
| West Springfield: | 23.9 |
| Agawam: | 29.0 |
| Holyoke: | 8.8 |
| Chicopee: | 30.2 |
| Easthampton: | 17.3 |
| Springfield: | 12.5 |
| Longmeadow: | 12.1 |
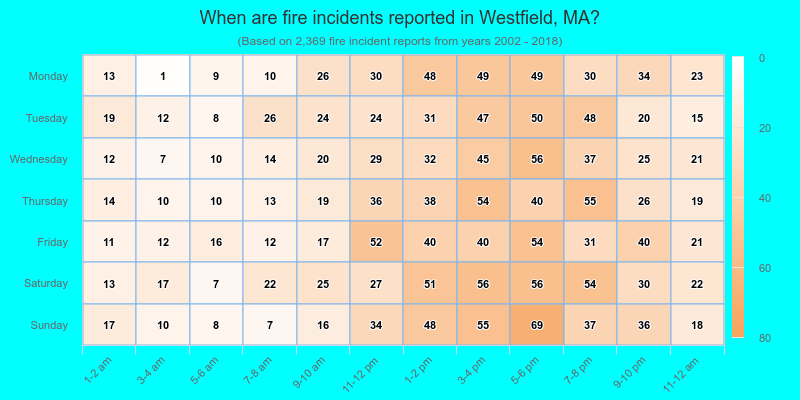
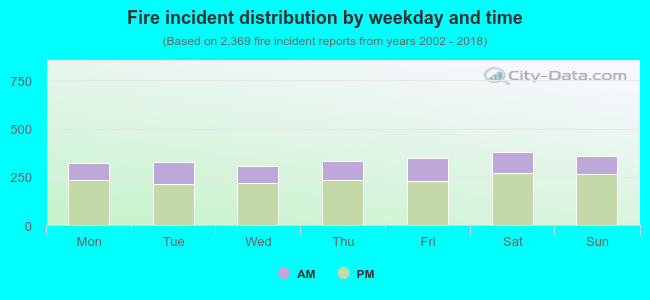 30.4% incidents where reported in the morning and 69.6% in the evening. The most fires (16.0%) took place on Saturday, and the least (13.0%) on Wednesday.
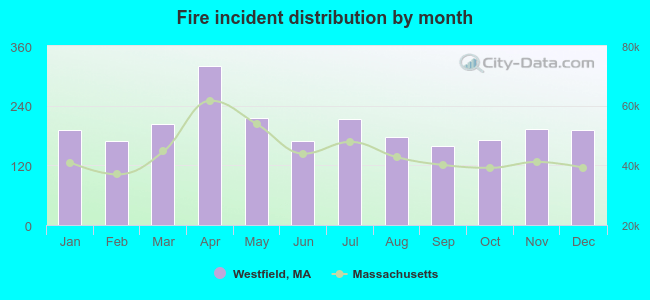 Based on the 2,369 fire incidents from years 2002 - 2018 most fires (13.5%) took place during April, and the least (6.7%) in September.
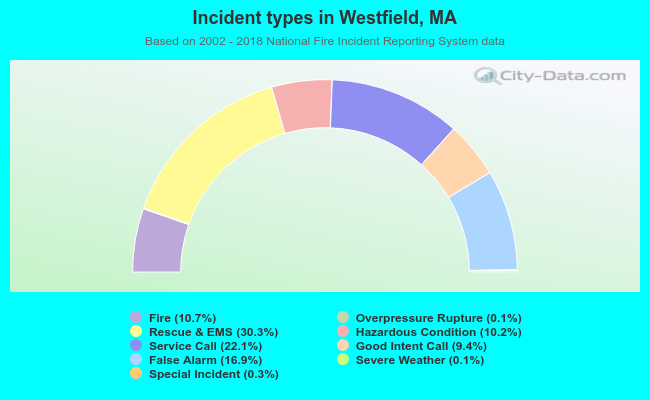 Out of all 22,175 cases reported during the years 2002 - 2018, the most belonged to the categories: Rescue & EMS (30.3%), Service Call (22.1%), and False Alarm (16.9%).
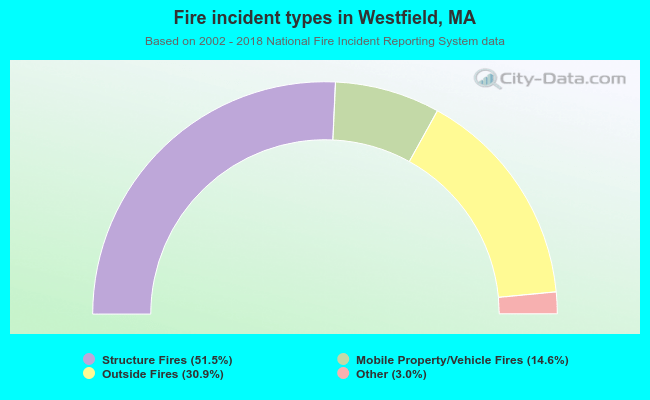 When looking into fire subcategories, the most incidents belonged to: Structure Fires (51.5%), and Outside Fires (30.9%).