Northampton: Fire Incidents, Massachusetts (MA)
Where are fire incidents reported in Northampton, MA
Something went wrong! Please refresh the page.
| Fire incidents reported | |
|---|---|
| Sreet name | Count |
| KING ST | 164 |
| MAIN ST | 98 |
| ROUTE 91 | 92 |
| PLEASANT ST | 86 |
| CONZ ST | 72 |
| HOCKANUM RD | 70 |
| WEST ST | 60 |
| DAMON RD | 58 |
| N KING ST | 56 |
| PROSPECT ST | 56 |
| BRIDGE ST | 54 |
| FRUIT ST | 50 |
| ELM ST | 48 |
| STATE ST | 48 |
| HAWLEY ST | 44 |
| MT TOM RD | 42 |
| OUT OF TOWN | 40 |
| SOUTH ST | 40 |
| EASTHAMPTON RD | 36 |
| OLD SPRINGFIELD RD | 36 |
| BRIDGE RD | 32 |
| JACKSON ST | 30 |
| MARKET ST | 30 |
| OLD FERRY RD | 28 |
| HATFIELD ST | 22 |
| NORTH ST | 22 |
| WILLIAMS ST | 22 |
| BARRETT ST | 20 |
| CARLON DR | 20 |
| FAIR ST | 20 |
2002 - 2018 National Fire Incident Reporting System (NFIRS) incidents
- Incident types reported to NFIRS in Northampton, MA
- 13,32356.0%Rescue & EMS
- 3,92116.5%False Alarm
- 2,66811.2%Hazardous Condition
- 1,2245.1%Service Call
- 1,2215.1%Fire
- 1,2015.1%Good Intent Call
- 1170.5%Special Incident
- 970.4%Overpressure Rupture
- Fire incident types reported to NFIRS in Northampton, MA
- 53243.6%Structure Fires
- 36529.9%Outside Fires
- 20116.5%Mobile Property/Vehicle Fires
- 12310.1%Other
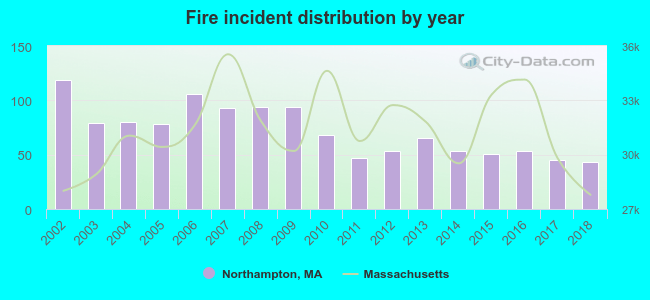 According to the data from the years 2002 - 2018 the average number of fire incidents per year is 72. The highest number of reported fire incidents - 119 took place in 2002, and the least - 43 in 2018. The data has a dropping trend.
The average number of yearly fire incidents per 10k residents in Northampton, MA compared to nearest cities:
(Note: Based on data for the last 3 years, including only cities with population 5,000 and above)
| Northampton: | 16.5 |
| Easthampton: | 27.6 |
| Hadley: | 23.5 |
| South Hadley: | 42.3 |
| Southampton: | 41.4 |
| Amherst: | 19.9 |
| Holyoke: | 90.1 |
| Chicopee: | 33.0 |
| Deerfield: | 20.2 |
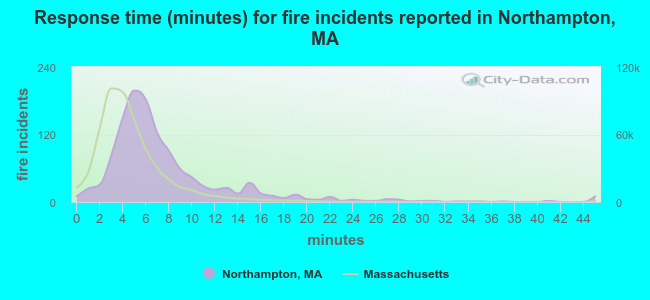 The median response time based on all reported fire incidents is 6 minutes. This is higher than the state median value.
The median response time in Northampton, MA compared to nearest cities:
(Note: Based on data for all years, including only cities with at least 500 fire incidents)
| Northampton: | 6 minutes |
| Easthampton: | 6 minutes |
| South Hadley: | 4 minutes |
| Amherst: | 6 minutes |
| Holyoke: | 4 minutes |
| Chicopee: | 4 minutes |
| Belchertown: | 10 minutes |
| Ludlow: | 4 minutes |
| Westfield: | 5 minutes |
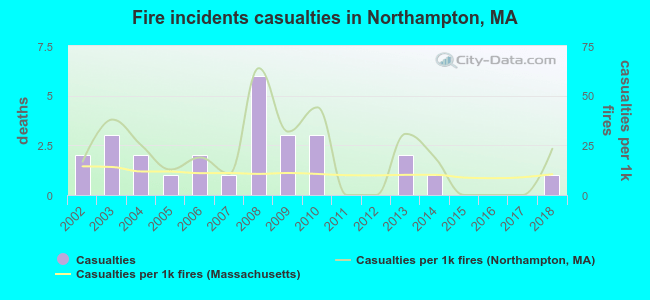 Based on the data from the years 2002 - 2018 the average number of fire-related casualties per year is 2. The highest number of injuries - 6 took place in 2008, and the lowest - 0 in 2011. The data has a declining trend.
The average number of casualties per 1,000 fire incidents is 20. This indicator was the highest - 64 in 2008, and the lowest 0 in 2011. The trend for injuries per 1,000 fire incidents is increasing. Compared to the state value the number of injuries per 1,000 fires is much higher.
Based on the data from the years 2002 - 2018 the average number of fire-related casualties per year is 2. The highest number of injuries - 6 took place in 2008, and the lowest - 0 in 2011. The data has a declining trend.
The average number of casualties per 1,000 fire incidents is 20. This indicator was the highest - 64 in 2008, and the lowest 0 in 2011. The trend for injuries per 1,000 fire incidents is increasing. Compared to the state value the number of injuries per 1,000 fires is much higher.Casualties per 1,000 incidents in Northampton, MA compared to nearest cities:
(Note: Based on data for all years, including only cities with at least 500 fire incidents)
| Northampton: | 22.1 |
| Easthampton: | 17.3 |
| South Hadley: | 11.2 |
| Amherst: | 27.6 |
| Holyoke: | 8.8 |
| Chicopee: | 30.2 |
| Belchertown: | 0.0 |
| Ludlow: | 22.3 |
| Westfield: | 16.9 |
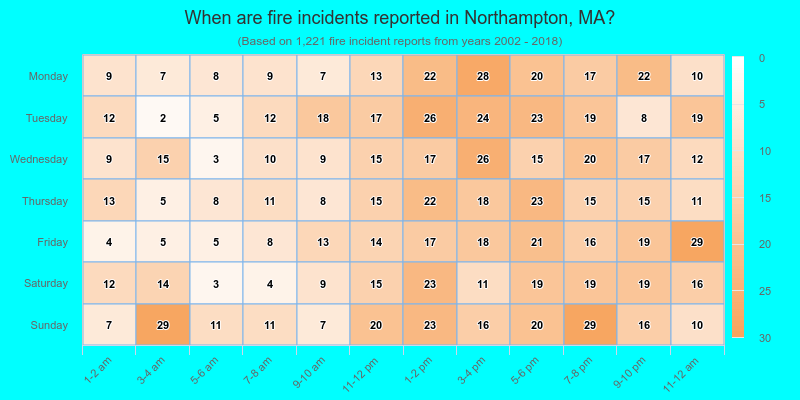
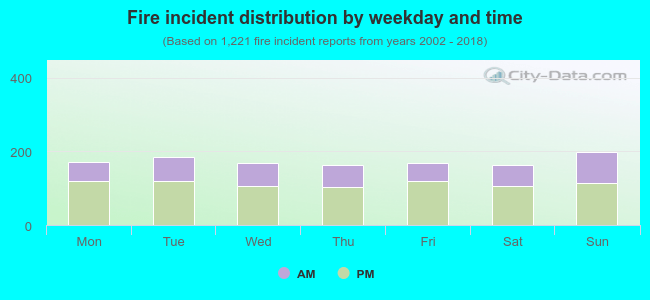 35.3% incidents where reported in the morning and 64.7% in the evening. The most fires (16.3%) took place on Sunday, and the least (13.4%) on Thursday.
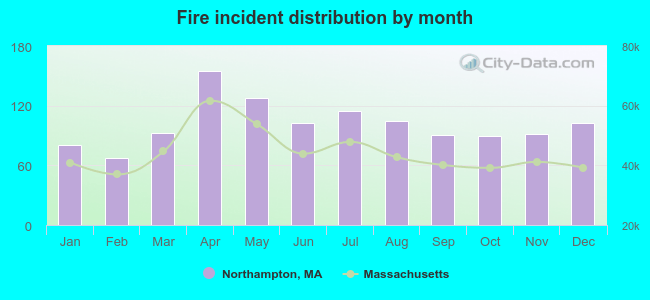 Based on the 1,221 fire incident reports from years 2002 - 2018 most fires (12.7%) took place during April, and the least (5.5%) in February.
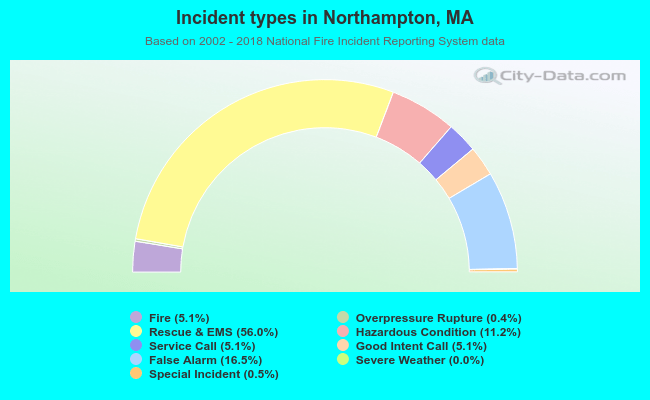 Out of all 23,781 cases reported during the years 2002 - 2018, the most belonged to the categories: Rescue & EMS (56.0%), False Alarm (16.5%), and Hazardous Condition (11.2%).
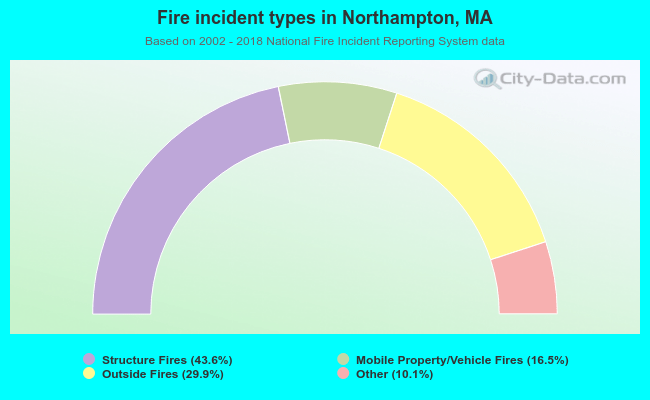 When looking into fire subcategories, the most incidents belonged to: Structure Fires (43.6%), and Outside Fires (29.9%).