Spencer: Fire Incidents, Massachusetts (MA)
Where are fire incidents reported in Spencer, MA
Something went wrong! Please refresh the page.
| Fire incidents reported | |
|---|---|
| Sreet name | Count |
| HOWE VILLAGE | 466 |
| MAIN ST | 356 |
| MAPLE ST | 80 |
| GREENVILLE ST | 70 |
| MECHANIC ST | 62 |
| SPENCER RD | 60 |
| CHARLTON RD | 50 |
| CHESTNUT ST | 50 |
| SMITHVILLE RD | 50 |
| NORTH SPENCER RD | 46 |
| WILSON ST | 42 |
| MCCORMICK RD | 40 |
| CHURCH ST | 36 |
| PLEASANT ST | 36 |
| PAXTON RD | 32 |
| ASH ST | 30 |
| CHERRY ST | 30 |
| GROVE ST | 30 |
| LAKE ST | 26 |
| NORTHWEST RD | 26 |
| SOUTH SPENCER RD | 24 |
| HOWE RD | 22 |
| ROUTE 49 HWY | 22 |
| THOMPSON POND RD | 22 |
| EAST CHARLTON RD | 20 |
| HASTINGS RD | 20 |
| HIGHLAND ST | 20 |
| MCDONALD ST | 20 |
| R JONES RD | 20 |
| TEMPLE ST | 20 |
2002 - 2018 National Fire Incident Reporting System (NFIRS) incidents
- Incident types reported to NFIRS in Spencer, MA
- 1,66534.2%Hazardous Condition
- 1,38528.5%Fire
- 69614.3%False Alarm
- 55511.4%Service Call
- 2755.7%Good Intent Call
- 2304.7%Rescue & EMS
- 240.5%Severe Weather
- 190.4%Special Incident
- 150.3%Overpressure Rupture
- Fire incident types reported to NFIRS in Spencer, MA
- 88964.2%Structure Fires
- 35925.9%Outside Fires
- 1128.1%Mobile Property/Vehicle Fires
- 251.8%Other
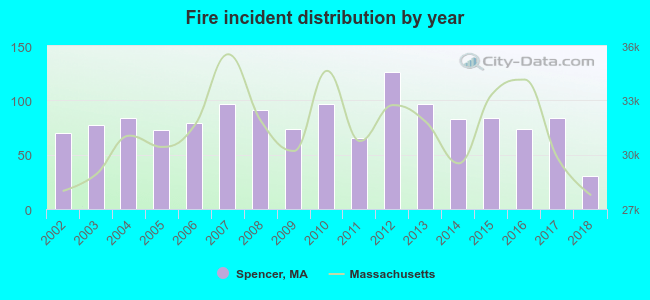 According to the data from the years 2002 - 2018 the average number of fire incidents per year is 81. The highest number of reported fires - 126 took place in 2012, and the least - 30 in 2018. The data has a decreasing trend.
The average number of yearly fire incidents per 10k residents in Spencer, MA compared to nearest cities:
(Note: Based on data for the last 3 years, including only cities with population 5,000 and above)
| Spencer: | 109.9 |
| Leicester: | 33.7 |
| Charlton: | 51.9 |
| Auburn: | 39.3 |
| Worcester: | 74.5 |
| Holden: | 19.8 |
| Oxford: | 162.8 |
| Southbridge: | 40.9 |
| Millbury: | 51.5 |
 The median response time based on all reported fire incidents is 7 minutes. This is higher than the state median value.
The median response time in Spencer, MA compared to nearest cities:
(Note: Based on data for all years, including only cities with at least 500 fire incidents)
| Spencer: | 7 minutes |
| Leicester: | 5 minutes |
| Charlton: | 8 minutes |
| Auburn: | 4 minutes |
| Worcester: | 4 minutes |
| Holden: | 6 minutes |
| Sturbridge: | 9 minutes |
| Oxford: | 8 minutes |
| Southbridge: | 4 minutes |
 Based on the reports from the years 2002 - 2018 the average number of fire-related fatalities per year is 0. The highest number of deaths - 2 took place in 2010, and the lowest - 0 in 2002. The data has a constant trend.
 Based on the reports from the years 2002 - 2018 the average number of fire-related casualties per year is 1. The highest number of reported casualties - 4 took place in 2006, and the lowest - 0 in 2002. The data has a rising trend.
The average number of casualties per 1,000 fires is 20. This indicator was the highest - 67 in 2018, and the lowest 0 in 2002. The trend for casualties per 1,000 fire incidents is increasing. Compared to the Massachusetts value the number of injuries per 1,000 incidents is higher.
Based on the reports from the years 2002 - 2018 the average number of fire-related casualties per year is 1. The highest number of reported casualties - 4 took place in 2006, and the lowest - 0 in 2002. The data has a rising trend.
The average number of casualties per 1,000 fires is 20. This indicator was the highest - 67 in 2018, and the lowest 0 in 2002. The trend for casualties per 1,000 fire incidents is increasing. Compared to the Massachusetts value the number of injuries per 1,000 incidents is higher.Casualties per 1,000 incidents in Spencer, MA compared to nearest cities:
(Note: Based on data for all years, including only cities with at least 500 fire incidents)
| Spencer: | 18.1 |
| Leicester: | 11.9 |
| Charlton: | 12.7 |
| Auburn: | 2.5 |
| Worcester: | 2.6 |
| Holden: | 15.1 |
| Sturbridge: | 12.0 |
| Oxford: | 26.0 |
| Southbridge: | 33.5 |
 27.4% incidents where reported in the morning and 72.6% in the evening. The most fires (17.9%) took place on Saturday, and the least (12.3%) on Wednesday.
 Based on the 1,385 fire incident reports from years 2002 - 2018 most fires (15.8%) took place during April, and the least (6.5%) in September.
 Out of all 4,864 cases reported during the years 2002 - 2018, the most belonged to the categories: Hazardous Condition (34.2%), Fire (28.5%), and False Alarm (14.3%).
 When looking into fire subcategories, the most reports belonged to: Structure Fires (64.2%), and Outside Fires (25.9%).