Oxford: Fire Incidents, Massachusetts (MA)
Where are fire incidents reported in Oxford, MA
Something went wrong! Please refresh the page.
| Fire incidents reported | |
|---|---|
| Sreet name | Count |
| MAIN ST | 358 |
| ROUTE 395 | 124 |
| ORCHARD HILL DR | 104 |
| OLD WEBSTER RD | 102 |
| SUTTON AVE | 96 |
| MILLBURY RD | 66 |
| SOUTHBRIDGE RD | 64 |
| FEDERAL HILL RD | 60 |
| WHEELOCK ST | 58 |
| CHARLTON ST | 48 |
| LEICESTER ST | 46 |
| ROCKY HILL RD | 46 |
| STAFFORD ST | 46 |
| FORT HILL RD | 34 |
| CONLIN RD | 30 |
| JOE JENNY RD | 30 |
| DUDLEY RD | 28 |
| LOCUST ST | 28 |
| DEPOT RD | 26 |
| LOVETT RD | 26 |
| PLEASANT ST | 26 |
| HOWARTH RD | 24 |
| INDUSTRIAL PARK EAST RD | 24 |
| THAYER POND DR | 24 |
| WELLS ST | 24 |
| HUGUENOT RD | 22 |
| OLD WORCESTER RD | 22 |
| SUNSET AVE | 22 |
| CLARA BARTON RD | 20 |
| HARWOOD ST | 18 |
2002 - 2018 National Fire Incident Reporting System (NFIRS) incidents
- Incident types reported to NFIRS in Oxford, MA
- 1,38327.8%Fire
- 81716.4%Rescue & EMS
- 80516.2%Hazardous Condition
- 76715.4%False Alarm
- 69413.9%Service Call
- 4729.5%Good Intent Call
- 240.5%Special Incident
- 90.2%Severe Weather
- 80.2%Overpressure Rupture
- Fire incident types reported to NFIRS in Oxford, MA
- 64046.3%Structure Fires
- 47234.1%Outside Fires
- 20214.6%Mobile Property/Vehicle Fires
- 695.0%Other
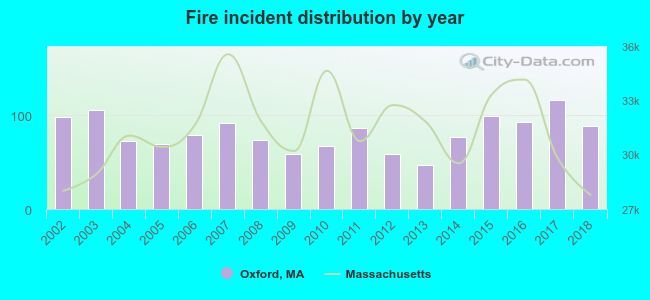 According to the data from the years 2002 - 2018 the average number of fires per year is 81. The highest number of reported fire incidents - 116 took place in 2017, and the least - 47 in 2013. The data has a dropping trend.
The average number of yearly fire incidents per 10k residents in Oxford, MA compared to nearest cities:
(Note: Based on data for the last 3 years, including only cities with population 5,000 and above)
| Oxford: | 162.8 |
| Webster: | 65.7 |
| Dudley: | 36.3 |
| Charlton: | 51.9 |
| Auburn: | 39.3 |
| Sutton: | 44.3 |
| Millbury: | 51.5 |
| Douglas: | 33.4 |
| Leicester: | 33.7 |
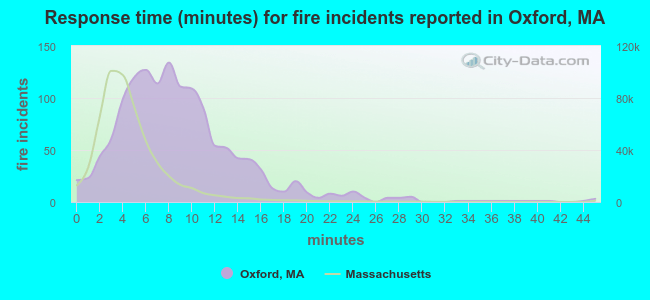 The median response time based on all reported fire incidents is 8 minutes. This is higher than the state median value.
The median response time in Oxford, MA compared to nearest cities:
(Note: Based on data for all years, including only cities with at least 500 fire incidents)
| Oxford: | 8 minutes |
| Webster: | 8 minutes |
| Dudley: | 9 minutes |
| Charlton: | 8 minutes |
| Auburn: | 4 minutes |
| Sutton: | 8 minutes |
| Millbury: | 6 minutes |
| Douglas: | 8 minutes |
| Leicester: | 5 minutes |
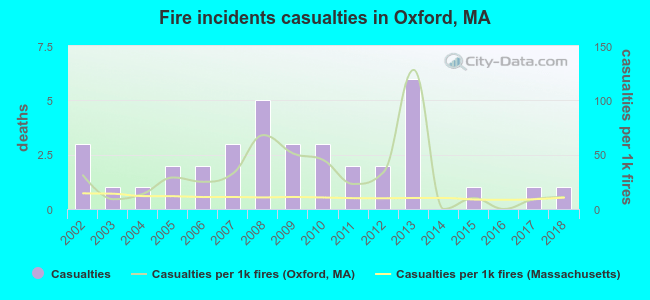 According to the reports from the years 2002 - 2018 the average number of fire-related yearly casualties is 2. The highest number of reported injuries - 6 took place in 2013, and the lowest - 0 in 2014. The data has a declining trend.
The average number of injuries per 1,000 fires is 31. This indicator was the highest - 128 in 2013, and the lowest 0 in 2014. The trend for casualties per 1,000 fires is dropping. Compared to the Massachusetts value the number of injuries per 1,000 incidents is much higher.
According to the reports from the years 2002 - 2018 the average number of fire-related yearly casualties is 2. The highest number of reported injuries - 6 took place in 2013, and the lowest - 0 in 2014. The data has a declining trend.
The average number of injuries per 1,000 fires is 31. This indicator was the highest - 128 in 2013, and the lowest 0 in 2014. The trend for casualties per 1,000 fires is dropping. Compared to the Massachusetts value the number of injuries per 1,000 incidents is much higher.
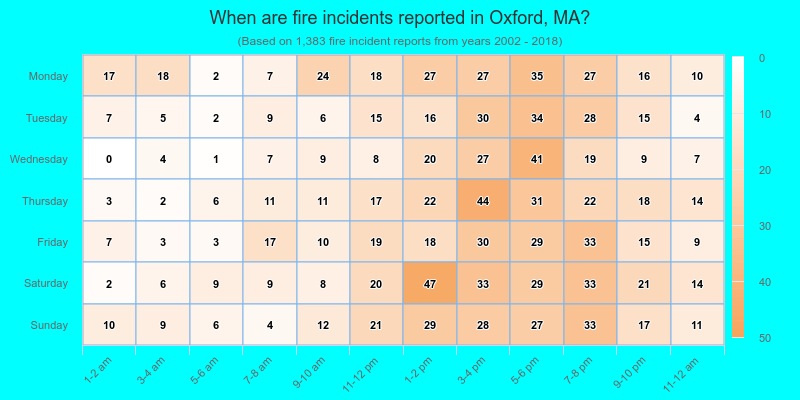
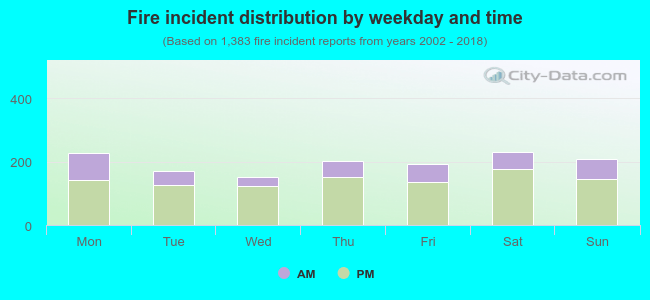 27.8% incidents where reported in the morning and 72.2% in the evening. The most fires (16.7%) took place on Saturday, and the least (11.0%) on Wednesday.
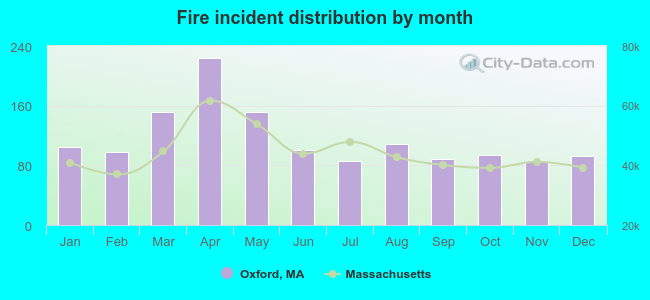 Based on the 1,383 reports from years 2002 - 2018 most fires (16.2%) took place during April, and the least (6.1%) in November.
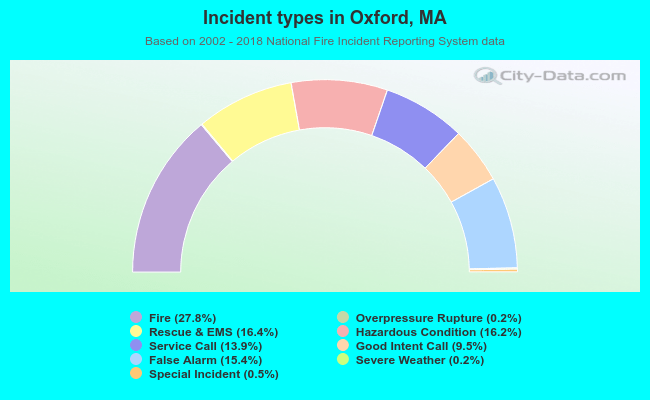 Out of all 4,979 cases reported during the years 2002 - 2018, the most belonged to the categories: Fire (27.8%), Rescue & EMS (16.4%), and Hazardous Condition (16.2%).
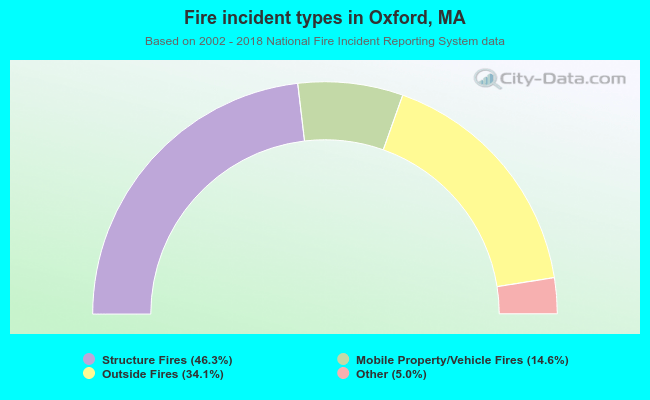 When looking into fire subcategories, the most incidents belonged to: Structure Fires (46.3%), and Outside Fires (34.1%).