Trumann: Fire Incidents, Arkansas (AR)
Where are fire incidents reported in Trumann, AR
Something went wrong! Please refresh the page.
| Fire incidents reported | |
|---|---|
| Sreet name | Count |
| HWY 463 | 122 |
| HWY 63 | 106 |
| I555 HWY | 74 |
| MAIN ST | 74 |
| OZARK AVE | 50 |
| MAPLE GROVE RD | 48 |
| HWY 63 SOUTH | 44 |
| HWY 69 | 42 |
| SPEEDWAY | 40 |
| INDUSTRIAL DR | 36 |
| HWY 463 SOUTH | 34 |
| SMITH AVE | 32 |
| MONROE AVE | 30 |
| ELLIS AVE | 28 |
| GLASGOW RD | 28 |
| HWY 214 | 28 |
| MILDRED AVE | 28 |
| HATCHIECOON RD | 26 |
| MAPLE ST | 26 |
| OLD BAY HWY | 26 |
| OSCAR RD | 24 |
| COMBS LN | 22 |
| WOODRUFF LN | 22 |
| 840 HWY 463 SOUTH | 20 |
| HWY 63 N | 20 |
| HWY 63 NORTH | 20 |
| PINE AVE | 18 |
| PLAZA AVE | 18 |
| RENSHAW LN | 18 |
| TULOT RD | 18 |
| Other | 731 |
2002 - 2018 National Fire Incident Reporting System (NFIRS) incidents
- Incident types reported to NFIRS in Trumann, AR
- 1,85347.6%Fire
- 1,12428.9%Rescue & EMS
- 2987.7%Service Call
- 2616.7%Hazardous Condition
- 1604.1%False Alarm
- 1554.0%Good Intent Call
- 220.6%Special Incident
- 140.4%Severe Weather
- 60.2%Overpressure Rupture
- Fire incident types reported to NFIRS in Trumann, AR
- 97752.7%Outside Fires
- 59732.2%Structure Fires
- 23312.6%Mobile Property/Vehicle Fires
- 462.5%Other
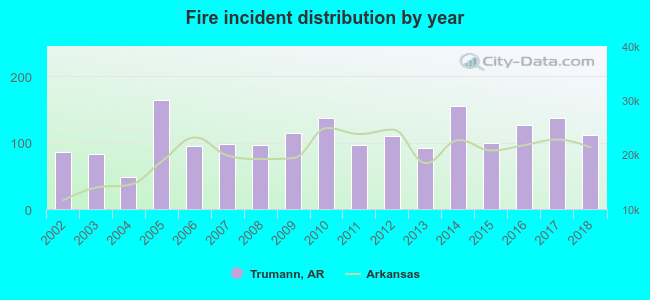 According to the data from the years 2002 - 2018 the average number of fire incidents per year is 109. The highest number of fire incidents - 164 took place in 2005, and the least - 48 in 2004. The data has a growing trend.
The average number of yearly fire incidents per 10k residents in Trumann, AR compared to nearest cities:
(Note: Based on data for the last 3 years, including only cities with population 5,000 and above)
| Trumann: | 173.6 |
| Jonesboro: | 86.8 |
| Paragould: | 93.7 |
| Osceola: | 81.5 |
| Wynne: | 121.5 |
| Marion: | 83.3 |
| Blytheville: | 126.8 |
| West Memphis: | 88.5 |
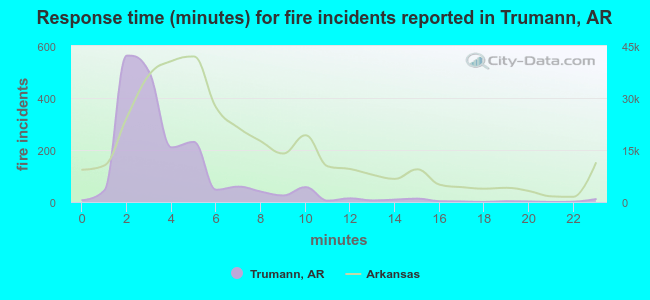 The median response time based on all reported fire incidents is 3 minutes. This is much lower compared to the state median value.
The median response time in Trumann, AR compared to nearest cities:
(Note: Based on data for all years, including only cities with at least 500 fire incidents)
| Trumann: | 3 minutes |
| Marked Tree: | 6 minutes |
| Harrisburg: | 8 minutes |
| Jonesboro: | 5 minutes |
| Bono: | 8 minutes |
| Paragould: | 4 minutes |
| Earle: | 5 minutes |
| Osceola: | 3 minutes |
| Wynne: | 4 minutes |
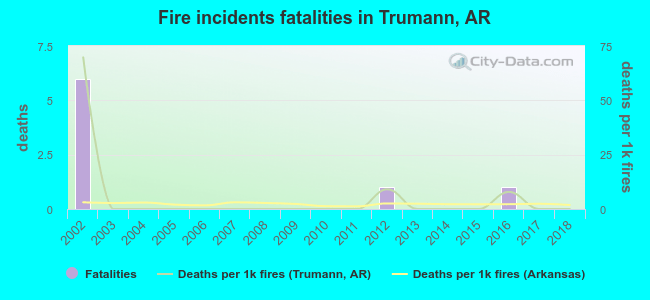 According to the reports from the years 2002 - 2018 the average number of fire-related yearly deaths is 0. The highest number of reported deaths - 6 took place in 2002, and the lowest - 0 in 2003. The data has a decreasing trend.
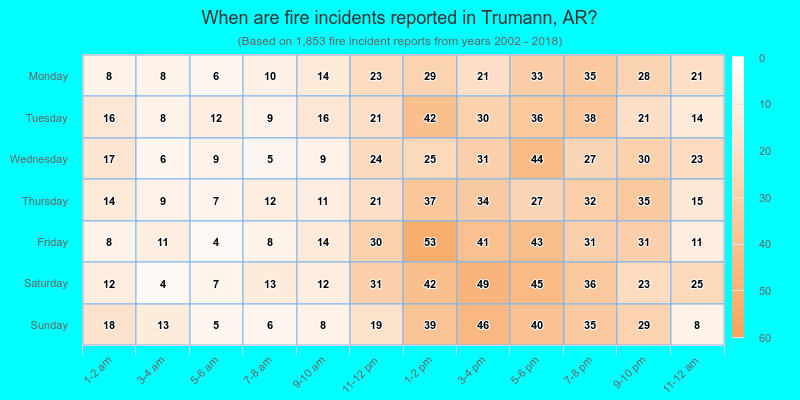
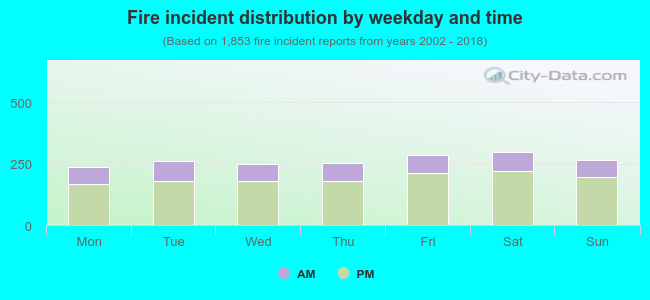 28.0% incidents where reported in the morning and 72.0% in the evening. The most fires (16.1%) took place on Saturday, and the least (12.7%) on Monday.
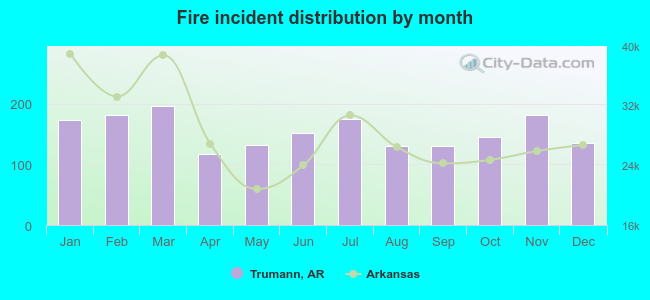 Based on the 1,853 reports from years 2002 - 2018 most fires (10.6%) took place during March, and the least (6.3%) in April.
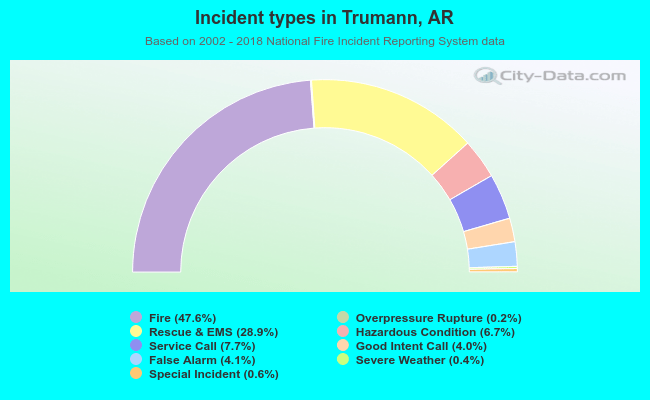 Out of all 3,893 cases reported during the years 2002 - 2018, the most belonged to the categories: Fire (47.6%), Rescue & EMS (28.9%), and Service Call (7.7%).
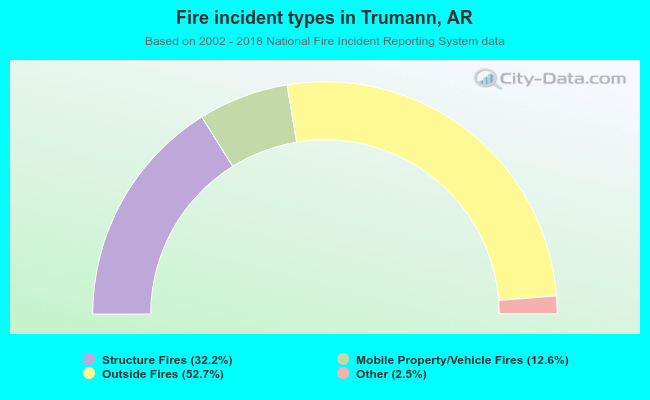 When looking into fire subcategories, the most reports belonged to: Outside Fires (52.7%), and Structure Fires (32.2%).