Paragould: Fire Incidents, Arkansas (AR)
Where are fire incidents reported in Paragould, AR
Something went wrong! Please refresh the page.
| Fire incidents reported | |
|---|---|
| Sreet name | Count |
| KINGS HWY | 214 |
| 412 HWY | 108 |
| 49 HWY | 100 |
| LAKE ST | 94 |
| KINGSHIGHWAY | 82 |
| MAIN ST | 78 |
| 135 HWY | 76 |
| LINWOOD DR | 74 |
| COURT ST | 66 |
| ROCKINGCHAIR RD | 48 |
| KINGSHIGHWAY HWY | 46 |
| 2ND AVE | 44 |
| 7TH ST | 42 |
| GARLAND ST | 42 |
| 12TH AVE | 40 |
| 4TH ST | 40 |
| PRUETT ST | 40 |
| REYNOLDS RD | 40 |
| 10TH AVE | 38 |
| 5TH ST | 38 |
| HWY 358 | 38 |
| FAIRVIEW RD | 36 |
| 3RD AVE | 34 |
| EMERSON ST | 34 |
| HUNT ST | 34 |
| HWY 141 S | 34 |
| HWY 412 WEST | 34 |
| RECTOR RD | 34 |
| GREENE 818 RD | 32 |
| JONES RD | 32 |
| Other | 1,383 |
2003 - 2018 National Fire Incident Reporting System (NFIRS) incidents
- Incident types reported to NFIRS in Paragould, AR
- 3,07544.0%Fire
- 1,24017.7%Service Call
- 73110.5%Rescue & EMS
- 6108.7%Good Intent Call
- 5848.4%False Alarm
- 4746.8%Hazardous Condition
- 2653.8%Special Incident
- 120.2%Severe Weather
- Fire incident types reported to NFIRS in Paragould, AR
- 1,32743.2%Outside Fires
- 1,20339.1%Structure Fires
- 47315.4%Mobile Property/Vehicle Fires
- 722.3%Other
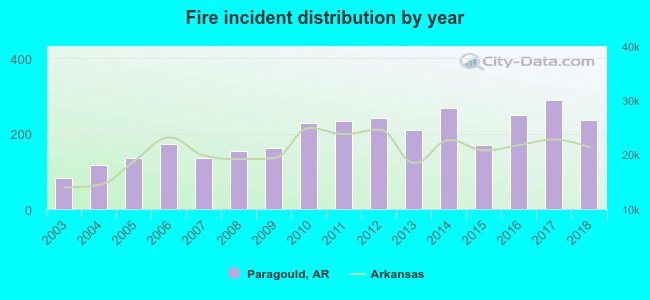 According to the data from the years 2003 - 2018 the average number of fire incidents per year is 192. The highest number of fire incidents - 288 took place in 2017, and the least - 81 in 2003. The data has a rising trend.
The average number of yearly fire incidents per 10k residents in Paragould, AR compared to nearest cities:
(Note: Based on data for the last 3 years, including only cities with population 5,000 and above)
| Paragould: | 93.7 |
| Jonesboro: | 86.8 |
| Trumann: | 173.6 |
| Pocahontas: | 157.0 |
| Blytheville: | 126.8 |
| Osceola: | 81.5 |
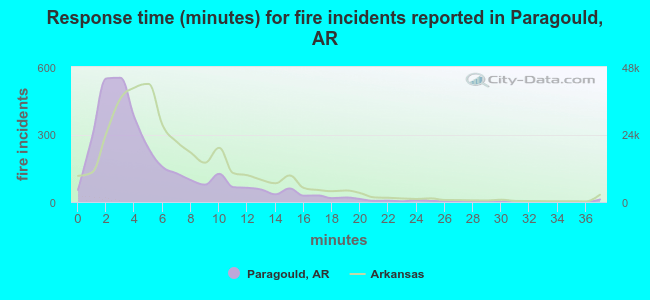 The median response time based on all reported fire incidents is 4 minutes. This is lower compared to the Arkansas median value.
The median response time in Paragould, AR compared to nearest cities:
(Note: Based on data for all years, including only cities with at least 500 fire incidents)
| Paragould: | 4 minutes |
| Rector: | 7 minutes |
| Jonesboro: | 5 minutes |
| Bono: | 8 minutes |
| Walnut Ridge: | 4 minutes |
| Trumann: | 3 minutes |
| Hoxie: | 6 minutes |
| Pocahontas: | 5 minutes |
| Blytheville: | 4 minutes |
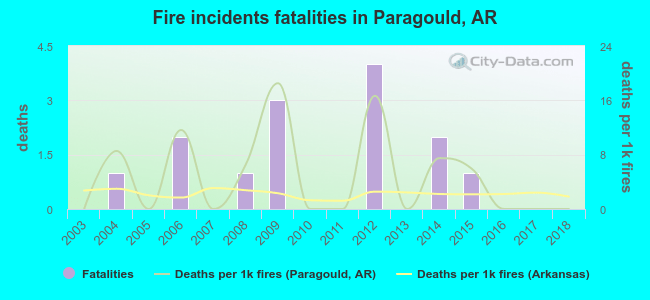 Based on the reports from the years 2003 - 2018 the average number of fire-related yearly deaths is 1. The highest number of reported deaths - 4 took place in 2012, and the lowest - 0 in 2003. The data has a constant trend.
The average number of deaths per 1,000 fires is 5. This indicator was the highest - 19 in 2009, and the lowest 0 in 2003. The trend for fatalities per 1,000 incidents is constant. Compared to the state value the number of deaths per 1,000 fire incidents is much higher.
Based on the reports from the years 2003 - 2018 the average number of fire-related yearly deaths is 1. The highest number of reported deaths - 4 took place in 2012, and the lowest - 0 in 2003. The data has a constant trend.
The average number of deaths per 1,000 fires is 5. This indicator was the highest - 19 in 2009, and the lowest 0 in 2003. The trend for fatalities per 1,000 incidents is constant. Compared to the state value the number of deaths per 1,000 fire incidents is much higher.Deaths per 1,000 incidents in Paragould, AR compared to nearest cities:
(Note: Based on data for all years, including only cities with at least 2,500 fire incidents)
| Paragould: | 4.6 |
| Jonesboro: | 1.8 |
| Blytheville: | 3.5 |
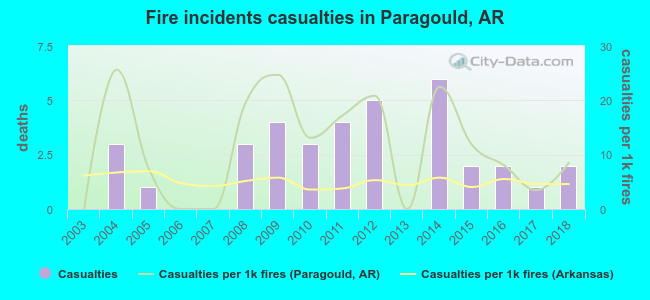 According to the data from the years 2003 - 2018 the average number of fire-related casualties per year is 2. The highest number of casualties - 6 took place in 2014, and the lowest - 0 in 2003. The data has a rising trend.
The average number of casualties per 1,000 fire incidents is 11. This indicator was the highest - 26 in 2004, and the lowest 0 in 2003. The trend for injuries per 1,000 incidents is growing. Compared to the state value the number of casualties per 1,000 fires is much higher.
According to the data from the years 2003 - 2018 the average number of fire-related casualties per year is 2. The highest number of casualties - 6 took place in 2014, and the lowest - 0 in 2003. The data has a rising trend.
The average number of casualties per 1,000 fire incidents is 11. This indicator was the highest - 26 in 2004, and the lowest 0 in 2003. The trend for injuries per 1,000 incidents is growing. Compared to the state value the number of casualties per 1,000 fires is much higher.Casualties per 1,000 incidents in Paragould, AR compared to nearest cities:
(Note: Based on data for all years, including only cities with at least 500 fire incidents)
| Paragould: | 11.7 |
| Rector: | 17.6 |
| Jonesboro: | 14.4 |
| Bono: | 0.0 |
| Walnut Ridge: | 0.0 |
| Trumann: | 0.5 |
| Hoxie: | 1.8 |
| Pocahontas: | 1.2 |
| Blytheville: | 4.9 |
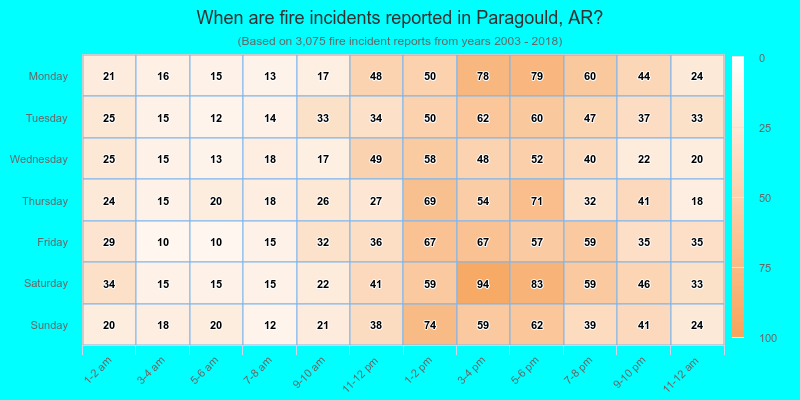
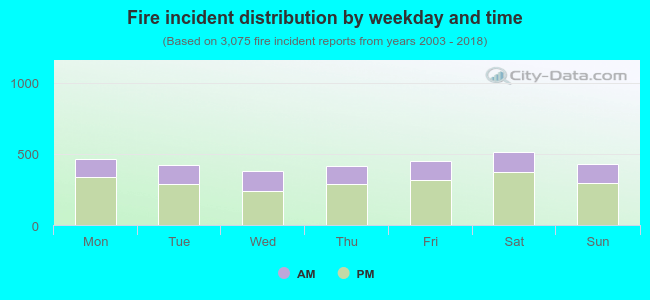 30.3% incidents where reported in the morning and 69.7% in the evening. The most fires (16.8%) took place on Saturday, and the least (12.3%) on Wednesday.
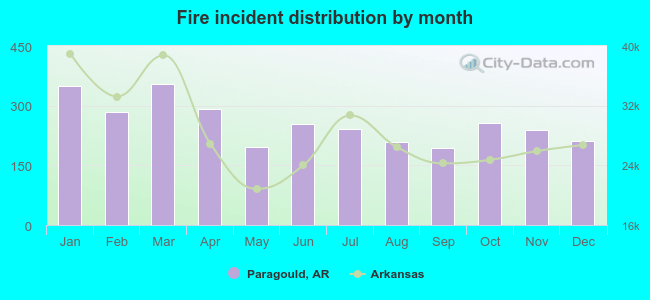 According to the 3,075 incident reports from years 2003 - 2018 most fires (11.5%) took place during March, and the least (6.3%) in September.
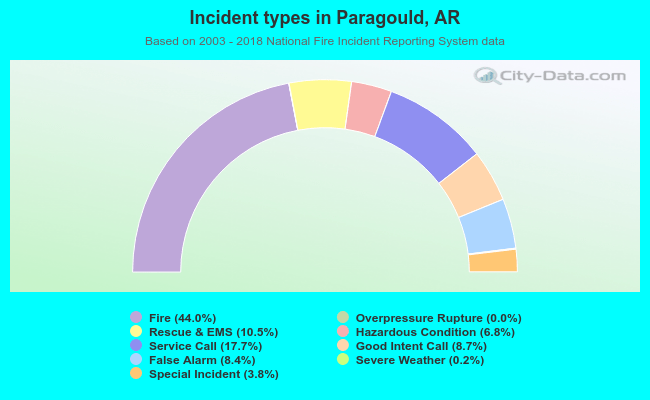 Out of all 6,993 cases reported during the years 2003 - 2018, the most belonged to the categories: Fire (44.0%), Service Call (17.7%), and Rescue & EMS (10.5%).
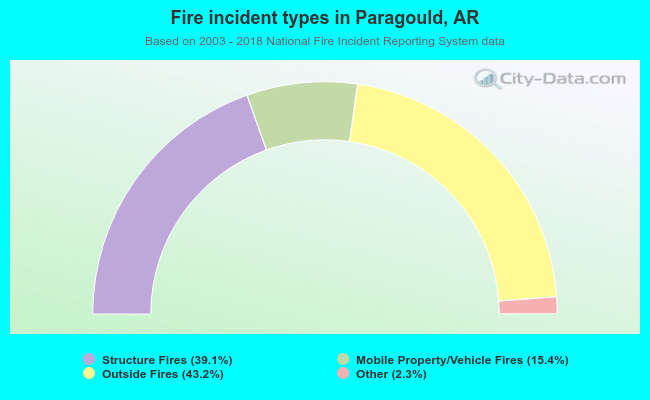 When looking into fire subcategories, the most incidents belonged to: Outside Fires (43.2%), and Structure Fires (39.1%).