Bono: Fire Incidents, Arkansas (AR)
Where are fire incidents reported in Bono, AR
Something went wrong! Please refresh the page.
|
| |||||||||||||||||||||||||||||||||||||||||||||||||||||||||||||||||||||||||||||||||||||||||||||||||||||||||||||
2004 - 2018 National Fire Incident Reporting System (NFIRS) incidents
- Incident types reported to NFIRS in Bono, AR
- 97548.4%Rescue & EMS
- 80239.8%Fire
- 1005.0%Good Intent Call
- 783.9%Hazardous Condition
- 321.6%False Alarm
- 231.1%Service Call
- 30.1%Special Incident
- Fire incident types reported to NFIRS in Bono, AR
- 45857.1%Outside Fires
- 24029.9%Structure Fires
- 8410.5%Mobile Property/Vehicle Fires
- 202.5%Other
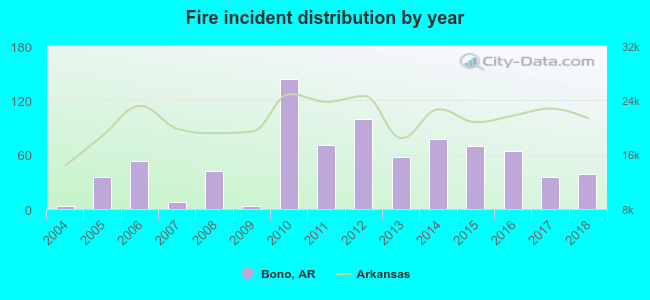 Based on the data from the years 2004 - 2018 the average number of fire incidents per year is 53. The highest number of fire incidents - 144 took place in 2010, and the least - 3 in 2004. The data has a growing trend.
 The median response time based on all reported fire incidents is 8 minutes. This is higher than the state median value.
The median response time in Bono, AR compared to nearest cities:
(Note: Based on data for all years, including only cities with at least 500 fire incidents)
| Bono: | 8 minutes |
| Jonesboro: | 5 minutes |
| Hoxie: | 6 minutes |
| Walnut Ridge: | 4 minutes |
| Paragould: | 4 minutes |
| Trumann: | 3 minutes |
| Harrisburg: | 8 minutes |
| Pocahontas: | 5 minutes |
| Newport: | 4 minutes |
 25.1% incidents where reported in the morning and 74.9% in the evening. The most fires (18.0%) took place on Saturday, and the least (10.6%) on Wednesday.
 According to the 802 fire incidents from years 2004 - 2018 most fires (12.0%) took place during February, and the least (4.6%) in December.
 Out of all 2,014 cases reported during the years 2004 - 2018, the most belonged to the categories: Overpressure Rupture (48.4%), Fire (39.8%), and Service Call (5.0%).
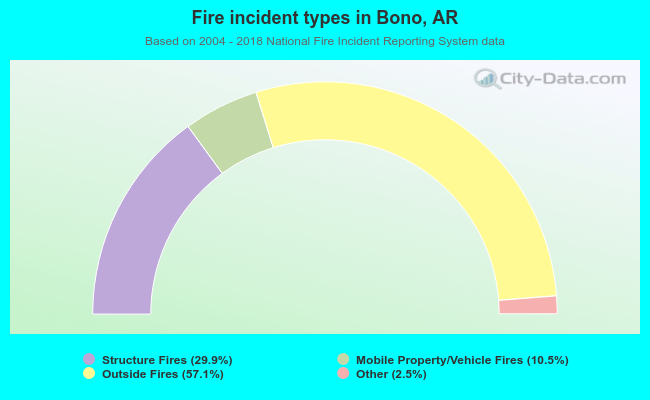 When looking into fire subcategories, the most incidents belonged to: Outside Fires (57.1%), and Structure Fires (29.9%).